Mga Batayang Estadistika
| Pemilik Institusional | 217 total, 217 long only, 0 short only, 0 long/short - change of 9.55% MRQ |
| Alokasi Portofolio Rata-rata | 0.2952 % - change of 7.24% MRQ |
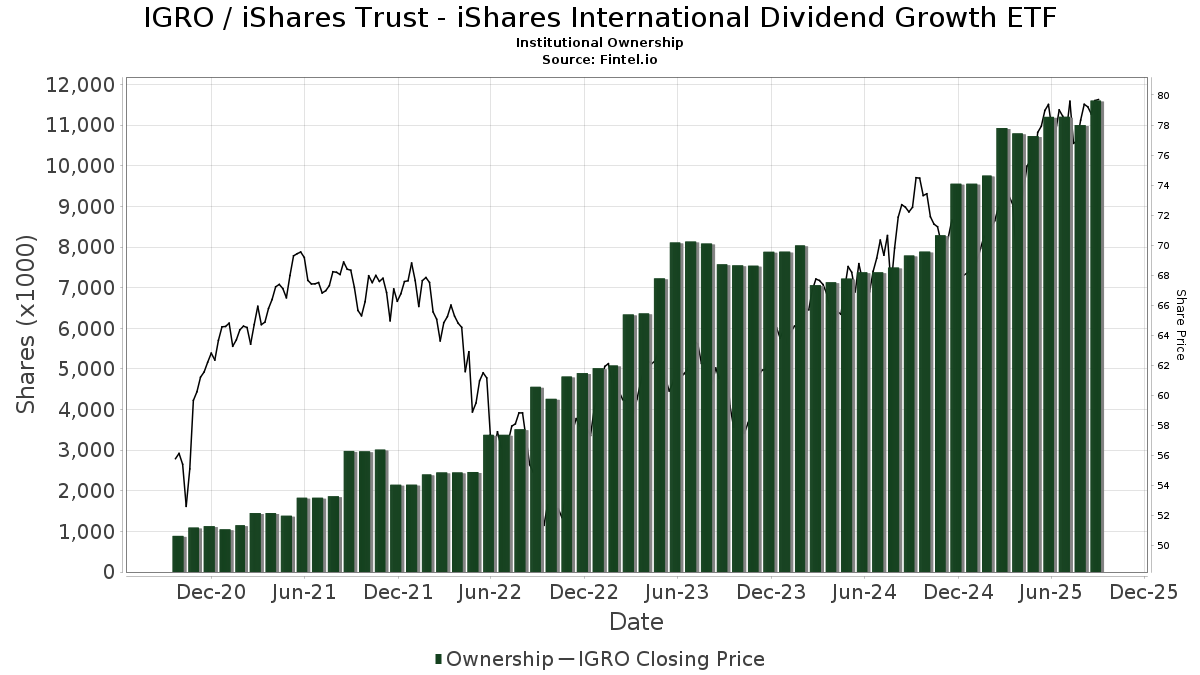
| Saham Institusional (Jangka Panjang) | 11,683,890 (ex 13D/G) - change of 0.48MM shares 4.27% MRQ |
| Nilai Institusional (Jangka Panjang) | $ 831,998 USD ($1000) |
Kepemilikan Institusional dan Pemegang Saham
iShares Trust - iShares International Dividend Growth ETF (US:IGRO) memiliki 217 pemilik institusional dan pemegang saham yang telah mengajukan formulir 13D/G atau 13F kepada Komisi Bursa Efek (Securities Exchange Commission/SEC). Lembaga-lembaga ini memegang total 11,683,890 saham. Pemegang saham terbesar meliputi LPL Financial LLC, Morgan Stanley, Advisor Group Holdings, Inc., Bank Of America Corp /de/, Envestnet Asset Management Inc, Jane Street Group, Llc, Vestmark Advisory Solutions, Inc., Commonwealth Equity Services, Llc, Cetera Investment Advisers, and AJ Advisors, LLC .
Struktur kepemilikan institusional iShares Trust - iShares International Dividend Growth ETF (BATS:IGRO) menunjukkan posisi terkini di perusahaan oleh institusi dan dana, serta perubahan terbaru dalam ukuran posisi. Pemegang saham utama dapat mencakup investor individu, reksa dana, dana lindung nilai, atau institusi. Jadwal 13D menunjukkan bahwa investor memegang (atau pernah memegang) lebih dari 5% saham perusahaan dan bermaksud (atau pernah bermaksud) untuk secara aktif mengejar perubahan strategi bisnis. Jadwal 13G menunjukkan investasi pasif lebih dari 5%.
The share price as of September 5, 2025 is 79.24 / share. Previously, on September 6, 2024, the share price was 71.74 / share. This represents an increase of 10.45% over that period.
Skor Sentimen Dana
Skor Sentimen Dana (sebelumnya dikenal sebagai Skor Akumulasi Kepemilikan) menemukan saham-saham yang paling banyak dibeli oleh dana. Ini adalah hasil dari model kuantitatif multi-faktor yang canggih yang mengidentifikasi perusahaan dengan tingkat akumulasi institusional tertinggi. Model penilaian menggunakan kombinasi dari total peningkatan pemilik yang diungkapkan, perubahan dalam alokasi portofolio pada pemilik tersebut, dan metrik lainnya. Angka berkisar dari 0 hingga 100, dengan angka yang lebih tinggi menunjukkan tingkat akumulasi yang lebih tinggi dibandingkan dengan perusahaan sejenisnya, dan 50 adalah rata-ratanya.
Frekuensi Pembaruan: Setiap Hari
Lihat Ownership Explorer, yang menyediakan daftar perusahaan dengan peringkat tertinggi.
Rasio Put/Call Institusional
Selain melaporkan isu ekuitas dan utang standar, institusi dengan aset di bawah manajemen lebih dari 100 juta dolar AS juga harus mengungkapkan kepemilikan opsi put dan call mereka. Karena opsi put umumnya menunjukkan sentimen negatif, dan opsi call menunjukkan sentimen positif, kita dapat mengetahui sentimen institusional secara keseluruhan dengan memplot rasio put terhadap call. Grafik di sebelah kanan memplot rasio put/call historis untuk instrumen ini.
Menggunakan Rasio Put/Call sebagai indikator sentimen investor mengatasi salah satu kekurangan utama dari penggunaan total kepemilikan institusional, yaitu sejumlah besar aset yang dikelola diinvestasikan secara pasif untuk melacak indeks. Dana yang dikelola secara pasif biasanya tidak membeli opsi, sehingga indikator rasio put/call lebih akurat dalam melacak sentimen dana yang dikelola secara aktif.
Pengajuan 13F dan NPORT
Detail pada pengajuan 13F tersedia gratis. Detail pada pengajuan NP memerlukan keanggotaan premium. Baris berwarna hijau menunjukkan posisi baru. Baris berwarna merah menunjukkan posisi yang sudah ditutup. Klik tautan ini ikon untuk melihat riwayat transaksi selengkapnya.
Tingkatkan
untuk membuka data premium dan mengekspor ke Excel ![]() .
.
| Tanggal File | Sumber | Investor | Ketik | Presyo ng Avg (Silangan) |
Saham | Δ Saham (%) |
Dilaporkan Nilai ($1000) |
Nilai Δ (%) |
Alokasi Port (%) |
|
|---|---|---|---|---|---|---|---|---|---|---|
| 2025-08-05 | 13F | Claro Advisors LLC | 0 | -100.00 | 0 | |||||
| 2025-08-13 | 13F | Beacon Pointe Advisors, LLC | 85,819 | 12.64 | 6,770 | 22.69 | ||||
| 2025-08-13 | 13F | Crescent Grove Advisors, LLC | 3,516 | 0.00 | 277 | 9.06 | ||||
| 2025-07-14 | 13F | Occidental Asset Management, LLC | 4,150 | 43.10 | 327 | 55.71 | ||||
| 2025-07-25 | 13F | Concord Asset Management, LLC/VA | 69,769 | 28.87 | 5,504 | 38.15 | ||||
| 2025-04-23 | 13F | Walkner Condon Financial Advisors LLC | 0 | -100.00 | 0 | |||||
| 2025-08-08 | 13F | Thoroughbred Financial Services, Llc | 3,790 | 0 | ||||||
| 2025-07-29 | 13F | Systelligence, LLC | 0 | -100.00 | 0 | |||||
| 2025-08-14 | 13F | Wells Fargo & Company/mn | 1,014 | -6.80 | 80 | 1.28 | ||||
| 2025-05-27 | NP | EVGLX - The E-Valuator Growth (70%-85%) RMS Fund Service Class Shares | 28,536 | -3.32 | 2,067 | 3.09 | ||||
| 2025-07-29 | 13F | Stratos Wealth Partners, LTD. | 133,193 | 4.21 | 10,508 | 13.49 | ||||
| 2025-08-12 | 13F | BlackRock, Inc. | 79,012 | -71.48 | 6,233 | -68.95 | ||||
| 2025-07-18 | 13F | SigFig Wealth Management, LLC | 4,127 | -36.08 | 324 | -31.06 | ||||
| 2025-08-14 | 13F | Clarity Asset Management, Inc. | 9,994 | -1.81 | 788 | 6.92 | ||||
| 2025-08-12 | 13F | Kohmann Bosshard Financial Services, LLC | 28,481 | 0.00 | 2,247 | 8.87 | ||||
| 2025-08-14 | 13F | Susquehanna International Group, Llp | 200,100 | 15,786 | ||||||
| 2025-07-07 | 13F | Retirement Wealth Solutions LLC | 300 | 24 | ||||||
| 2025-07-24 | 13F | JB Capital LLC | 19,425 | -25.76 | 1,532 | -19.16 | ||||
| 2025-07-30 | 13F | Cullen/frost Bankers, Inc. | 512 | 40 | ||||||
| 2025-08-14 | 13F | Mml Investors Services, Llc | 59,674 | -12.25 | 5 | 0.00 | ||||
| 2025-08-19 | 13F | Advisory Services Network, LLC | 10,435 | 13.09 | 793 | 18.56 | ||||
| 2025-07-14 | 13F | Sweeney & Michel, Llc | 12,626 | -5.61 | 984 | 10.82 | ||||
| 2025-07-25 | 13F | Ackerman Capital Advisors, LLC | 8,892 | -0.25 | 701 | 8.68 | ||||
| 2025-05-27 | NP | EVVLX - The E-Valuator Very Conservative (0%-15%) RMS Fund Service Class Shares | 410 | 106.03 | 30 | 123.08 | ||||
| 2025-07-30 | 13F | D.a. Davidson & Co. | 4,383 | 6.56 | 346 | 16.16 | ||||
| 2025-07-30 | 13F | Probity Advisors, Inc. | 2,975 | 4.61 | 235 | 13.59 | ||||
| 2025-07-11 | 13F | Westfuller Advisors, LLC | 22,814 | 0.00 | 1,800 | 8.90 | ||||
| 2025-07-25 | 13F | Sequoia Financial Advisors, LLC | 19,333 | -15.46 | 1,525 | -7.91 | ||||
| 2025-08-05 | 13F | GPS Wealth Strategies Group, LLC | 599 | 6.77 | 47 | 17.50 | ||||
| 2025-07-22 | 13F | Siligmueller & Norvid Wealth Advisors LLC | 77,994 | 10.77 | 6,050 | 18.61 | ||||
| 2025-08-05 | 13F | Sigma Planning Corp | 4,530 | 357 | ||||||
| 2025-07-22 | 13F | Beacon Financial Advisory LLC | 10,914 | 2.09 | 861 | 11.11 | ||||
| 2025-08-11 | 13F | Strategic Wealth Partners, Ltd. | 742 | 59 | ||||||
| 2025-07-24 | 13F | Capital Advisors, Ltd. LLC | 11,292 | 0.76 | 1 | |||||
| 2025-08-14 | 13F | First Manhattan Co | 6,500 | 0.00 | 513 | 8.94 | ||||
| 2025-07-30 | 13F | Paul Damon & Associates, Inc. | 13,583 | 12.82 | 1,072 | 22.82 | ||||
| 2025-08-14 | 13F | Goldman Sachs Group Inc | 2,738 | 216 | ||||||
| 2025-08-26 | 13F/A | Thrivent Financial For Lutherans | 0 | -100.00 | 0 | -100.00 | ||||
| 2025-07-23 | 13F | Opulen Financial Group LLC | 5,151 | 0.86 | 406 | 10.03 | ||||
| 2025-07-31 | 13F | Guardian Asset Advisors, LLC | 7,002 | 0.76 | 552 | 9.74 | ||||
| 2025-08-18 | 13F | Second Line Capital, LLC | 4,537 | 5.14 | 358 | 14.42 | ||||
| 2025-08-12 | 13F | Waterloo Capital, L.P. | 2,834 | 1.11 | 224 | 9.85 | ||||
| 2025-08-19 | 13F | Delos Wealth Advisors, LLC | 2,374 | 187 | ||||||
| 2025-08-15 | 13F | Morgan Stanley | 772,583 | 6.87 | 60,949 | 16.39 | ||||
| 2025-07-23 | 13F | Detalus Advisors, LLC | 9,520 | -18.33 | 751 | -11.02 | ||||
| 2025-07-11 | 13F | Bond & Devick Financial Network, Inc. | 9,094 | 0.28 | 717 | 9.30 | ||||
| 2025-08-12 | 13F | Steward Partners Investment Advisory, Llc | 831 | 147.32 | 66 | 170.83 | ||||
| 2025-07-15 | 13F | EWG Elevate Inc. | 47,154 | 3,720 | ||||||
| 2025-07-22 | 13F | Confluence Wealth Services, Inc. | 132,341 | 3.80 | 10,440 | 11.27 | ||||
| 2025-08-14 | 13F | Guardian Wealth Advisors, Llc / Nc | 7,258 | -11.86 | 573 | -4.03 | ||||
| 2025-07-25 | 13F | Envestnet Portfolio Solutions, Inc. | 51,338 | -26.34 | 4,050 | -19.77 | ||||
| 2025-08-04 | 13F | Mayflower Financial Advisors, LLC | 3,732 | -13.29 | 294 | -5.47 | ||||
| 2025-08-04 | 13F | Human Investing LLC | 6,364 | 48.07 | 502 | 61.41 | ||||
| 2025-07-23 | 13F | Fortis Advisors, LLC | 3,405 | -9.90 | 269 | -1.83 | ||||
| 2025-08-14 | 13F | Mariner, LLC | 48,085 | 52.32 | 3,793 | 65.92 | ||||
| 2025-08-13 | 13F | Providence Capital Advisors, LLC | 11 | 1 | ||||||
| 2025-08-14 | 13F | Qube Research & Technologies Ltd | 919 | 72 | ||||||
| 2025-07-29 | 13F | Roof Eidam & Maycock/adv | 14,200 | 0.00 | 1,120 | 8.95 | ||||
| 2025-08-07 | 13F | Allworth Financial LP | 4 | 0.00 | 0 | |||||
| 2025-08-08 | 13F | Kingsview Wealth Management, LLC | 13,191 | 6.88 | 1,041 | 16.33 | ||||
| 2025-08-05 | 13F | GHP Investment Advisors, Inc. | 60,254 | 0.03 | 4,753 | 8.94 | ||||
| 2025-07-23 | 13F | Valmark Advisers, Inc. | 3,209 | 1.13 | 253 | 10.48 | ||||
| 2025-07-30 | 13F | Princeton Global Asset Management LLC | 5,346 | 17.99 | 422 | 28.35 | ||||
| 2025-08-14 | 13F | UBS Group AG | 251,673 | 30.29 | 19,854 | 41.89 | ||||
| 2025-07-22 | 13F | MAS Advisors LLC | 10,114 | 798 | ||||||
| 2025-09-04 | 13F/A | Advisor Group Holdings, Inc. | 703,833 | 11.46 | 55,426 | 21.17 | ||||
| 2025-07-31 | 13F | Glass Jacobson Investment Advisors llc | 248 | -4.98 | 20 | 11.76 | ||||
| 2025-08-08 | 13F | AJ Advisors, LLC | 385,143 | 20.13 | 30,384 | 30.82 | ||||
| 2025-08-14 | 13F | Glen Eagle Advisors, LLC | 605 | 83.33 | 48 | 104.35 | ||||
| 2025-07-29 | 13F | Kraft, Davis & Associates, LLC | 27,601 | 2,149 | ||||||
| 2025-07-10 | 13F | Exchange Traded Concepts, Llc | 1,620 | 128 | ||||||
| 2025-08-06 | 13F | Golden State Wealth Management, LLC | 21,663 | 7.13 | 1,709 | 16.73 | ||||
| 2025-08-14 | 13F | Jane Street Group, Llc | 572,325 | 189.04 | 45,151 | 214.79 | ||||
| 2025-07-14 | 13F | Park Avenue Securities Llc | 23,002 | -33.67 | 2 | -50.00 | ||||
| 2025-07-18 | 13F | Bourgeon Capital Management Llc | 11,996 | 0.87 | 946 | 9.87 | ||||
| 2025-08-06 | 13F | Commonwealth Equity Services, Llc | 506,587 | 2.75 | 40 | 11.43 | ||||
| 2025-07-10 | 13F | Sovran Advisors, LLC | 2,996 | 0.50 | 234 | 7.87 | ||||
| 2025-07-31 | 13F | Cambridge Investment Research Advisors, Inc. | 121,428 | 45.49 | 10 | 50.00 | ||||
| 2025-08-12 | 13F | Integrated Advisors Network LLC | 32,435 | -34.24 | 2,559 | -28.39 | ||||
| 2025-08-13 | 13F | Capital Analysts, Inc. | 15,463 | 45.62 | 1 | |||||
| 2025-08-12 | 13F | Franklin Resources Inc | 9,629 | -3.43 | 760 | 5.12 | ||||
| 2025-07-23 | 13F | Prime Capital Investment Advisors, LLC | 40,405 | 19.64 | 3,188 | 30.29 | ||||
| 2025-08-05 | 13F | Bank Of Montreal /can/ | 276 | 18.45 | 22 | 31.25 | ||||
| 2025-08-08 | 13F | Cornerstone Advisors Asset Management, Inc | 41,041 | 0.00 | 3,238 | 8.88 | ||||
| 2025-07-14 | 13F | Gries Financial Llc | 12,117 | 2.84 | 956 | 11.96 | ||||
| 2025-08-05 | 13F | Huntington National Bank | 154 | 2,450.00 | ||||||
| 2025-08-14 | 13F/A | Barclays Plc | 84 | 0.00 | 0 | |||||
| 2025-08-01 | 13F | Envestnet Asset Management Inc | 603,380 | -23.01 | 47,601 | -16.16 | ||||
| 2025-08-01 | 13F | Rossby Financial, LCC | 91 | 116.67 | 7 | 133.33 | ||||
| 2025-08-12 | 13F | Virtu Financial LLC | 17,212 | 1 | ||||||
| 2025-07-28 | 13F | WealthPlan Investment Management, LLC | 163,807 | 56.49 | 12,923 | 70.43 | ||||
| 2025-08-14 | 13F/A | Rockefeller Capital Management L.P. | 57,347 | -0.06 | 4,524 | 8.85 | ||||
| 2025-07-17 | 13F/A | Capital Investment Advisors, LLC | 41,567 | -2.88 | 3,279 | 5.77 | ||||
| 2025-07-16 | 13F | Signature Resources Capital Management, LLC | 314 | 0.00 | 25 | 9.09 | ||||
| 2025-08-11 | 13F | Synergy Investment Management, LLC | 3,358 | -43.57 | 265 | -38.75 | ||||
| 2025-08-12 | 13F | MAI Capital Management | 360 | 0.00 | 28 | 7.69 | ||||
| 2025-07-23 | 13F | Sax Wealth Advisors, Llc | 6,860 | 3.03 | 541 | 12.24 | ||||
| 2025-08-12 | 13F/A | Cozad Asset Management Inc | 2,595 | 205 | ||||||
| 2025-08-13 | 13F | Northwestern Mutual Wealth Management Co | 66,130 | 55.25 | 5,217 | 69.08 | ||||
| 2025-05-27 | NP | EVMLX - The E-Valuator Moderate (50%-70%) RMS Fund Service Class Shares | 9,836 | -31.17 | 713 | -26.67 | ||||
| 2025-05-15 | 13F/A | Orion Portfolio Solutions, LLC | 11,808 | 29.80 | 855 | 38.35 | ||||
| 2025-07-31 | 13F | WFA Asset Management Corp | 8,375 | -43.38 | 564 | -43.37 | ||||
| 2025-07-29 | 13F | Rodgers & Associates, LTD | 0 | -100.00 | 0 | |||||
| 2025-08-13 | 13F | Flow Traders U.s. Llc | 106,890 | 41.21 | 8 | 60.00 | ||||
| 2025-08-14 | 13F | Raymond James Financial Inc | 369,512 | -4.51 | 29,151 | 4.00 | ||||
| 2025-04-21 | 13F | ORG Partners LLC | 0 | -100.00 | 0 | |||||
| 2025-07-17 | 13F | Chatham Capital Group, Inc. | 4,715 | 0.86 | 372 | 9.76 | ||||
| 2025-08-14 | 13F | Keebeck Wealth Management, LLC | 2,942 | -32.31 | 232 | -26.11 | ||||
| 2025-08-14 | 13F | Icon Wealth Advisors, LLC | 9,917 | 29.60 | 782 | 41.16 | ||||
| 2025-08-14 | 13F | Integrated Wealth Concepts LLC | 14,790 | 36.34 | 1,167 | 48.54 | ||||
| 2025-07-17 | 13F | Beacon Capital Management, LLC | 29 | 0.00 | 2 | 0.00 | ||||
| 2025-08-08 | 13F | CWS Financial Advisors, LLC | 3,304 | 261 | ||||||
| 2025-08-12 | 13F | Change Path, LLC | 50,317 | -20.43 | 3,970 | -13.36 | ||||
| 2025-08-08 | 13F | Pnc Financial Services Group, Inc. | 6,875 | -72.76 | 542 | -70.35 | ||||
| 2025-08-05 | 13F | C2P Capital Advisory Group, LLC d.b.a. Prosperity Capital Advisors | 0 | -100.00 | 0 | |||||
| 2025-07-25 | 13F | Atria Wealth Solutions, Inc. | 10,997 | -54.33 | 868 | -50.29 | ||||
| 2025-08-13 | 13F | EverSource Wealth Advisors, LLC | 100 | 0.00 | 8 | 0.00 | ||||
| 2025-08-14 | 13F | Royal Bank Of Canada | 156,869 | 175.76 | 12,375 | 200.36 | ||||
| 2025-08-14 | 13F | Pine Harbor Wealth Management, LLC | 12,789 | -0.51 | 1,009 | 8.27 | ||||
| 2025-08-11 | 13F | HighTower Advisors, LLC | 15,873 | 72.78 | 1,252 | 88.27 | ||||
| 2025-04-25 | 13F | MidAtlantic Capital Management, Inc. | 0 | -100.00 | 0 | |||||
| 2025-07-24 | 13F | Eastern Bank | 72 | 6 | ||||||
| 2025-08-14 | 13F | Arete Wealth Advisors, LLC | 7,358 | 5.42 | 1 | |||||
| 2025-07-30 | 13F | Financial Perspectives, Inc | 5,537 | 6.42 | 437 | 15.96 | ||||
| 2025-07-17 | 13F | Janney Montgomery Scott LLC | 175,680 | 0.80 | 14 | 8.33 | ||||
| 2025-07-17 | 13F | LifeGoal Wealth Advisors | 18,207 | 19.34 | 1,436 | 29.95 | ||||
| 2025-08-28 | NP | GPMIX - GuidePath(R) Multi-Asset Income Allocation Fund Service Shares | 17,613 | -42.25 | 1,389 | -37.12 | ||||
| 2025-07-24 | 13F | Us Bancorp \de\ | 27,035 | 0.01 | 2,133 | 8.89 | ||||
| 2025-08-15 | 13F | Captrust Financial Advisors | 75,155 | 6.74 | 5,929 | 16.25 | ||||
| 2025-07-28 | 13F | WealthPLAN Partners, LLC | 84,975 | -37.15 | 6,704 | -31.56 | ||||
| 2025-07-24 | 13F | Brandywine Oak Private Wealth Llc | 17,344 | 0.00 | 1,368 | 8.92 | ||||
| 2025-07-29 | 13F | ShoreHaven Wealth Partners, LLC | 25,394 | -1.54 | 2,003 | 7.23 | ||||
| 2025-08-07 | 13F | Summit X, LLC | 10,969 | -24.68 | 865 | -17.93 | ||||
| 2025-08-12 | 13F | O'shaughnessy Asset Management, Llc | 328 | 26 | ||||||
| 2025-08-06 | 13F | SOUTH STATE Corp | 0 | -100.00 | 0 | |||||
| 2025-08-14 | 13F | Ausdal Financial Partners, Inc. | 3,849 | -9.11 | 304 | -0.98 | ||||
| 2025-08-19 | 13F | Anchor Investment Management, LLC | 25,262 | 0.00 | 1,993 | 8.91 | ||||
| 2025-07-23 | 13F | Prasad Wealth Partners, LLC | 0 | -100.00 | 0 | |||||
| 2025-08-06 | 13F | Legacy Wealth Managment, LLC/ID | 0 | -100.00 | 0 | |||||
| 2025-08-18 | 13F/A | National Bank Of Canada /fi/ | 275 | 22 | ||||||
| 2025-07-03 | 13F | McLean Asset Management Corp | 2,800 | 221 | ||||||
| 2025-08-08 | 13F | Security Financial Services, INC. | 3,879 | -17.34 | 306 | -9.73 | ||||
| 2025-08-12 | 13F | J.w. Cole Advisors, Inc. | 2,879 | 227 | ||||||
| 2025-08-12 | 13F | PSI Advisors, LLC | 0 | -100.00 | 0 | |||||
| 2025-08-14 | 13F | Stifel Financial Corp | 12,486 | 19.37 | 985 | 30.12 | ||||
| 2025-04-17 | 13F | Columbus Macro, LLC | 0 | -100.00 | 0 | |||||
| 2025-07-21 | 13F | Ameritas Advisory Services, LLC | 2,396 | -30.83 | 189 | -23.58 | ||||
| 2025-08-14 | 13F | Fmr Llc | 1,580 | 236.89 | 125 | 264.71 | ||||
| 2025-04-29 | 13F | Element Wealth, LLC | 0 | -100.00 | 0 | |||||
| 2025-08-12 | 13F | Proequities, Inc. | 0 | 0 | ||||||
| 2025-07-29 | 13F | Signature Estate & Investment Advisors Llc | 5,964 | 0.69 | 470 | 9.56 | ||||
| 2025-08-11 | 13F | Cornerstone Planning Group LLC | 133 | -59.57 | 10 | -58.33 | ||||
| 2025-08-06 | 13F | Quadrant Private Wealth Management, LLC | 3,862 | -39.55 | 305 | -34.20 | ||||
| 2025-05-12 | 13F | Citigroup Inc | 0 | -100.00 | 0 | |||||
| 2025-07-11 | 13F | Farther Finance Advisors, LLC | 1,950 | 154 | ||||||
| 2025-07-29 | 13F | Stratos Wealth Advisors, LLC | 21,119 | -4.37 | 1,666 | 4.19 | ||||
| 2025-08-14 | 13F | EP Wealth Advisors, Inc. | 17,766 | 0.00 | 1,402 | 8.94 | ||||
| 2025-08-11 | 13F | Regal Investment Advisors LLC | 5,088 | 10.42 | 401 | 20.42 | ||||
| 2025-08-28 | NP | Northern Lights Fund Trust - Ocean Park International ETF | 1,620 | 128 | ||||||
| 2025-07-18 | 13F | Lynx Investment Advisory | 72,615 | 14.82 | 5,729 | 25.04 | ||||
| 2025-08-13 | 13F | Continuum Advisory, LLC | 3,335 | 705.56 | 263 | 806.90 | ||||
| 2025-07-23 | 13F | Avantra Family Wealth, Inc. | 5,713 | 1.67 | 451 | 10.57 | ||||
| 2025-05-15 | 13F | Hrt Financial Lp | 0 | -100.00 | 0 | |||||
| 2025-07-08 | 13F | Lowe Wealth Advisors, LLC | 63,145 | 35.25 | 4,982 | 47.32 | ||||
| 2025-08-08 | 13F | Cetera Investment Advisers | 440,569 | 1.17 | 34,756 | 10.18 | ||||
| 2025-05-27 | NP | EVAGX - The E-Valuator Aggressive Growth (85%-99%) RMS Fund Service Class Shares | 34,927 | 15.82 | 2,530 | 23.47 | ||||
| 2025-08-07 | 13F | Proficio Capital Partners LLC | 115,943 | 9,147 | ||||||
| 2025-07-24 | 13F | McKinley Carter Wealth Services, Inc. | 36,473 | 4.16 | 2,877 | 13.45 | ||||
| 2025-08-12 | 13F | LPL Financial LLC | 781,297 | -11.63 | 61,637 | -3.76 | ||||
| 2025-08-13 | 13F | Northwest & Ethical Investments L.P. | 94,762 | 0.00 | 7,476 | 8.90 | ||||
| 2025-03-12 | 13F/A | Private Capital Management Llc | 3,206 | 0.00 | 216 | 0.47 | ||||
| 2025-05-27 | NP | EVCLX - The E-Valuator Conservative (15%-30%) RMS Fund Service Class Shares | 1,516 | 6.91 | 110 | 13.54 | ||||
| 2025-08-06 | 13F | AE Wealth Management LLC | 58 | -36.26 | 5 | -33.33 | ||||
| 2025-08-08 | 13F | Intrua Financial, LLC | 34,968 | 10.14 | 2,759 | 19.97 | ||||
| 2025-08-11 | 13F | Aptus Capital Advisors, LLC | 26,871 | -3.00 | 2,120 | 5.63 | ||||
| 2025-08-07 | 13F | Legacy Financial Advisors, Inc. | 0 | -100.00 | 0 | |||||
| 2025-07-28 | 13F | Harbour Investments, Inc. | 1,935 | 0.83 | 153 | 10.14 | ||||
| 2025-08-12 | 13F | Nuveen, LLC | 0 | -100.00 | 0 | |||||
| 2025-08-05 | 13F | ADG Wealth Management Group, LLC | 57,062 | 0.82 | 4,502 | 9.78 | ||||
| 2025-08-08 | 13F | Gts Securities Llc | 18,267 | 1,441 | ||||||
| 2025-08-08 | 13F | Bailard, Inc. | 63,189 | 2.12 | 4,985 | 11.20 | ||||
| 2025-05-12 | 13F | Independent Advisor Alliance | 0 | -100.00 | 0 | |||||
| 2025-07-30 | 13F | Bogart Wealth, LLC | 0 | -100.00 | 0 | |||||
| 2025-07-08 | 13F | Nbc Securities, Inc. | 676 | 3.52 | 0 | |||||
| 2025-07-22 | 13F | Wealthcare Advisory Partners LLC | 3,149 | 248 | ||||||
| 2025-08-13 | 13F | Colonial Trust Co / SC | 28,601 | 13.22 | 2,256 | 23.35 | ||||
| 2025-08-27 | 13F/A | Brinker Capital Investments, LLC | 8,692 | -26.39 | 686 | -19.88 | ||||
| 2025-08-06 | 13F | Aspect Partners, LLC | 7,816 | -0.41 | 617 | 8.45 | ||||
| 2025-08-14 | 13F | Mercer Global Advisors Inc /adv | 8,440 | -63.11 | 666 | -59.87 | ||||
| 2025-08-04 | 13F | Spire Wealth Management | 208 | -10.34 | 16 | 0.00 | ||||
| 2025-08-08 | 13F | Avantax Advisory Services, Inc. | 42,603 | 7.20 | 3,361 | 16.75 | ||||
| 2025-08-04 | 13F | Pensionmark Financial Group, Llc | 3,876 | -23.63 | 306 | -16.89 | ||||
| 2025-08-12 | 13F | Park Square Financial Group, LLC | 27 | -37.21 | 2 | -33.33 | ||||
| 2025-07-17 | 13F | Fifth Third Securities, Inc. | 137,357 | 7.43 | 10,836 | 16.99 | ||||
| 2025-07-31 | 13F | Leavell Investment Management, Inc. | 2,875 | 0.00 | 227 | 8.65 | ||||
| 2025-08-14 | 13F | Citadel Advisors Llc | 43,896 | 197.70 | 3,463 | 224.16 | ||||
| 2025-06-26 | NP | BlackRock Funds II - BlackRock Dynamic High Income Portfolio Investor A This fund is a listed as child fund of BlackRock, Inc. and if that institution has disclosed ownership in this security, then these positions will not be double counted when calculating total shares and total value | 274,766 | 0.00 | 20,679 | 7.53 | ||||
| 2025-08-14 | 13F | Comerica Bank | 1,555 | -34.69 | 123 | -29.07 | ||||
| 2025-08-13 | 13F | Mount Yale Investment Advisors, LLC | 296 | 23 | ||||||
| 2025-08-13 | 13F | Baltimore-Washington Financial Advisors, Inc. | 145,997 | 17.21 | 11,518 | 27.64 | ||||
| 2025-08-13 | 13F | Berkshire Asset Management Llc/pa | 39,665 | -0.21 | 3,129 | 4.75 | ||||
| 2025-07-24 | 13F | IFP Advisors, Inc | 396 | 647.17 | 31 | 933.33 | ||||
| 2025-08-14 | 13F | Sunbelt Securities, Inc. | 34,569 | -5.99 | 2,349 | -11.79 | ||||
| 2025-07-24 | 13F | Beacon Bridge Wealth Partners, LLC | 4,937 | 15.57 | 389 | 25.89 | ||||
| 2025-07-30 | 13F | LGT Financial Advisors LLC | 1,022 | -40.30 | 81 | -34.96 | ||||
| 2025-05-15 | 13F | Gladstone Institutional Advisory LLC | 0 | -100.00 | 0 | |||||
| 2025-08-11 | 13F | Private Advisor Group, LLC | 8,969 | 3.75 | 708 | 12.94 | ||||
| 2025-05-02 | 13F | Signaturefd, Llc | 0 | -100.00 | 0 | |||||
| 2025-05-27 | NP | EVTTX - The E-Valuator Conservative/Moderate (30%-50%) RMS Fund Service Class Shares | 2,247 | 24.42 | 163 | 32.79 | ||||
| 2025-07-29 | 13F | International Assets Investment Management, Llc | 5,238 | -31.60 | 413 | -25.45 | ||||
| 2025-05-14 | 13F | Per Stirling Capital Management, LLC. | 0 | -100.00 | 0 | |||||
| 2025-08-06 | 13F | First Horizon Advisors, Inc. | 330 | -53.97 | 26 | -49.02 | ||||
| 2025-08-15 | 13F | Kestra Advisory Services, LLC | 8,791 | 0.76 | 694 | 9.65 | ||||
| 2025-05-05 | 13F | Transce3nd, LLC | 0 | -100.00 | 0 | |||||
| 2025-08-12 | 13F | SRS Capital Advisors, Inc. | 700 | 55 | ||||||
| 2025-08-13 | 13F | West Wealth Group, LLC | 4,920 | -25.99 | 379 | -21.58 | ||||
| 2025-07-14 | 13F | Pacifica Partners Inc. | 232 | -21.09 | 18 | -14.29 | ||||
| 2025-08-14 | 13F | GWM Advisors LLC | 4,106 | -30.34 | 324 | -24.18 | ||||
| 2025-07-23 | 13F | Heck Capital Advisors, LLC | 23,950 | 106.45 | 1,889 | 124.88 | ||||
| 2025-08-11 | 13F | CFS Investment Advisory Services, LLC | 69,654 | 47.34 | 5 | 66.67 | ||||
| 2025-07-25 | 13F | Concord Wealth Partners | 69,769 | 55.69 | 5,504 | 69.56 | ||||
| 2025-07-29 | 13F | Private Trust Co Na | 8,491 | 3.27 | 670 | 12.44 | ||||
| 2025-08-08 | 13F | Larson Financial Group LLC | 15,070 | 56.72 | 1,189 | 70.69 | ||||
| 2025-07-03 | 13F | TrueWealth Advisors, LLC | 70,717 | -2.83 | 5,579 | 5.82 | ||||
| 2025-08-13 | 13F | Scotia Capital Inc. | 2,671 | -11.06 | 211 | -3.23 | ||||
| 2025-07-30 | 13F | Fiduciary Planning LLC | 10,572 | 0.21 | 834 | 9.16 | ||||
| 2025-08-04 | 13F | IFG Advisory, LLC | 2,901 | 229 | ||||||
| 2025-08-08 | 13F | Creative Planning | 23,004 | 0.00 | 1,815 | 8.88 | ||||
| 2025-07-09 | 13F | Beacon Financial Group | 37,158 | -34.87 | 2,931 | -29.07 | ||||
| 2025-08-06 | 13F | Vestmark Advisory Solutions, Inc. | 533,814 | 47.31 | 42,113 | 60.43 | ||||
| 2025-08-12 | 13F | Goepper Burkhardt LLC | 8,767 | 692 | ||||||
| 2025-08-05 | 13F | Bank of New York Mellon Corp | 6,268 | 495 | ||||||
| 2025-08-13 | 13F | Millstone Evans Group, LLC | 875 | 0.00 | 69 | 9.52 | ||||
| 2025-08-04 | 13F | Assetmark, Inc | 93,498 | -39.90 | 7,376 | -34.55 | ||||
| 2025-05-15 | 13F | Lebenthal Global Advisors, LLC | 0 | -100.00 | 0 | -100.00 | ||||
| 2025-06-03 | 13F | Invst, LLC | 11,542 | 8.07 | 836 | 15.31 | ||||
| 2025-08-11 | 13F | Principal Securities, Inc. | 4,465 | -53.75 | 352 | -46.34 | ||||
| 2025-08-12 | 13F | Jpmorgan Chase & Co | 247,129 | -2.34 | 19,496 | 6.36 | ||||
| 2025-08-14 | 13F | Bank Of America Corp /de/ | 619,020 | 11.16 | 48,834 | 21.05 | ||||
| 2025-08-15 | 13F | Equitable Holdings, Inc. | 15,787 | 35.52 | 1,245 | 47.69 | ||||
| 2025-07-18 | 13F | Truist Financial Corp | 72,364 | 0.34 | 5,709 | 9.26 | ||||
| 2025-08-12 | 13F | Global Retirement Partners, LLC | 3,105 | -12.26 | 245 | 1.67 | ||||
| 2025-08-13 | 13F | Jones Financial Companies Lllp | 38,684 | 174.80 | 3,041 | 196.88 | ||||
| 2025-08-13 | 13F | Rsm Us Wealth Management Llc | 3,851 | 0.36 | 304 | 9.39 |