Mga Batayang Estadistika
| Pemilik Institusional | 163 total, 163 long only, 0 short only, 0 long/short - change of -1.81% MRQ |
| Alokasi Portofolio Rata-rata | 0.0514 % - change of -3.48% MRQ |
| Saham Institusional (Jangka Panjang) | 10,540,940 (ex 13D/G) - change of -0.05MM shares -0.51% MRQ |
| Nilai Institusional (Jangka Panjang) | $ 143,851 USD ($1000) |
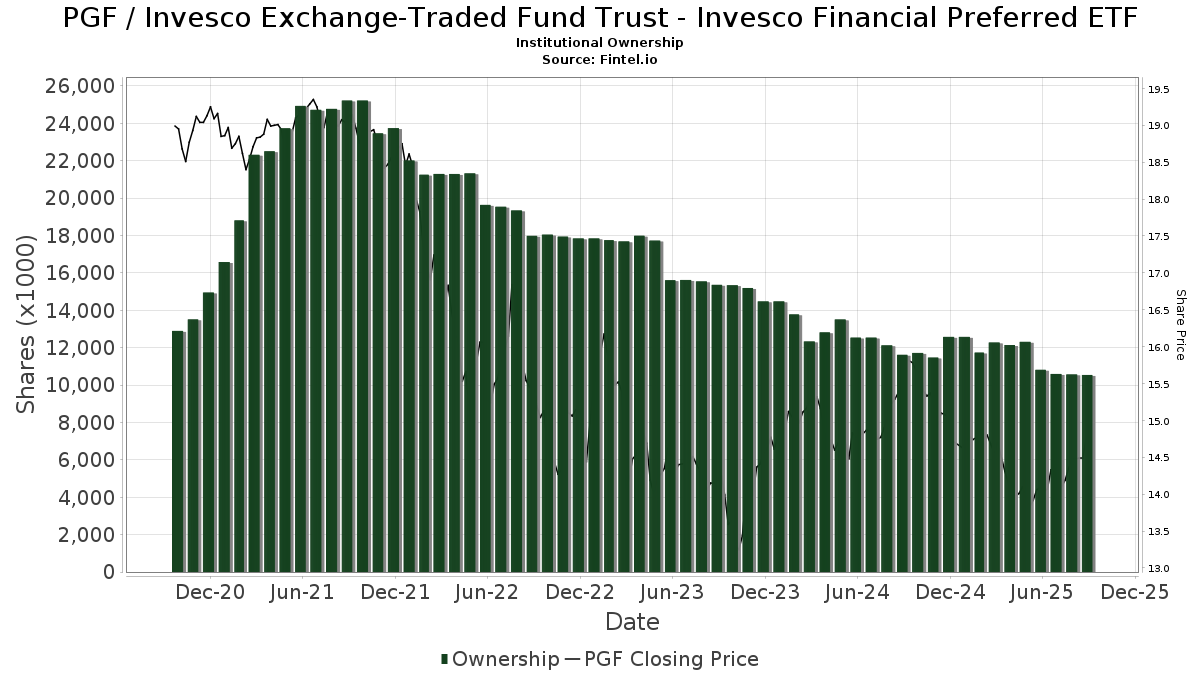
Kepemilikan Institusional dan Pemegang Saham
Invesco Exchange-Traded Fund Trust - Invesco Financial Preferred ETF (US:PGF) memiliki 163 pemilik institusional dan pemegang saham yang telah mengajukan formulir 13D/G atau 13F kepada Komisi Bursa Efek (Securities Exchange Commission/SEC). Lembaga-lembaga ini memegang total 10,540,940 saham. Pemegang saham terbesar meliputi Morgan Stanley, UBS Group AG, LPL Financial LLC, Wells Fargo & Company/mn, Bank Of America Corp /de/, Private Advisor Group, LLC, Evoke Wealth, Llc, North Star Investment Management Corp., Investors Research Corp, and Orion Portfolio Solutions, LLC .
Struktur kepemilikan institusional Invesco Exchange-Traded Fund Trust - Invesco Financial Preferred ETF (ARCA:PGF) menunjukkan posisi terkini di perusahaan oleh institusi dan dana, serta perubahan terbaru dalam ukuran posisi. Pemegang saham utama dapat mencakup investor individu, reksa dana, dana lindung nilai, atau institusi. Jadwal 13D menunjukkan bahwa investor memegang (atau pernah memegang) lebih dari 5% saham perusahaan dan bermaksud (atau pernah bermaksud) untuk secara aktif mengejar perubahan strategi bisnis. Jadwal 13G menunjukkan investasi pasif lebih dari 5%.
The share price as of September 5, 2025 is 14.71 / share. Previously, on September 6, 2024, the share price was 15.42 / share. This represents a decline of 4.60% over that period.
Skor Sentimen Dana
Skor Sentimen Dana (sebelumnya dikenal sebagai Skor Akumulasi Kepemilikan) menemukan saham-saham yang paling banyak dibeli oleh dana. Ini adalah hasil dari model kuantitatif multi-faktor yang canggih yang mengidentifikasi perusahaan dengan tingkat akumulasi institusional tertinggi. Model penilaian menggunakan kombinasi dari total peningkatan pemilik yang diungkapkan, perubahan dalam alokasi portofolio pada pemilik tersebut, dan metrik lainnya. Angka berkisar dari 0 hingga 100, dengan angka yang lebih tinggi menunjukkan tingkat akumulasi yang lebih tinggi dibandingkan dengan perusahaan sejenisnya, dan 50 adalah rata-ratanya.
Frekuensi Pembaruan: Setiap Hari
Lihat Ownership Explorer, yang menyediakan daftar perusahaan dengan peringkat tertinggi.
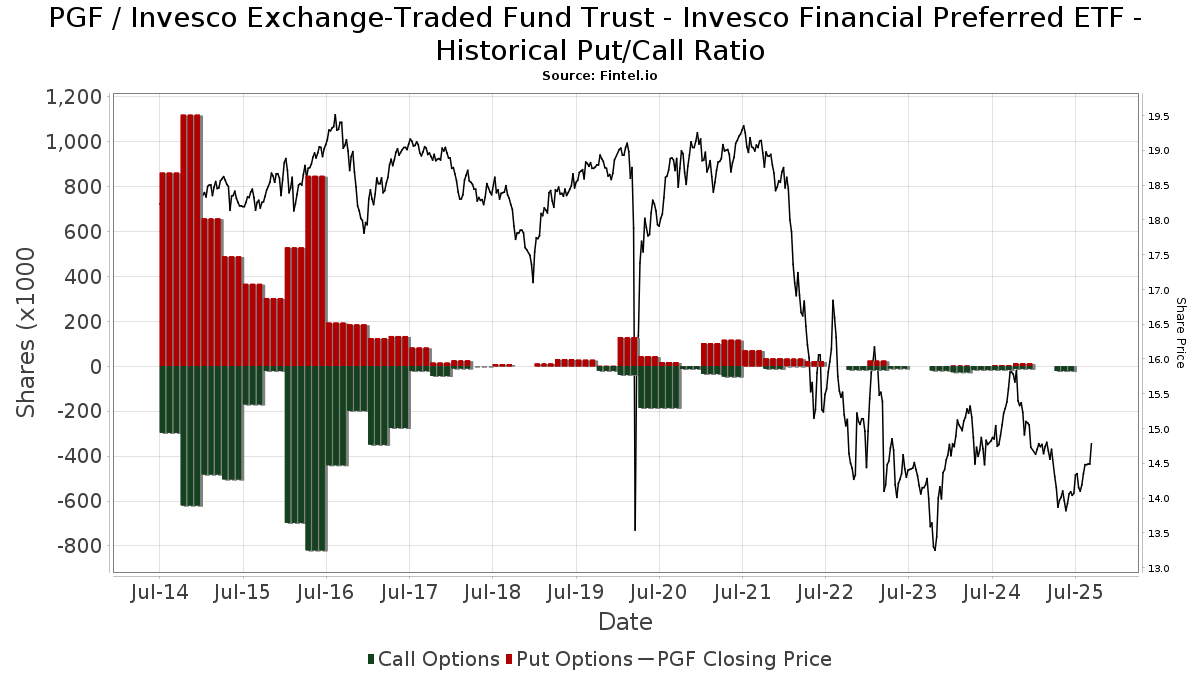
Rasio Put/Call Institusional
Selain melaporkan isu ekuitas dan utang standar, institusi dengan aset di bawah manajemen lebih dari 100 juta dolar AS juga harus mengungkapkan kepemilikan opsi put dan call mereka. Karena opsi put umumnya menunjukkan sentimen negatif, dan opsi call menunjukkan sentimen positif, kita dapat mengetahui sentimen institusional secara keseluruhan dengan memplot rasio put terhadap call. Grafik di sebelah kanan memplot rasio put/call historis untuk instrumen ini.
Menggunakan Rasio Put/Call sebagai indikator sentimen investor mengatasi salah satu kekurangan utama dari penggunaan total kepemilikan institusional, yaitu sejumlah besar aset yang dikelola diinvestasikan secara pasif untuk melacak indeks. Dana yang dikelola secara pasif biasanya tidak membeli opsi, sehingga indikator rasio put/call lebih akurat dalam melacak sentimen dana yang dikelola secara aktif.
Pengajuan 13F dan NPORT
Detail pada pengajuan 13F tersedia gratis. Detail pada pengajuan NP memerlukan keanggotaan premium. Baris berwarna hijau menunjukkan posisi baru. Baris berwarna merah menunjukkan posisi yang sudah ditutup. Klik tautan ini ikon untuk melihat riwayat transaksi selengkapnya.
Tingkatkan
untuk membuka data premium dan mengekspor ke Excel ![]() .
.
| Tanggal File | Sumber | Investor | Ketik | Presyo ng Avg (Silangan) |
Saham | Δ Saham (%) |
Dilaporkan Nilai ($1000) |
Nilai Δ (%) |
Alokasi Port (%) |
|
|---|---|---|---|---|---|---|---|---|---|---|
| 2025-08-14 | 13F | Comerica Bank | 27,096 | -10.41 | 382 | -11.37 | ||||
| 2025-08-14 | 13F | Susquehanna International Group, Llp | 78,246 | 56.62 | 1,104 | 54.84 | ||||
| 2025-08-08 | 13F | Cetera Investment Advisers | 49,445 | -6.76 | 698 | -7.93 | ||||
| 2025-08-15 | 13F | Kestra Advisory Services, LLC | 29,614 | 3.09 | 418 | 1.71 | ||||
| 2025-05-15 | 13F | Citadel Advisors Llc | 0 | -100.00 | 0 | -100.00 | ||||
| 2025-04-25 | 13F | Essex Financial Services, Inc. | 0 | -100.00 | 0 | |||||
| 2025-08-08 | 13F | Emerald Investment Partners, Llc | 145 | -88.92 | 2 | -88.89 | ||||
| 2025-08-12 | 13F | Global Retirement Partners, LLC | 300 | 0.00 | 4 | 0.00 | ||||
| 2025-08-11 | 13F | HighTower Advisors, LLC | 72,147 | 0.21 | 1,018 | -1.07 | ||||
| 2025-08-08 | 13F | Fiera Capital Corp | 17,275 | 0.00 | 244 | -1.22 | ||||
| 2025-07-22 | 13F | Wealthcare Advisory Partners LLC | 29,994 | 0.08 | 423 | -0.94 | ||||
| 2025-08-06 | 13F | Mcrae Capital Management Inc | 16,203 | 0.00 | 229 | -1.30 | ||||
| 2025-07-10 | 13F | Triangle Securities Wealth Management | 10,147 | -5.00 | 143 | -5.92 | ||||
| 2025-07-24 | 13F | IFP Advisors, Inc | 0 | -100.00 | 0 | -100.00 | ||||
| 2025-08-11 | 13F | Delta Asset Management Llc/tn | 124 | 0.00 | 2 | 0.00 | ||||
| 2025-08-12 | 13F | Ameritas Investment Partners, Inc. | 665 | 1.53 | 9 | 0.00 | ||||
| 2025-07-17 | 13F | Alpine Bank Wealth Management | 0 | -100.00 | 0 | |||||
| 2025-08-01 | 13F | Envestnet Asset Management Inc | 52,277 | -15.77 | 738 | -16.82 | ||||
| 2025-08-08 | 13F | Advisors Capital Management, LLC | 12,938 | 1.55 | 183 | 0.55 | ||||
| 2025-08-11 | 13F | Principal Securities, Inc. | 4,260 | -25.24 | 60 | -26.83 | ||||
| 2025-07-21 | 13F | Ameritas Advisory Services, LLC | 5,948 | 84 | ||||||
| 2025-08-13 | 13F | Northwestern Mutual Wealth Management Co | 15,366 | -14.17 | 217 | -15.29 | ||||
| 2025-07-11 | 13F | Farther Finance Advisors, LLC | 11,685 | 1.71 | 165 | 0.00 | ||||
| 2025-04-22 | 13F | Synergy Financial Management, LLC | 0 | -100.00 | 0 | |||||
| 2025-08-14 | 13F | Abbot Financial Management, Inc. | 13,792 | 0.12 | 195 | -1.02 | ||||
| 2025-07-24 | 13F | Blair William & Co/il | 150 | -88.89 | 2 | -89.47 | ||||
| 2025-09-04 | 13F/A | Advisor Group Holdings, Inc. | 88,414 | 12.50 | 1,248 | 11.14 | ||||
| 2025-07-18 | 13F | Rogco, Lp | 3,619 | 147.71 | 51 | 155.00 | ||||
| 2025-08-18 | 13F | Wolverine Trading, Llc | 0 | -100.00 | 0 | |||||
| 2025-08-12 | 13F | Prudential Plc | 3,900 | 0.00 | 55 | 0.00 | ||||
| 2025-05-14 | 13F | Guggenheim Capital Llc | 0 | -100.00 | 0 | |||||
| 2025-08-12 | 13F | Boreal Capital Management LLC | 5,846 | 82 | ||||||
| 2025-08-14 | 13F | Bank Of America Corp /de/ | 676,150 | 10.69 | 9,540 | 9.38 | ||||
| 2025-05-15 | 13F | Citadel Advisors Llc | Put | 0 | -100.00 | 0 | -100.00 | |||
| 2025-08-07 | 13F | McClarren Financial Advisors, Inc. | 0 | -100.00 | 0 | |||||
| 2025-08-14 | 13F | Wealth Preservation Advisors, LLC | 500 | 0.00 | 7 | 0.00 | ||||
| 2025-08-11 | 13F | Aptus Capital Advisors, LLC | 8,194 | 47.53 | 116 | 45.57 | ||||
| 2025-08-06 | 13F | Prospera Financial Services Inc | 101,268 | -0.88 | 1,429 | -2.12 | ||||
| 2025-04-21 | 13F | Nelson, Van Denburg & Campbell Wealth Management Group, LLC | 0 | -100.00 | 0 | |||||
| 2025-07-03 | 13F | City Center Advisors, LLC | 10,052 | 142 | ||||||
| 2025-04-25 | 13F | Westside Investment Management, Inc. | 0 | -100.00 | 0 | |||||
| 2025-07-08 | 13F | Nbc Securities, Inc. | 850 | 16.44 | 0 | |||||
| 2025-08-07 | 13F | Evoke Wealth, Llc | 318,111 | 5.72 | 4,489 | 4.47 | ||||
| 2025-07-21 | 13F | Matauro, Llc | 10,008 | 141 | ||||||
| 2025-08-04 | 13F | Spire Wealth Management | 0 | -100.00 | 0 | |||||
| 2025-08-12 | 13F | CIBC Private Wealth Group, LLC | 1 | 0.00 | 0 | |||||
| 2025-07-29 | 13F | Private Trust Co Na | 11,330 | 0.00 | 160 | -1.24 | ||||
| 2025-07-10 | 13F | Signal Advisors Wealth, LLC | 177,919 | 73.82 | 2,510 | 71.80 | ||||
| 2025-08-13 | 13F/A | StoneX Group Inc. | 0 | -100.00 | 0 | -100.00 | ||||
| 2025-08-14 | 13F | Jane Street Group, Llc | 0 | -100.00 | 0 | |||||
| 2025-07-14 | 13F | Wealth Advisory Solutions, LLC | 127,078 | 1.69 | 1,793 | 0.50 | ||||
| 2025-08-05 | 13F | Garrison Bradford & Associates Inc | 5,000 | 0.00 | 71 | -1.41 | ||||
| 2025-08-08 | 13F | WASHINGTON TRUST Co | 0 | -100.00 | 0 | |||||
| 2025-08-14 | 13F | UBS Group AG | 1,111,940 | 73.32 | 15,689 | 71.26 | ||||
| 2025-08-11 | 13F | Novak & Powell Financial Services, Inc. | 12,974 | -2.44 | 183 | -3.17 | ||||
| 2025-05-09 | 13F | GeoWealth Management, LLC | 0 | -100.00 | 0 | |||||
| 2025-08-12 | 13F | Jpmorgan Chase & Co | 6 | -86.05 | 0 | |||||
| 2025-05-15 | 13F | Bank Of America Corp /de/ | Call | 0 | -100.00 | 0 | -100.00 | |||
| 2025-08-05 | 13F | Dunhill Financial, LLC | 25 | 0.00 | 0 | |||||
| 2025-08-13 | 13F | Brown Advisory Inc | 13,758 | -37.06 | 194 | -37.82 | ||||
| 2025-08-12 | 13F | Running Point Capital Advisors, LLC | 8,506 | 9.67 | 120 | 9.09 | ||||
| 2025-07-29 | 13F | Stephens Inc /ar/ | 10,971 | -10.11 | 155 | -11.49 | ||||
| 2025-08-12 | 13F | Integrated Advisors Network LLC | 81,734 | -50.64 | 1,153 | -51.23 | ||||
| 2025-08-12 | 13F | Proequities, Inc. | 0 | 0 | ||||||
| 2025-07-09 | 13F | Byrne Asset Management LLC | 1,350 | 0.00 | 19 | 0.00 | ||||
| 2025-08-14 | 13F | Mariner, LLC | 0 | -100.00 | 0 | |||||
| 2025-07-31 | 13F | Optimum Investment Advisors | 1,350 | 0.00 | 19 | 0.00 | ||||
| 2025-07-17 | 13F | Independence Bank of Kentucky | 0 | -100.00 | 0 | |||||
| 2025-08-04 | 13F | Field & Main Bank | 106,852 | -0.29 | 1,508 | -1.50 | ||||
| 2025-07-17 | 13F | Sound Income Strategies, LLC | 178 | 0.00 | 3 | 0.00 | ||||
| 2025-08-13 | 13F | Rosenblum Silverman Sutton S F Inc /ca | 57,850 | 13.61 | 816 | 12.24 | ||||
| 2025-07-31 | 13F | Avory & Company, LLC | 30,990 | -24.56 | 437 | -25.43 | ||||
| 2025-08-01 | 13F | Motco | 2,700 | 39 | ||||||
| 2025-04-30 | 13F | M&t Bank Corp | 0 | -100.00 | 0 | |||||
| 2025-08-04 | 13F | Arkadios Wealth Advisors | 10,356 | 146 | ||||||
| 2025-08-13 | 13F | Jones Financial Companies Lllp | 30,904 | 0.67 | 435 | -1.36 | ||||
| 2025-08-06 | 13F | Wedbush Securities Inc | 13,827 | -38.69 | 0 | |||||
| 2025-08-04 | 13F | JDM Financial Group LLC | 1,805 | 1.52 | 25 | 0.00 | ||||
| 2025-07-31 | 13F/A | Avion Wealth | 9,063 | 0 | ||||||
| 2025-07-14 | 13F | Farmers & Merchants Investments Inc | 0 | -100.00 | 0 | |||||
| 2025-08-11 | 13F | Heritage Wealth Advisors | 484 | 0.00 | 7 | 0.00 | ||||
| 2025-08-26 | 13F/A | Thrivent Financial For Lutherans | 16,522 | 0 | ||||||
| 2025-07-11 | 13F | Pinnacle Bancorp, Inc. | 1,000 | 0.00 | 14 | 0.00 | ||||
| 2025-07-30 | 13F | Rehmann Capital Advisory Group | 16,838 | 31.34 | 238 | 29.51 | ||||
| 2025-08-12 | 13F | Maripau Wealth Management Llc | 58,141 | 50.63 | 823 | 49.18 | ||||
| 2025-08-08 | 13F | Capital Investment Advisory Services, LLC | 562 | 1.63 | 8 | 0.00 | ||||
| 2025-08-06 | 13F | AE Wealth Management LLC | 2,350 | -2.97 | 33 | -2.94 | ||||
| 2025-07-28 | 13F | Cushing Capital Partners, LLC | 43,862 | 8.07 | 619 | 6.74 | ||||
| 2025-07-10 | 13F | Wealth Enhancement Advisory Services, Llc | 52,779 | 10.14 | 755 | 10.38 | ||||
| 2025-08-04 | 13F | Assetmark, Inc | 14 | 0 | ||||||
| 2025-07-15 | 13F | North Star Investment Management Corp. | 286,523 | -1.22 | 4,043 | -2.39 | ||||
| 2025-07-18 | 13F | Bartlett & Co. Wealth Management Llc | 950 | 0.00 | 13 | 0.00 | ||||
| 2025-08-12 | 13F | SRS Capital Advisors, Inc. | 5,185 | -7.16 | 73 | -7.59 | ||||
| 2025-07-18 | 13F | Truist Financial Corp | 23,812 | -23.20 | 332 | -25.11 | ||||
| 2025-08-01 | 13F | Vision Financial Markets Llc | 4,000 | 0.00 | 56 | -1.75 | ||||
| 2025-08-13 | 13F | Quadrant Capital Group Llc | 0 | -100.00 | 0 | |||||
| 2025-08-14 | 13F | Oxford Financial Group Ltd | 252 | 1.61 | 4 | 0.00 | ||||
| 2025-08-14 | 13F | Kovitz Investment Group Partners, LLC | 15,350 | 217 | ||||||
| 2025-07-21 | 13F | Credential Securities Inc. | 0 | -100.00 | 0 | |||||
| 2025-08-18 | 13F | Geneos Wealth Management Inc. | 150 | 0.00 | 2 | 0.00 | ||||
| 2025-07-22 | 13F | Accel Wealth Management | 52,637 | -0.60 | 743 | -1.85 | ||||
| 2025-08-12 | 13F | Steward Partners Investment Advisory, Llc | 1,122 | 0.00 | 16 | -6.25 | ||||
| 2025-08-14 | 13F | Qube Research & Technologies Ltd | 439 | 0.00 | 6 | 0.00 | ||||
| 2025-08-14 | 13F | Dearborn Partners Llc | 17,647 | -3.97 | 249 | -5.34 | ||||
| 2025-07-22 | 13F | Financial Insights, Inc. | 10,000 | 0.00 | 141 | -0.70 | ||||
| 2025-08-11 | 13F | Private Advisor Group, LLC | 370,136 | -17.15 | 5,223 | -18.14 | ||||
| 2025-07-23 | 13F | Friedenthal Financial | 5,120 | 1.55 | 72 | 0.00 | ||||
| 2025-07-25 | 13F | Valley Brook Capital Group, Inc. | 12,600 | 0.00 | 178 | -1.12 | ||||
| 2025-07-28 | 13F | Duncker Streett & Co Inc | 272 | 0.00 | 4 | 0.00 | ||||
| 2025-07-24 | 13F | MSH Capital Advisors LLC | 10,566 | -2.72 | 149 | -3.87 | ||||
| 2025-08-11 | 13F | Rothschild Investment Llc | 1,169 | 0.00 | 16 | 0.00 | ||||
| 2025-08-08 | 13F | Capital Investment Counsel, Inc | 0 | -100.00 | 0 | |||||
| 2025-05-15 | 13F | Two Sigma Securities, Llc | 0 | -100.00 | 0 | -100.00 | ||||
| 2025-08-01 | 13F | Brinker Capital Investments, LLC | 0 | -100.00 | 0 | -100.00 | ||||
| 2025-08-18 | 13F/A | National Bank Of Canada /fi/ | 7,873 | 0.00 | 111 | -0.89 | ||||
| 2025-07-22 | 13F | Appleton Partners Inc/ma | 0 | -100.00 | 0 | |||||
| 2025-08-05 | 13F | Lord & Richards Wealth Management, LLC | 83,216 | 127.49 | 1,174 | 124.90 | ||||
| 2025-05-14 | 13F | Orion Portfolio Solutions, LLC | 185,065 | 0.00 | 2,134 | 0.00 | ||||
| 2025-07-21 | 13F | Empirical Financial Services, LLC d.b.a. Empirical Wealth Management | 0 | -100.00 | 0 | |||||
| 2025-07-31 | 13F | Cambridge Investment Research Advisors, Inc. | 83,919 | -6.19 | 1 | 0.00 | ||||
| 2025-07-10 | 13F | HF Advisory Group, LLC | 21,079 | 4.66 | 297 | 3.48 | ||||
| 2025-08-06 | 13F | Nvwm, Llc | 2,431 | 34 | ||||||
| 2025-05-14 | 13F | Van Hulzen Asset Management, LLC | 0 | -100.00 | 0 | -100.00 | ||||
| 2025-07-07 | 13F | Investors Research Corp | 275,264 | 11.99 | 3,884 | 10.66 | ||||
| 2025-08-19 | 13F | Cim, Llc | 29,181 | 0.00 | 412 | -1.20 | ||||
| 2025-07-29 | 13F | International Assets Investment Management, Llc | 77,042 | 9.38 | 1,087 | 8.16 | ||||
| 2025-08-12 | 13F | AlphaCore Capital LLC | 500 | 0.00 | 7 | 0.00 | ||||
| 2025-07-25 | 13F | Cwm, Llc | 276 | -72.97 | 0 | |||||
| 2025-04-03 | 13F | Central Pacific Bank - Trust Division | 0 | -100.00 | 0 | |||||
| 2025-05-12 | 13F | Founders Financial Alliance, LLC | 0 | -100.00 | 0 | |||||
| 2025-07-14 | 13F | Sowell Financial Services LLC | 49,229 | 0.10 | 695 | -1.14 | ||||
| 2025-07-25 | 13F | Concord Wealth Partners | 695 | 1.61 | 10 | 0.00 | ||||
| 2025-07-17 | 13F | Sterneck Capital Management, LLC | 120,520 | -0.18 | 1,701 | -1.39 | ||||
| 2025-08-14 | 13F | MGB Wealth Management, LLC | 27,764 | 0.00 | 392 | -1.26 | ||||
| 2025-07-22 | 13F | Kessler Investment Group, LLC | 1,508 | 0.00 | 21 | 0.00 | ||||
| 2025-08-14 | 13F | Wells Fargo & Company/mn | 820,396 | -0.28 | 11,576 | -1.47 | ||||
| 2025-08-04 | 13F | Integrity Alliance, Llc. | 14,638 | 4.33 | 207 | 3.00 | ||||
| 2025-08-06 | 13F | Commonwealth Equity Services, Llc | 92,725 | 1.35 | 1 | 0.00 | ||||
| 2025-08-14 | 13F | GWM Advisors LLC | 26,979 | 26.04 | 381 | 24.59 | ||||
| 2025-07-18 | 13F | Institute for Wealth Management, LLC. | 18,847 | -1.84 | 266 | -3.28 | ||||
| 2025-08-19 | 13F | Anchor Investment Management, LLC | 4,000 | 0.00 | 56 | -1.75 | ||||
| 2025-08-25 | 13F/A | Promus Capital, LLC | 2,117 | 0.00 | 30 | -3.33 | ||||
| 2025-08-04 | 13F | Premier Path Wealth Partners, LLC | 10,245 | 0.00 | 145 | -1.37 | ||||
| 2025-07-30 | 13F | Bogart Wealth, LLC | 1,060 | 0.00 | 15 | -6.67 | ||||
| 2025-07-31 | 13F | Richards, Merrill & Peterson, Inc. | 1,942 | 0.00 | 27 | 0.00 | ||||
| 2025-08-14 | 13F | Guardian Wealth Advisors, Llc / Nc | 2,881 | 9.92 | 41 | 8.11 | ||||
| 2025-08-14 | 13F | Ameriprise Financial Inc | 67,225 | 27.54 | 949 | 26.06 | ||||
| 2025-07-24 | 13F | Costello Asset Management, INC | 252 | 1.61 | 4 | 0.00 | ||||
| 2025-08-05 | 13F | Bank Of Montreal /can/ | 22,259 | -9.51 | 314 | -10.54 | ||||
| 2025-08-15 | 13F | Morgan Stanley | 1,707,295 | -7.94 | 24,090 | -9.04 | ||||
| 2025-07-16 | 13F | Leading Edge Financial Planning LLC | 14,572 | -13.24 | 206 | -14.23 | ||||
| 2025-07-07 | 13F | Thurston, Springer, Miller, Herd & Titak, Inc. | 325 | 0.00 | 5 | 0.00 | ||||
| 2025-07-29 | 13F | Ballast, Inc. | 20,276 | 286 | ||||||
| 2025-07-30 | 13F | D.a. Davidson & Co. | 76,101 | -1.97 | 1,074 | -3.16 | ||||
| 2025-05-15 | 13F | Creative Planning | 0 | -100.00 | 0 | |||||
| 2025-08-14 | 13F | Citadel Advisors Llc | Call | 21,100 | 298 | |||||
| 2025-05-12 | 13F | Independent Advisor Alliance | 0 | -100.00 | 0 | |||||
| 2025-08-07 | 13F | Palouse Capital Management, Inc. | 2,588 | 0.00 | 37 | 0.00 | ||||
| 2025-08-07 | 13F | Allworth Financial LP | 275 | 0.00 | 4 | 0.00 | ||||
| 2025-07-16 | 13F | Signaturefd, Llc | 0 | -100.00 | 0 | |||||
| 2025-07-31 | 13F | Oppenheimer & Co Inc | 22,860 | 0.43 | 323 | -0.92 | ||||
| 2025-08-04 | 13F | Joseph P. Lucia & Associates, LLC | 20,276 | 1.08 | 286 | 0.00 | ||||
| 2025-07-14 | 13F | GAMMA Investing LLC | 2,180 | 0.00 | 31 | -3.23 | ||||
| 2025-08-08 | 13F | ProVise Management Group, LLC | 25,042 | 0.00 | 353 | -1.12 | ||||
| 2025-08-14 | 13F | Royal Bank Of Canada | 159,796 | 13.67 | 2,254 | 12.20 | ||||
| 2025-08-15 | 13F | Captrust Financial Advisors | 54,914 | -0.60 | 775 | -1.78 | ||||
| 2025-08-13 | 13F | Alerus Financial Na | 1,000 | 14 | ||||||
| 2025-08-13 | 13F | Fort Sheridan Advisors Llc | 11,800 | -17.48 | 166 | -18.63 | ||||
| 2025-08-14 | 13F | Fmr Llc | 160 | 56.86 | 2 | 100.00 | ||||
| 2025-08-15 | 13F | Tower Research Capital LLC (TRC) | 65 | 1 | ||||||
| 2025-08-07 | 13F | Kestra Private Wealth Services, Llc | 15,585 | 0.00 | 220 | -1.35 | ||||
| 2025-05-15 | 13F | CAPROCK Group, Inc. | 26,218 | 0.00 | 374 | -1.84 | ||||
| 2025-08-12 | 13F | LPL Financial LLC | 975,225 | -21.47 | 13,760 | -22.40 | ||||
| 2025-07-30 | 13F | Eqis Capital Management, Inc. | 65,640 | -1.85 | 926 | -2.94 | ||||
| 2025-08-05 | 13F | Simplex Trading, Llc | 633 | 90.09 | 0 | |||||
| 2025-07-10 | 13F | Rfg Holdings, Inc. | 61,231 | -33.59 | 864 | -34.42 | ||||
| 2025-07-14 | 13F | Pacifica Partners Inc. | 447 | 0.00 | 6 | 0.00 | ||||
| 2025-08-08 | 13F | Citizens Financial Group Inc/ri | 17,950 | -14.94 | 253 | -15.95 | ||||
| 2025-07-17 | 13F | Park Place Capital Corp | 1,120 | 0.00 | 16 | 0.00 | ||||
| 2025-07-28 | 13F | Harbour Investments, Inc. | 2,415 | 0.00 | 34 | 0.00 | ||||
| 2025-05-23 | 13F | Twin Lakes Capital Management, LLC | 0 | -100.00 | 0 | |||||
| 2025-08-12 | 13F | MAI Capital Management | 21,962 | -4.71 | 310 | -6.08 | ||||
| 2025-08-14 | 13F | Ancora Advisors, LLC | 20,000 | 100.00 | 282 | 98.59 | ||||
| 2025-07-16 | 13F | Register Financial Advisors LLC | 2,104 | 1.54 | 30 | 0.00 | ||||
| 2025-07-17 | 13F | Walker Asset Management, LLC | 40,170 | -2.64 | 567 | -3.90 | ||||
| 2025-07-24 | 13F | Us Bancorp \de\ | 2,250 | 0.00 | 32 | -3.12 | ||||
| 2025-07-28 | 13F | Essex LLC | 20,200 | 0.00 | 285 | -1.04 | ||||
| 2025-08-08 | 13F | Symphony Financial Services, Inc. | 11,896 | -17.43 | 168 | -18.54 | ||||
| 2025-05-06 | 13F | Avantax Advisory Services, Inc. | 0 | -100.00 | 0 | |||||
| 2025-07-31 | 13F | LJI Wealth Management, LLC | 40,371 | -5.50 | 570 | -6.72 | ||||
| 2025-08-19 | 13F | National Asset Management, Inc. | 22,350 | 315 | ||||||
| 2025-07-17 | 13F/A | Capital Investment Advisors, LLC | 28,894 | -4.24 | 408 | -5.35 | ||||
| 2025-07-10 | 13F | Rockland Trust Co | 0 | -100.00 | 0 | |||||
| 2025-07-17 | 13F | Janney Montgomery Scott LLC | 28,333 | -0.74 | 0 | |||||
| 2025-07-17 | 13F | Western Financial Corp/CA | 21,960 | -0.00 | 310 | -1.28 | ||||
| 2025-08-05 | 13F | Huntington National Bank | 1 | 0.00 | 0 | |||||
| 2025-04-17 | 13F | Monticello Wealth Management, Llc | 0 | -100.00 | 0 | |||||
| 2025-08-14 | 13F | Mml Investors Services, Llc | 61,724 | -18.82 | 1 | -100.00 | ||||
| 2025-08-14 | 13F | Stifel Financial Corp | 148,560 | 0.07 | 2,096 | -1.09 | ||||
| 2025-07-09 | 13F | Fiduciary Alliance LLC | 13,267 | -37.32 | 187 | -38.08 | ||||
| 2025-07-16 | 13F | Magnus Financial Group LLC | 82,509 | 1.55 | 1,164 | 0.34 | ||||
| 2025-08-11 | 13F | SFI Advisors, LLC | 0 | -100.00 | 0 | |||||
| 2025-08-14 | 13F | Raymond James Financial Inc | 123,594 | -20.35 | 1,744 | -21.31 | ||||
| 2025-05-08 | 13F | We Are One Seven, LLC | 0 | -100.00 | 0 |