Mga Batayang Estadistika
| Pemilik Institusional | 151 total, 150 long only, 0 short only, 1 long/short - change of -0.66% MRQ |
| Alokasi Portofolio Rata-rata | 0.1946 % - change of -10.86% MRQ |
| Saham Institusional (Jangka Panjang) | 11,944,231 (ex 13D/G) - change of -0.06MM shares -0.48% MRQ |
| Nilai Institusional (Jangka Panjang) | $ 327,556 USD ($1000) |
Kepemilikan Institusional dan Pemegang Saham
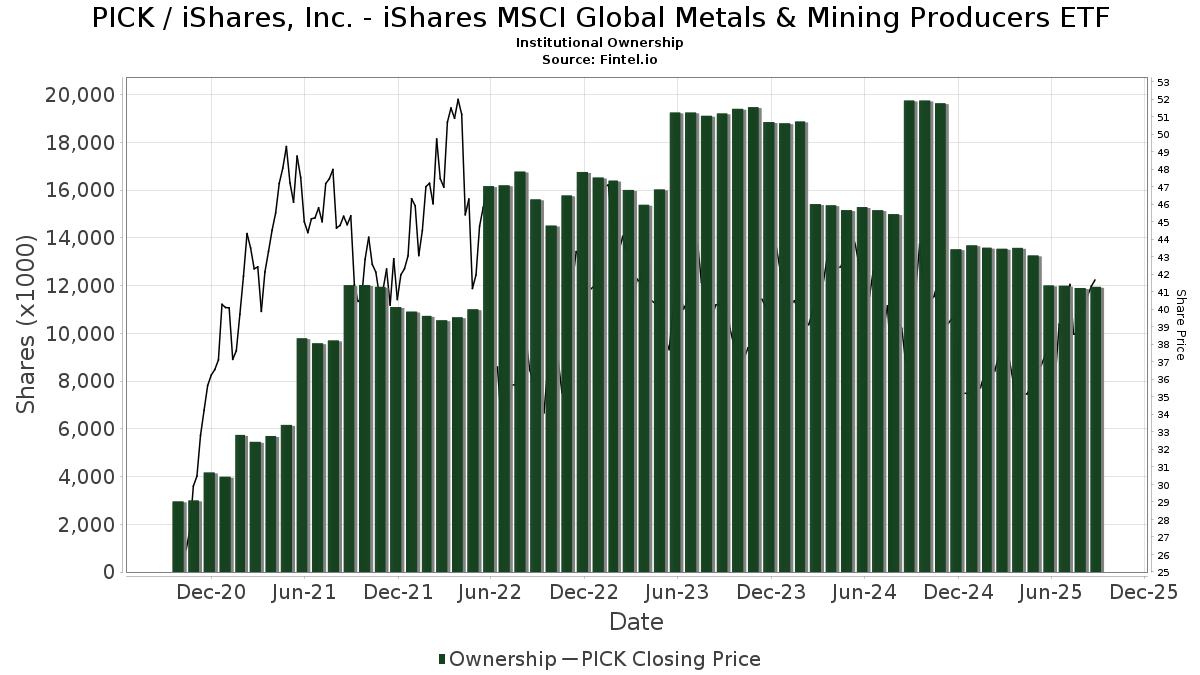
iShares, Inc. - iShares MSCI Global Metals & Mining Producers ETF (US:PICK) memiliki 151 pemilik institusional dan pemegang saham yang telah mengajukan formulir 13D/G atau 13F kepada Komisi Bursa Efek (Securities Exchange Commission/SEC). Lembaga-lembaga ini memegang total 11,944,231 saham. Pemegang saham terbesar meliputi Fisher Asset Management, LLC, Municipal Employees' Retirement System of Michigan, Greenline Partners, LLC, Bank Of America Corp /de/, Raymond James Financial Inc, Morgan Stanley, RAA - SMI 3Fourteen Real Asset Allocation ETF SMI 3Fourteen REAL Asset Allocation ETF, Jane Street Group, Llc, Goldman Sachs Group Inc, and AMTAX - AB All Market Real Return Portfolio Class A .
Struktur kepemilikan institusional iShares, Inc. - iShares MSCI Global Metals & Mining Producers ETF (BATS:PICK) menunjukkan posisi terkini di perusahaan oleh institusi dan dana, serta perubahan terbaru dalam ukuran posisi. Pemegang saham utama dapat mencakup investor individu, reksa dana, dana lindung nilai, atau institusi. Jadwal 13D menunjukkan bahwa investor memegang (atau pernah memegang) lebih dari 5% saham perusahaan dan bermaksud (atau pernah bermaksud) untuk secara aktif mengejar perubahan strategi bisnis. Jadwal 13G menunjukkan investasi pasif lebih dari 5%.
The share price as of September 5, 2025 is 41.81 / share. Previously, on September 6, 2024, the share price was 36.37 / share. This represents an increase of 14.96% over that period.
Skor Sentimen Dana
Skor Sentimen Dana (sebelumnya dikenal sebagai Skor Akumulasi Kepemilikan) menemukan saham-saham yang paling banyak dibeli oleh dana. Ini adalah hasil dari model kuantitatif multi-faktor yang canggih yang mengidentifikasi perusahaan dengan tingkat akumulasi institusional tertinggi. Model penilaian menggunakan kombinasi dari total peningkatan pemilik yang diungkapkan, perubahan dalam alokasi portofolio pada pemilik tersebut, dan metrik lainnya. Angka berkisar dari 0 hingga 100, dengan angka yang lebih tinggi menunjukkan tingkat akumulasi yang lebih tinggi dibandingkan dengan perusahaan sejenisnya, dan 50 adalah rata-ratanya.
Frekuensi Pembaruan: Setiap Hari
Lihat Ownership Explorer, yang menyediakan daftar perusahaan dengan peringkat tertinggi.
Rasio Put/Call Institusional
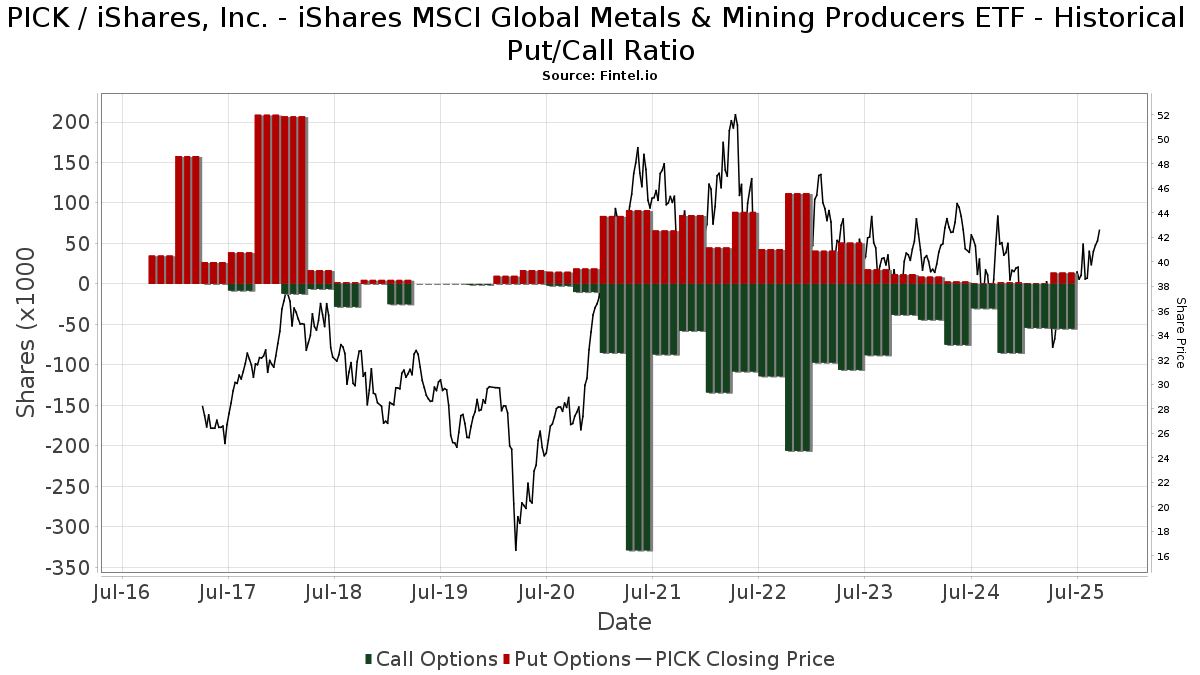
Selain melaporkan isu ekuitas dan utang standar, institusi dengan aset di bawah manajemen lebih dari 100 juta dolar AS juga harus mengungkapkan kepemilikan opsi put dan call mereka. Karena opsi put umumnya menunjukkan sentimen negatif, dan opsi call menunjukkan sentimen positif, kita dapat mengetahui sentimen institusional secara keseluruhan dengan memplot rasio put terhadap call. Grafik di sebelah kanan memplot rasio put/call historis untuk instrumen ini.
Menggunakan Rasio Put/Call sebagai indikator sentimen investor mengatasi salah satu kekurangan utama dari penggunaan total kepemilikan institusional, yaitu sejumlah besar aset yang dikelola diinvestasikan secara pasif untuk melacak indeks. Dana yang dikelola secara pasif biasanya tidak membeli opsi, sehingga indikator rasio put/call lebih akurat dalam melacak sentimen dana yang dikelola secara aktif.
Pengajuan 13F dan NPORT
Detail pada pengajuan 13F tersedia gratis. Detail pada pengajuan NP memerlukan keanggotaan premium. Baris berwarna hijau menunjukkan posisi baru. Baris berwarna merah menunjukkan posisi yang sudah ditutup. Klik tautan ini ikon untuk melihat riwayat transaksi selengkapnya.
Tingkatkan
untuk membuka data premium dan mengekspor ke Excel ![]() .
.
| Tanggal File | Sumber | Investor | Ketik | Presyo ng Avg (Silangan) |
Saham | Δ Saham (%) |
Dilaporkan Nilai ($1000) |
Nilai Δ (%) |
Alokasi Port (%) |
|
|---|---|---|---|---|---|---|---|---|---|---|
| 2025-08-14 | 13F | Principia Wealth Advisory, LLC | 3,280 | 123 | ||||||
| 2025-08-08 | 13F | Emerald Investment Partners, Llc | 129 | 5 | ||||||
| 2025-08-06 | 13F | Rialto Wealth Management, LLC | 669 | 0.00 | 25 | 4.17 | ||||
| 2025-08-12 | 13F | MAI Capital Management | 313 | 0.00 | 12 | 0.00 | ||||
| 2025-08-13 | 13F | Tls Advisors Llc | 100,994 | -49.38 | 4 | -57.14 | ||||
| 2025-07-21 | 13F | Synergy Financial Management, LLC | 5,549 | 209 | ||||||
| 2025-08-14 | 13F | CoreCap Advisors, LLC | 55,455 | -34.53 | 2,085 | -31.39 | ||||
| 2025-07-14 | 13F | U.S. Capital Wealth Advisors, LLC | 27,936 | -12.59 | 1,050 | -8.38 | ||||
| 2025-08-14 | 13F | Financial Advisory Service, Inc. | 1,649 | 1.41 | 62 | 5.17 | ||||
| 2025-08-13 | 13F | Northwestern Mutual Wealth Management Co | 2,560 | -73.85 | 96 | -72.65 | ||||
| 2025-07-15 | 13F | Fifth Third Bancorp | 250 | 0.00 | 9 | 12.50 | ||||
| 2025-07-14 | 13F | Opal Wealth Advisors, LLC | 841 | 32 | ||||||
| 2025-07-28 | 13F | Axxcess Wealth Management, Llc | 5,328 | 200 | ||||||
| 2025-08-11 | 13F | Strategic Wealth Partners, Ltd. | 360 | 14 | ||||||
| 2025-08-14 | 13F | Fmr Llc | 623 | -46.57 | 23 | -43.90 | ||||
| 2025-05-14 | 13F | Lionshead Wealth Management, LLC | 0 | -100.00 | 0 | |||||
| 2025-04-28 | 13F | Pinnacle Financial Partners Inc | 2,571 | 0.00 | 90 | -19.82 | ||||
| 2025-07-18 | 13F | Union Bancaire Privee, UBP SA | 5,347 | 0.00 | 202 | 4.12 | ||||
| 2025-07-24 | 13F | Ronald Blue Trust, Inc. | 195 | 0.00 | 7 | 16.67 | ||||
| 2025-07-08 | 13F | Parallel Advisors, LLC | 351 | 0.00 | 13 | 8.33 | ||||
| 2025-08-14 | 13F | State Street Corp | 5,600 | -37.78 | 211 | -34.78 | ||||
| 2025-08-13 | 13F | Fort Sheridan Advisors Llc | 9,408 | -2.43 | 354 | 2.32 | ||||
| 2025-08-14 | 13F | Synovus Financial Corp | 65,658 | 0.00 | 2,469 | 4.80 | ||||
| 2025-07-31 | 13F | Wealthfront Advisers Llc | 43,404 | 5.68 | 1,632 | 10.73 | ||||
| 2025-08-08 | 13F | Pnc Financial Services Group, Inc. | 3,006 | 0.00 | 113 | 5.61 | ||||
| 2025-08-14 | 13F | Toroso Investments, LLC | 116,268 | -41.41 | 4,372 | -38.61 | ||||
| 2025-08-14 | 13F | Stamos Capital Partners, L.p. | 41,223 | 50.42 | 1,550 | 57.58 | ||||
| 2025-07-08 | 13F | Webster Bank, N. A. | 318 | 0.00 | 12 | 0.00 | ||||
| 2025-08-12 | 13F | LPL Financial LLC | 92,203 | -0.08 | 3,467 | 4.71 | ||||
| 2025-08-13 | 13F | Quadrature Capital Ltd | 0 | -100.00 | 0 | |||||
| 2025-08-14 | 13F | GWM Advisors LLC | 433 | 0.93 | 16 | 6.67 | ||||
| 2025-08-08 | 13F | Hartland & Co., LLC | 0 | -100.00 | 0 | |||||
| 2025-08-11 | 13F | HighTower Advisors, LLC | 31,940 | 29.43 | 1,201 | 35.59 | ||||
| 2025-08-11 | 13F | Aptus Capital Advisors, LLC | 357 | 37.31 | 13 | 44.44 | ||||
| 2025-08-12 | 13F | TCTC Holdings, LLC | 2,825 | 0.00 | 106 | 4.95 | ||||
| 2025-07-23 | 13F | Meitav Dash Investments Ltd | 7,692 | 0.00 | 289 | 5.09 | ||||
| 2025-08-12 | 13F | Choate Investment Advisors | 2,378 | 89 | ||||||
| 2025-08-11 | 13F | Rothschild Investment Llc | 0 | -100.00 | 0 | |||||
| 2025-07-03 | 13F | JBGlobal.com LLC | 0 | -100.00 | 0 | |||||
| 2025-07-25 | 13F | Retirement Planning Group, Llc / Ny | 15,690 | -8.09 | 590 | -3.76 | ||||
| 2025-08-14 | 13F | Hrt Financial Lp | 6,763 | 0 | ||||||
| 2025-05-05 | 13F | Lindbrook Capital, Llc | 0 | -100.00 | 0 | |||||
| 2025-05-16 | 13F/A | Kestra Investment Management, LLC | 0 | -100.00 | 0 | |||||
| 2025-07-22 | 13F | Valley National Advisers Inc | 155 | -52.74 | 0 | |||||
| 2025-04-22 | 13F | Verde Servicos Internacionais S.A. | 0 | -100.00 | 0 | |||||
| 2025-08-12 | 13F | Founders Financial Alliance, LLC | 50 | -16.67 | 2 | -50.00 | ||||
| 2025-07-25 | 13F | Northwest Capital Management Inc | 459 | 0.00 | 17 | 6.25 | ||||
| 2025-08-12 | 13F | O'shaughnessy Asset Management, Llc | 1 | -96.97 | 0 | -100.00 | ||||
| 2025-08-14 | 13F | D. E. Shaw & Co., Inc. | 9,766 | -29.53 | 367 | -26.16 | ||||
| 2025-07-14 | 13F | Abound Wealth Management | 1,152 | 1.95 | 43 | 7.50 | ||||
| 2025-08-14 | 13F | Raymond James Financial Inc | 283,792 | 2.54 | 10,671 | 7.45 | ||||
| 2025-08-12 | 13F | Steward Partners Investment Advisory, Llc | 5,943 | 0.85 | 223 | 5.69 | ||||
| 2025-07-25 | 13F | Stonehage Fleming Financial Services Holdings Ltd | 0 | -100.00 | 0 | |||||
| 2025-08-11 | 13F | Nomura Asset Management Co Ltd | 15,523 | 0.00 | 584 | 4.86 | ||||
| 2025-08-13 | 13F | Baird Financial Group, Inc. | 12,738 | -47.62 | 479 | -45.18 | ||||
| 2025-03-24 | 13F/A | Wellington Management Group Llp | 0 | -100.00 | 0 | |||||
| 2025-08-12 | 13F | Pathstone Holdings, LLC | 12,295 | 0.00 | 462 | 4.76 | ||||
| 2025-07-14 | 13F | Clear Harbor Asset Management, LLC | 51,348 | 0.65 | 1,931 | 5.46 | ||||
| 2025-07-17 | 13F | Elwood & Goetz Wealth Advisory Group, LLC | 17,496 | 13.89 | 658 | 19.24 | ||||
| 2025-08-14 | 13F | Ameriprise Financial Inc | 87,253 | 3.86 | 3,281 | 8.83 | ||||
| 2025-07-21 | 13F | Ameritas Advisory Services, LLC | 371 | 14 | ||||||
| 2025-08-04 | 13F | Mesirow Financial Investment Management, Inc. | 40,538 | -51.46 | 1,524 | -49.13 | ||||
| 2025-08-07 | 13F | Resolute Advisors LLC | 7,836 | 12.15 | 295 | 17.60 | ||||
| 2025-07-24 | 13F | Us Bancorp \de\ | 11,109 | 7,835.00 | 418 | 8,240.00 | ||||
| 2025-08-14 | 13F | Bnp Paribas Arbitrage, Sa | 17,979 | -28.34 | 676 | -24.89 | ||||
| 2025-07-31 | 13F | Cambridge Investment Research Advisors, Inc. | 14,112 | -69.09 | 1 | -100.00 | ||||
| 2025-05-12 | 13F | Hirtle Callaghan & Co LLC | 0 | -100.00 | 0 | |||||
| 2025-08-08 | 13F | IMA Wealth, Inc. | 13 | 0.00 | 0 | |||||
| 2025-08-08 | 13F | Cetera Investment Advisers | 14,990 | -34.41 | 564 | -31.26 | ||||
| 2025-08-14 | 13F | Susquehanna International Group, Llp | 86,428 | 3,250 | ||||||
| 2025-08-08 | 13F | Gts Securities Llc | 146,052 | 5,492 | ||||||
| 2025-07-29 | 13F | Angeles Wealth Management, Llc | 0 | -100.00 | 0 | |||||
| 2025-08-14 | 13F | Susquehanna International Group, Llp | Call | 6,400 | -49.21 | 241 | -46.90 | |||
| 2025-05-15 | 13F | Two Sigma Securities, Llc | 0 | -100.00 | 0 | |||||
| 2025-08-07 | 13F | Nwam Llc | 0 | -100.00 | 0 | |||||
| 2025-08-14 | 13F | Federation des caisses Desjardins du Quebec | 503 | -34.08 | 19 | -33.33 | ||||
| 2025-07-15 | 13F | Colonial River Wealth Management, LLC | 5,328 | 210 | ||||||
| 2025-08-12 | 13F | Jpmorgan Chase & Co | 6,535 | -3.36 | 246 | 1.24 | ||||
| 2025-08-15 | 13F | CI Private Wealth, LLC | 44,315 | -49.69 | 1,666 | -47.28 | ||||
| 2025-09-04 | 13F/A | Advisor Group Holdings, Inc. | 22,345 | -4.21 | 841 | 0.36 | ||||
| 2025-07-28 | 13F | Harbour Investments, Inc. | 223 | -23.10 | 8 | -20.00 | ||||
| 2025-08-12 | 13F | CIBC Private Wealth Group, LLC | 1,700 | -59.85 | 64 | -50.78 | ||||
| 2025-08-13 | 13F | Northern Trust Corp | 17,285 | 0.00 | 650 | 4.68 | ||||
| 2025-07-18 | 13F | PFG Investments, LLC | 7,034 | 1.34 | 264 | 6.02 | ||||
| 2025-07-31 | 13F | City State Bank | 800 | 0.00 | 30 | 7.14 | ||||
| 2025-08-14 | 13F | Stifel Financial Corp | 25,620 | -16.56 | 963 | -12.53 | ||||
| 2025-08-14 | 13F | Comerica Bank | 1,655 | -28.20 | 62 | -24.39 | ||||
| 2025-08-11 | 13F | Heritage Wealth Advisors | 11,700 | 0.00 | 440 | 4.77 | ||||
| 2025-08-04 | 13F | Savvy Advisors, Inc. | 32,105 | -2.45 | 1,207 | 2.29 | ||||
| 2025-05-08 | 13F | Strategic Advocates LLC | 0 | -100.00 | 0 | |||||
| 2025-08-14 | 13F | Old Mission Capital Llc | 31,093 | -22.64 | 1,169 | -18.93 | ||||
| 2025-07-28 | 13F | BRYN MAWR TRUST Co | 0 | -100.00 | 0 | |||||
| 2025-08-13 | 13F | Continuum Advisory, LLC | 0 | -100.00 | 0 | |||||
| 2025-07-17 | 13F | BFI Infinity Ltd. | 10,342 | 0.00 | 389 | 4.58 | ||||
| 2025-08-14 | 13F | Bank Of America Corp /de/ | 544,102 | 83.58 | 20,458 | 92.38 | ||||
| 2025-05-12 | 13F | Townsquare Capital Llc | 0 | -100.00 | 0 | |||||
| 2025-08-12 | 13F | Insigneo Advisory Services, Llc | 6,840 | 0.59 | 257 | 5.76 | ||||
| 2025-08-13 | 13F | ASB Consultores, LLC | 0 | -100.00 | 0 | |||||
| 2025-08-13 | 13F | Fisher Asset Management, LLC | 3,332,961 | -4.75 | 125,319 | -0.19 | ||||
| 2025-07-25 | 13F | Cwm, Llc | 1,310 | 7.73 | 0 | |||||
| 2025-08-14 | 13F | Citadel Advisors Llc | Call | 41,100 | 183.45 | 1,545 | 197.12 | |||
| 2025-08-14 | 13F | Citadel Advisors Llc | 102,815 | 534.00 | 3,866 | 565.23 | ||||
| 2025-08-14 | 13F | Citadel Advisors Llc | Put | 14,700 | 673.68 | 553 | 711.76 | |||
| 2025-08-01 | 13F | Envestnet Asset Management Inc | 36,684 | 5.28 | 1,379 | 10.32 | ||||
| 2025-08-13 | 13F | Scotia Capital Inc. | 26,921 | -38.87 | 1,012 | -35.95 | ||||
| 2025-07-16 | 13F | ORG Wealth Partners, LLC | 49 | 0.00 | 2 | 0.00 | ||||
| 2025-05-14 | 13F | Barometer Capital Management Inc. | 0 | -100.00 | 0 | |||||
| 2025-07-08 | 13F | Arlington Trust Co LLC | 1,500 | 0.00 | 56 | 5.66 | ||||
| 2025-08-06 | 13F | Black Swift Group, LLC | 8,800 | 0.00 | 331 | 4.76 | ||||
| 2025-05-07 | 13F | Phoenix Holdings Ltd. | 0 | -100.00 | 0 | -100.00 | ||||
| 2025-07-29 | 13F | Stratos Wealth Advisors, LLC | 58,627 | -61.85 | 2,204 | -60.02 | ||||
| 2025-07-25 | 13F | Almanack Investment Partners, LLC. | 144,807 | 8.54 | 5,445 | 13.72 | ||||
| 2025-05-12 | 13F | Simplex Trading, Llc | 0 | -100.00 | 0 | |||||
| 2025-08-29 | NP | GDMA - Gadsden Dynamic Multi-Asset ETF | 98,312 | -21.10 | 3,697 | -17.32 | ||||
| 2025-04-28 | 13F | Clarity Capital Partners LLC | 0 | -100.00 | 0 | |||||
| 2025-08-14 | 13F | Wealth Preservation Advisors, LLC | 53 | 0.00 | 2 | 0.00 | ||||
| 2025-07-31 | 13F | Allied Investment Advisors, LLC | 67,916 | 109.44 | 2,554 | 119.52 | ||||
| 2025-08-08 | 13F | Avantax Advisory Services, Inc. | 19,270 | 47.23 | 725 | 54.37 | ||||
| 2025-05-07 | 13F | Second Half Financial Partners, LLC | 0 | -100.00 | 0 | |||||
| 2025-08-14 | 13F | UBS Group AG | 84,144 | 6.22 | 3,164 | 11.29 | ||||
| 2025-07-17 | 13F | Barry Investment Advisors, LLC | 96,317 | -2.36 | 3,622 | 2.32 | ||||
| 2025-08-01 | 13F | Motco | 200 | 8 | ||||||
| 2025-08-11 | 13F | Empowered Funds, LLC | 98,579 | -20.88 | 3,707 | -17.09 | ||||
| 2025-08-11 | 13F | Principal Securities, Inc. | 803 | -8.12 | 30 | 0.00 | ||||
| 2025-07-25 | 13F | Endowment Wealth Management, Inc. | 11,408 | -0.91 | 429 | 3.63 | ||||
| 2025-07-28 | 13F | Kiker Wealth Management, LLC | 851 | 32 | ||||||
| 2025-08-11 | 13F | Citigroup Inc | 1 | 0.00 | 0 | |||||
| 2025-08-14 | 13F | Daiwa Securities Group Inc. | 20,100 | 0.00 | 1 | |||||
| 2025-08-04 | 13F | Municipal Employees' Retirement System of Michigan | 3,032,992 | 0.00 | 114 | 5.56 | ||||
| 2025-08-13 | 13F | Schroder Investment Management Group | 0 | -100.00 | 0 | |||||
| 2025-07-11 | 13F | Farther Finance Advisors, LLC | 98 | 0.00 | 4 | 0.00 | ||||
| 2025-08-12 | 13F | Trans-Canada Capital Inc. | 90,250 | 0.00 | 3,393 | 4.79 | ||||
| 2025-07-24 | 13F | IFP Advisors, Inc | 600 | 0.00 | 23 | 4.76 | ||||
| 2025-07-07 | 13F | Thurston, Springer, Miller, Herd & Titak, Inc. | 210 | 0.00 | 8 | 0.00 | ||||
| 2025-08-06 | 13F | AE Wealth Management LLC | 1,957 | 6.30 | 74 | 10.61 | ||||
| 2025-08-08 | 13F | Family Firm, Inc. | 37,064 | 7.62 | 1,394 | 12.79 | ||||
| 2025-08-12 | 13F | Howe & Rusling Inc | 106 | 0.00 | 4 | 0.00 | ||||
| 2025-07-18 | 13F | Parsons Capital Management Inc/ri | 7,840 | 0.00 | 295 | 4.63 | ||||
| 2025-07-14 | 13F | Sowell Financial Services LLC | 10,811 | 0.68 | 406 | 5.45 | ||||
| 2025-07-17 | 13F | Smith Anglin Financial, LLC | 0 | -100.00 | 0 | |||||
| 2025-08-14 | 13F | CIBC World Markets Inc. | 33,827 | 248.80 | 1,272 | 266.28 | ||||
| 2025-08-06 | 13F | Commonwealth Equity Services, Llc | 21,851 | -21.84 | 1 | -100.00 | ||||
| 2025-08-14 | 13F | Goldman Sachs Group Inc | 218,703 | -19.78 | 8,223 | -15.94 | ||||
| 2025-08-15 | 13F | Tower Research Capital LLC (TRC) | 149 | 413.79 | 6 | 400.00 | ||||
| 2025-03-27 | NP | AMTAX - AB All Market Real Return Portfolio Class A | 168,830 | 0.00 | 5,988 | -11.63 | ||||
| 2025-05-07 | 13F | Evermay Wealth Management Llc | 0 | -100.00 | 0 | -100.00 | ||||
| 2025-07-10 | 13F | Wealth Enhancement Advisory Services, Llc | 7,428 | -22.59 | 291 | -15.70 | ||||
| 2025-08-14 | 13F | Jane Street Group, Llc | Call | 0 | -100.00 | 0 | ||||
| 2025-07-31 | 13F | Oppenheimer & Co Inc | 17,393 | 654 | ||||||
| 2025-08-11 | 13F | Bedell Frazier Investment Counseling, LLC | 76,157 | 2,864 | ||||||
| 2025-08-18 | 13F/A | National Bank Of Canada /fi/ | 950 | -3.26 | 36 | 0.00 | ||||
| 2025-08-06 | 13F | Prospera Financial Services Inc | 0 | -100.00 | 0 | |||||
| 2025-04-30 | 13F | Banque Pictet & Cie Sa | 0 | -100.00 | 0 | |||||
| 2025-07-08 | 13F | Nbc Securities, Inc. | 0 | -100.00 | 0 | |||||
| 2025-07-23 | 13F | Vontobel Holding Ltd. | 30,750 | 0.00 | 1,156 | 4.81 | ||||
| 2025-08-11 | 13F | CBIZ Investment Advisory Services, LLC | 246 | 1.65 | 9 | 12.50 | ||||
| 2025-08-13 | 13F | Greenwich Wealth Management LLC | 17,219 | -0.43 | 1 | |||||
| 2025-04-10 | 13F | SMI Advisory Services, LLC | 0 | -100.00 | 0 | |||||
| 2025-07-17 | 13F | Vermillion Wealth Management, Inc. | 15,770 | 13.10 | 593 | 18.40 | ||||
| 2025-07-09 | 13F | Breakwater Capital Group | 0 | -100.00 | 0 | |||||
| 2025-08-14 | 13F | Glenmede Investment Management, LP | 2,524 | 95 | ||||||
| 2025-08-14 | 13F | Mml Investors Services, Llc | 8,355 | 2.72 | 0 | |||||
| 2025-04-29 | 13F | Capital Investment Advisory Services, LLC | 0 | -100.00 | 0 | |||||
| 2025-08-13 | 13F | Argyle Capital Partners, LLC | 9,838 | 13.30 | 370 | 18.65 | ||||
| 2025-08-13 | 13F | Ted Buchan & Co | 6,680 | -13.58 | 251 | -9.39 | ||||
| 2025-08-14 | 13F/A | Rockefeller Capital Management L.P. | 30,257 | -29.97 | 1,138 | -26.65 | ||||
| 2025-07-16 | 13F | Essex Financial Services, Inc. | 10,455 | -75.38 | 393 | -74.20 | ||||
| 2025-08-14 | 13F | Royal Bank Of Canada | 125,471 | 1,088.51 | 4,718 | 1,144.85 | ||||
| 2025-08-13 | 13F | Transce3nd, LLC | 23 | 360.00 | 1 | |||||
| 2025-05-14 | 13F | Renaissance Technologies Llc | 0 | -100.00 | 0 | |||||
| 2025-07-18 | 13F | Truist Financial Corp | 19,460 | 4.53 | 732 | 9.60 | ||||
| 2025-08-12 | 13F | Running Point Capital Advisors, LLC | 0 | -100.00 | 0 | |||||
| 2025-08-12 | 13F | Proequities, Inc. | 0 | 0 | ||||||
| 2025-08-05 | 13F | Bank Of Montreal /can/ | 11,645 | 2.79 | 438 | 7.64 | ||||
| 2025-05-15 | 13F | Alliancebernstein L.p. | 0 | -100.00 | 0 | -100.00 | ||||
| 2025-07-24 | 13F | Comprehensive Money Management Services LLC | 21,902 | -4.04 | 824 | 0.61 | ||||
| 2025-06-30 | NP | SMILX - SMI 50/40/10 Fund | 2,890 | -55.74 | 102 | -61.45 | ||||
| 2025-07-24 | 13F | Stonebridge Financial Group, LLC | 0 | -100.00 | 0 | |||||
| 2025-08-29 | NP | RAA - SMI 3Fourteen Real Asset Allocation ETF SMI 3Fourteen REAL Asset Allocation ETF | 263,601 | 22.94 | 9,911 | 28.85 | ||||
| 2025-05-15 | 13F | Glenmede Trust Co Na | 1,129 | 0.00 | 41 | 2.56 | ||||
| 2025-08-08 | 13F | Creative Planning | 15,263 | 10.49 | 574 | 15.76 | ||||
| 2025-08-13 | 13F | Jones Financial Companies Lllp | 4,089 | -9.33 | 155 | -6.10 | ||||
| 2025-08-18 | 13F | Wolverine Trading, Llc | Call | 8,200 | 310 | |||||
| 2025-08-14 | 13F | Jane Street Group, Llc | 262,488 | 73.40 | 9,870 | 81.72 | ||||
| 2025-07-21 | 13F | J. Safra Sarasin Holding AG | 6,000 | 0.00 | 226 | 4.65 | ||||
| 2025-04-28 | 13F | Fedenia Advisers LLC | 0 | -100.00 | 0 | |||||
| 2025-08-14 | 13F | Wells Fargo & Company/mn | 22,951 | -44.23 | 863 | -41.60 | ||||
| 2025-06-30 | NP | SMIDX - SMI Dynamic Allocation Fund | 7,690 | -25.27 | 270 | -25.82 | ||||
| 2025-08-07 | 13F | Allworth Financial LP | 97 | -70.78 | 4 | -72.73 | ||||
| 2025-07-30 | 13F | Whittier Trust Co Of Nevada Inc | 110 | 0.00 | 4 | 33.33 | ||||
| 2025-05-12 | 13F | Kohmann Bosshard Financial Services, LLC | 0 | -100.00 | 0 | |||||
| 2025-08-14 | 13F | Erste Asset Management GmbH | 2,000 | 0.00 | 75 | 5.63 | ||||
| 2025-07-16 | 13F | Strategic Investment Solutions, Inc. /IL | 0 | -100.00 | 0 | |||||
| 2025-05-09 | 13F/A | Oversea-Chinese Banking CORP Ltd | 0 | -100.00 | 0 | -100.00 | ||||
| 2025-08-14 | 13F | Greenline Partners, LLC | 555,538 | 147.29 | 20,888 | 159.16 | ||||
| 2025-08-11 | 13F | TD Waterhouse Canada Inc. | 629 | -8.31 | 24 | -4.17 | ||||
| 2025-08-15 | 13F | Morgan Stanley | 283,027 | -1.81 | 10,642 | 2.89 |