Mga Batayang Estadistika
| Pemilik Institusional | 245 total, 245 long only, 0 short only, 0 long/short - change of 5.60% MRQ |
| Alokasi Portofolio Rata-rata | 0.3939 % - change of 16.24% MRQ |
| Saham Institusional (Jangka Panjang) | 48,421,321 (ex 13D/G) - change of 5.13MM shares 11.85% MRQ |
| Nilai Institusional (Jangka Panjang) | $ 1,108,216 USD ($1000) |
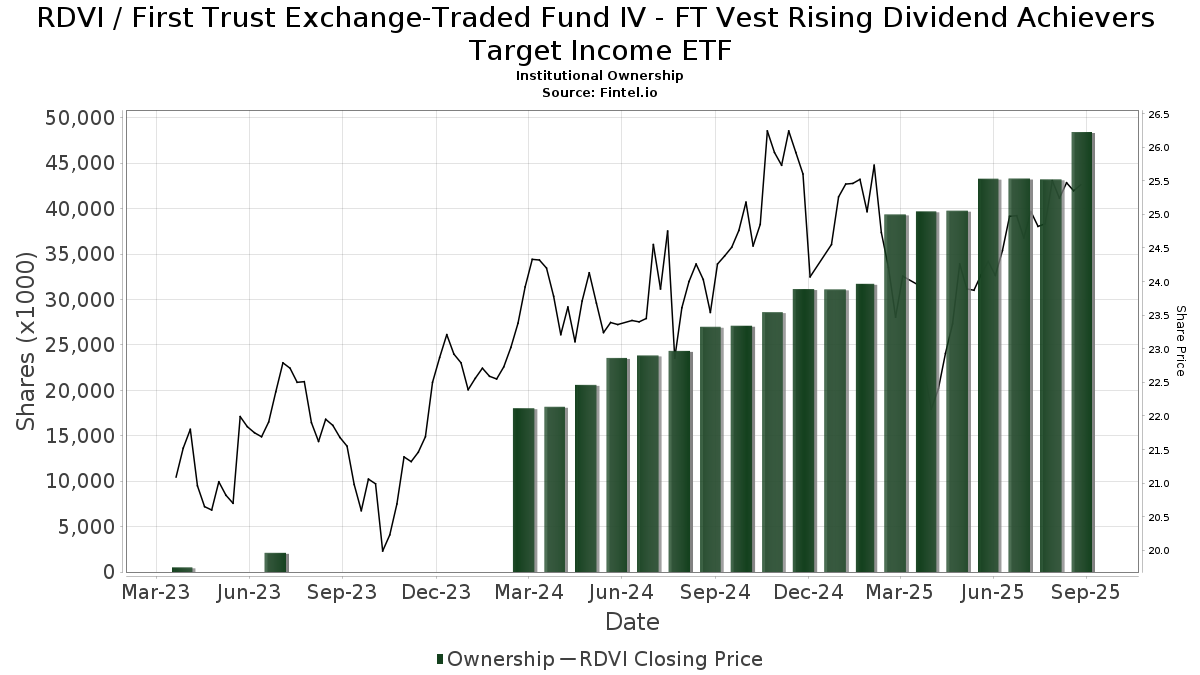
Kepemilikan Institusional dan Pemegang Saham
First Trust Exchange-Traded Fund IV - FT Vest Rising Dividend Achievers Target Income ETF (US:RDVI) memiliki 245 pemilik institusional dan pemegang saham yang telah mengajukan formulir 13D/G atau 13F kepada Komisi Bursa Efek (Securities Exchange Commission/SEC). Lembaga-lembaga ini memegang total 48,421,321 saham. Pemegang saham terbesar meliputi LPL Financial LLC, Raymond James Financial Inc, Wells Fargo & Company/mn, Stifel Financial Corp, Royal Bank Of Canada, Commonwealth Equity Services, Llc, Cetera Investment Advisers, Advisor Group Holdings, Inc., Spectrum Wealth Counsel, LLC, and Baird Financial Group, Inc. .
Struktur kepemilikan institusional First Trust Exchange-Traded Fund IV - FT Vest Rising Dividend Achievers Target Income ETF (BATS:RDVI) menunjukkan posisi terkini di perusahaan oleh institusi dan dana, serta perubahan terbaru dalam ukuran posisi. Pemegang saham utama dapat mencakup investor individu, reksa dana, dana lindung nilai, atau institusi. Jadwal 13D menunjukkan bahwa investor memegang (atau pernah memegang) lebih dari 5% saham perusahaan dan bermaksud (atau pernah bermaksud) untuk secara aktif mengejar perubahan strategi bisnis. Jadwal 13G menunjukkan investasi pasif lebih dari 5%.
The share price as of September 5, 2025 is 25.55 / share. Previously, on September 6, 2024, the share price was 23.52 / share. This represents an increase of 8.63% over that period.
Skor Sentimen Dana
Skor Sentimen Dana (sebelumnya dikenal sebagai Skor Akumulasi Kepemilikan) menemukan saham-saham yang paling banyak dibeli oleh dana. Ini adalah hasil dari model kuantitatif multi-faktor yang canggih yang mengidentifikasi perusahaan dengan tingkat akumulasi institusional tertinggi. Model penilaian menggunakan kombinasi dari total peningkatan pemilik yang diungkapkan, perubahan dalam alokasi portofolio pada pemilik tersebut, dan metrik lainnya. Angka berkisar dari 0 hingga 100, dengan angka yang lebih tinggi menunjukkan tingkat akumulasi yang lebih tinggi dibandingkan dengan perusahaan sejenisnya, dan 50 adalah rata-ratanya.
Frekuensi Pembaruan: Setiap Hari
Lihat Ownership Explorer, yang menyediakan daftar perusahaan dengan peringkat tertinggi.
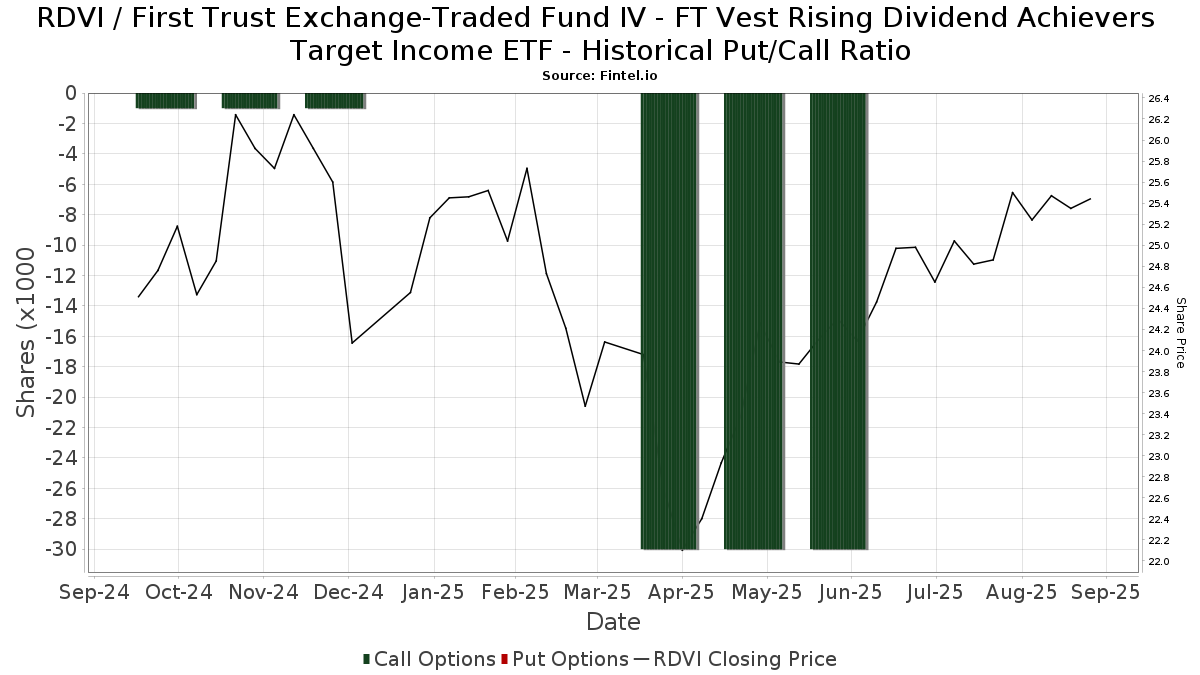
Rasio Put/Call Institusional
Selain melaporkan isu ekuitas dan utang standar, institusi dengan aset di bawah manajemen lebih dari 100 juta dolar AS juga harus mengungkapkan kepemilikan opsi put dan call mereka. Karena opsi put umumnya menunjukkan sentimen negatif, dan opsi call menunjukkan sentimen positif, kita dapat mengetahui sentimen institusional secara keseluruhan dengan memplot rasio put terhadap call. Grafik di sebelah kanan memplot rasio put/call historis untuk instrumen ini.
Menggunakan Rasio Put/Call sebagai indikator sentimen investor mengatasi salah satu kekurangan utama dari penggunaan total kepemilikan institusional, yaitu sejumlah besar aset yang dikelola diinvestasikan secara pasif untuk melacak indeks. Dana yang dikelola secara pasif biasanya tidak membeli opsi, sehingga indikator rasio put/call lebih akurat dalam melacak sentimen dana yang dikelola secara aktif.
Pengajuan 13D/G
Kami menyajikan pengajuan 13D/G secara terpisah dari pengajuan 13F karena perlakuan yang berbeda oleh SEC. Pengajuan 13D/G dapat diajukan oleh kelompok investor (dengan satu pemimpin), sedangkan pengajuan 13F tidak bisa. Hal ini mengakibatkan situasi di mana seorang investor dapat mengajukan 13D/G yang melaporkan satu nilai untuk total saham (mewakili semua saham yang dimiliki oleh kelompok investor), tetapi kemudian mengajukan 13F yang melaporkan nilai yang berbeda untuk total saham (mewakili kepemilikan mereka sendiri). Ini berarti bahwa kepemilikan saham dari pengajuan 13D/G dan pengajuan 13F seringkali tidak dapat dibandingkan secara langsung, sehingga kami menyajikannya secara terpisah.
Catatan: Mulai 16 Mei 2021, kami tidak lagi menampilkan pemilik yang belum mengajukan 13D/G dalam setahun terakhir. Sebelumnya, kami menampilkan riwayat lengkap pengajuan 13D/G. Secara umum, entitas yang diwajibkan untuk mengajukan pengajuan 13D/G harus mengajukan setidaknya setiap tahun sebelum mengirimkan pengajuan penutupan. Namun, terkadang dana keluar dari posisi tanpa mengirimkan pengajuan penutupan (misalnya, mereka menghentikan operasi), sehingga menampilkan riwayat lengkap terkadang menyebabkan kebingungan tentang kepemilikan saat ini. Untuk mencegah kebingungan, kami sekarang hanya menampilkan pemilik 'saat ini' - yaitu - pemilik yang telah mengajukan dalam setahun terakhir.
Upgrade to unlock premium data.
| Tanggal File | Formulir | Investor | Sebelumnya Saham |
Terbaru Saham |
Δ Saham (Persen) |
Kepemilikan (Persen) |
Δ Pagmamay-ari (Persen) |
|
|---|---|---|---|---|---|---|---|---|
| 2025-07-28 | FIRST TRUST PORTFOLIOS LP | 11,406,060 | 14,677,593 | 28.68 | 17.82 | -13.91 |
Pengajuan 13F dan NPORT
Detail pada pengajuan 13F tersedia gratis. Detail pada pengajuan NP memerlukan keanggotaan premium. Baris berwarna hijau menunjukkan posisi baru. Baris berwarna merah menunjukkan posisi yang sudah ditutup. Klik tautan ini ikon untuk melihat riwayat transaksi selengkapnya.
Tingkatkan
untuk membuka data premium dan mengekspor ke Excel ![]() .
.
| Tanggal File | Sumber | Investor | Ketik | Presyo ng Avg (Silangan) |
Saham | Δ Saham (%) |
Dilaporkan Nilai ($1000) |
Nilai Δ (%) |
Alokasi Port (%) |
|
|---|---|---|---|---|---|---|---|---|---|---|
| 2025-08-11 | 13F | Rothschild Investment Llc | 4,675 | 0.00 | 116 | 4.55 | ||||
| 2025-07-01 | 13F | Park National Corp /oh/ | 718,063 | 2.55 | 17,743 | 6.83 | ||||
| 2025-08-14 | 13F | Comerica Bank | 9,611 | 106.02 | 237 | 115.45 | ||||
| 2025-07-25 | 13F | Cwm, Llc | 64,942 | 4.53 | 2 | 0.00 | ||||
| 2025-08-12 | 13F | Integrated Advisors Network LLC | 26,019 | 643 | ||||||
| 2025-08-06 | 13F | Wedbush Securities Inc | 75,372 | 9.12 | 2 | 0.00 | ||||
| 2025-05-15 | 13F/A | Orion Portfolio Solutions, LLC | 45,305 | 62.37 | 1,075 | 58.88 | ||||
| 2025-07-11 | 13F | Farther Finance Advisors, LLC | 35,264 | 197.36 | 871 | 208.87 | ||||
| 2025-08-11 | 13F | Nations Financial Group Inc, /ia/ /adv | 34,979 | 36.69 | 864 | 42.34 | ||||
| 2025-08-12 | 13F | Cornerstone Wealth Management, LLC | 8,933 | 221 | ||||||
| 2025-08-11 | 13F | Principal Securities, Inc. | 305,342 | 5,571.29 | 7,545 | 5,703.85 | ||||
| 2025-05-16 | 13F/A | Kestra Investment Management, LLC | 0 | -100.00 | 0 | |||||
| 2025-07-24 | 13F | Endeavor Private Wealth, Inc. | 12,995 | 321 | ||||||
| 2025-07-16 | 13F | Beaumont Financial Advisors, LLC | 508,460 | 12,564 | ||||||
| 2025-07-23 | 13F | Steel Peak Wealth Management LLC | 33,129 | -26.79 | 819 | -23.77 | ||||
| 2025-08-08 | 13F | Comprehensive Financial Planning, Inc./PA | 43,270 | 4.59 | 1,069 | 8.97 | ||||
| 2025-07-08 | 13F | Zrc Wealth Management, Llc | 2,053 | 0.00 | 51 | 4.17 | ||||
| 2025-07-29 | 13F | Kraft, Davis & Associates, LLC | 8,361 | 209 | ||||||
| 2025-07-23 | 13F | RiverTree Advisors, LLC | 106,154 | 2,623 | ||||||
| 2025-08-11 | 13F | Semus Wealth Partners LLC | 119,335 | 3.45 | 2,949 | 7.75 | ||||
| 2025-07-09 | 13F | Triumph Capital Management | 66,303 | 1,638 | ||||||
| 2025-08-08 | 13F | Larson Financial Group LLC | 1,843 | 1.10 | 46 | 4.65 | ||||
| 2025-08-13 | 13F | Truvestments Capital Llc | 69,388 | -14.86 | 1,715 | -11.33 | ||||
| 2025-08-29 | 13F | Centaurus Financial, Inc. | 35,003 | 25.92 | 1 | |||||
| 2025-07-17 | 13F | Nelson, Van Denburg & Campbell Wealth Management Group, LLC | 29,521 | -0.15 | 729 | 3.99 | ||||
| 2025-08-14 | 13F | Qube Research & Technologies Ltd | 0 | -100.00 | 0 | |||||
| 2025-08-14 | 13F | Harvest Investment Services, LLC | 50,633 | -22.18 | 1,251 | -18.92 | ||||
| 2025-07-10 | 13F | Marshall Financial Group LLC | 44,426 | 18.32 | 1,104 | 24.04 | ||||
| 2025-07-25 | 13F | Prostatis Group LLC | 161,224 | 11.27 | 3,984 | 15.89 | ||||
| 2025-05-15 | 13F | Talon Private Wealth, LLC | 0 | -100.00 | 0 | -100.00 | ||||
| 2025-08-06 | 13F | Centerpoint Advisory Group | 26,685 | 659 | ||||||
| 2025-07-30 | 13F/A | KPP Advisory Services LLC | 88,130 | 2.07 | 2,178 | 6.30 | ||||
| 2025-07-10 | 13F | Secure Asset Management, LLC | 0 | -100.00 | 0 | |||||
| 2025-07-28 | 13F | RFG Advisory, LLC | 134,626 | 46.37 | 3,327 | 52.50 | ||||
| 2025-08-11 | 13F | Tidemark, LLC | 34,275 | 72.91 | 847 | 80.00 | ||||
| 2025-08-08 | 13F/A | Prospect Financial Services LLC | 8,578 | 212 | ||||||
| 2025-08-11 | 13F | Plotkin Financial Advisors, LLC | 33,857 | 13.77 | 837 | 18.58 | ||||
| 2025-07-29 | 13F | Balboa Wealth Partners | 81,588 | 59.20 | 2,016 | 65.93 | ||||
| 2025-08-13 | 13F | VestGen Advisors, LLC | 534,906 | 9.70 | 13,218 | 14.28 | ||||
| 2025-08-14 | 13F | CoreCap Advisors, LLC | 37,621 | 32.40 | 930 | 37.83 | ||||
| 2025-05-07 | 13F | Inspire Advisors, LLC | 0 | -100.00 | 0 | |||||
| 2025-07-25 | 13F | We Are One Seven, LLC | 22,160 | 0.14 | 548 | 4.39 | ||||
| 2025-07-16 | 13F | Novem Group | 18,302 | -15.60 | 452 | -12.06 | ||||
| 2025-07-30 | 13F | Brookstone Capital Management | 62,875 | 44.37 | 1,554 | 50.34 | ||||
| 2025-08-12 | 13F | Founders Financial Alliance, LLC | 0 | -100.00 | 0 | |||||
| 2025-05-13 | 13F | BlackDiamond Wealth Management Inc. | 0 | -100.00 | 0 | |||||
| 2025-08-08 | 13F | Capital Investment Advisory Services, LLC | 148,096 | 7.57 | 3,659 | 12.07 | ||||
| 2025-07-22 | 13F | Luken Investment Analytics, LLC | 476,310 | -28.76 | 11,770 | -25.79 | ||||
| 2025-08-14 | 13F | Fwl Investment Management, Llc | 0 | -100.00 | 0 | |||||
| 2025-08-14 | 13F | Goldman Sachs Group Inc | 0 | -100.00 | 0 | |||||
| 2025-09-04 | 13F/A | Advisor Group Holdings, Inc. | 1,206,446 | 2.94 | 29,812 | 7.24 | ||||
| 2025-08-12 | 13F | LPL Financial LLC | 7,805,040 | 13.29 | 192,863 | 18.02 | ||||
| 2025-04-28 | 13F | Strategic Financial Concepts, LLC | 0 | -100.00 | 0 | -100.00 | ||||
| 2025-08-04 | 13F | Arkadios Wealth Advisors | 45,444 | 16.39 | 1,123 | 21.17 | ||||
| 2025-08-14 | 13F | Ambassador Advisors, LLC | 17,859 | 3.33 | 441 | 7.82 | ||||
| 2025-08-08 | 13F | Foundations Investment Advisors, LLC | 17,081 | -72.67 | 422 | -71.52 | ||||
| 2025-08-12 | 13F | Proequities, Inc. | 0 | 0 | ||||||
| 2025-04-10 | 13F | Key Client Fiduciary Advisors, LLC | 0 | -100.00 | 0 | |||||
| 2025-08-05 | 13F | Atlas Wealth LLC | 113,306 | 0.66 | 2,827 | 5.88 | ||||
| 2025-08-12 | 13F | Insigneo Advisory Services, Llc | 26,716 | 21.35 | 660 | 26.44 | ||||
| 2025-08-01 | 13F | Belvedere Trading LLC | Call | 10,100 | 250 | |||||
| 2025-08-07 | 13F | Kestra Private Wealth Services, Llc | 65,376 | 12.96 | 1,615 | 17.71 | ||||
| 2025-07-17 | 13F | Janney Montgomery Scott LLC | 575,752 | 14.30 | 14 | 27.27 | ||||
| 2025-07-22 | 13F | Wealthcare Advisory Partners LLC | 20,782 | 514 | ||||||
| 2025-08-14 | 13F | Herold Advisors, Inc. | 31,958 | -38.95 | 790 | -36.42 | ||||
| 2025-08-15 | 13F | Morgan Stanley | 12,692 | 0.87 | 314 | 5.03 | ||||
| 2025-08-04 | 13F | Daymark Wealth Partners, Llc | 22,340 | 149.66 | 552 | 160.38 | ||||
| 2025-08-06 | 13F | Commonwealth Equity Services, Llc | 1,826,770 | 7.46 | 45 | 12.50 | ||||
| 2025-08-12 | 13F | Calton & Associates, Inc. | 38,662 | 63.59 | 955 | 70.54 | ||||
| 2025-07-31 | 13F | Oppenheimer & Co Inc | 92,544 | 167.72 | 2,287 | 179.12 | ||||
| 2025-08-14 | 13F | Great Valley Advisor Group, Inc. | 18,138 | 15.36 | 448 | 20.16 | ||||
| 2025-08-15 | 13F | Kestra Advisory Services, LLC | 645,042 | 37.36 | 15,939 | 43.08 | ||||
| 2025-04-25 | 13F | Smallwood Wealth Investment Management, LLC | 2,000 | 47 | ||||||
| 2025-08-11 | 13F | Western Wealth Management, LLC | 44,873 | 0.37 | 1,109 | 4.53 | ||||
| 2025-08-13 | 13F | Virtue Capital Management, LLC | 0 | -100.00 | 0 | |||||
| 2025-08-01 | 13F | Envestnet Asset Management Inc | 613,236 | -62.97 | 15,153 | -61.43 | ||||
| 2025-07-22 | 13F | Comprehensive Financial Consultants Institutional, Inc. | 15,952 | 0.00 | 394 | 4.23 | ||||
| 2025-07-30 | 13F | Rehmann Capital Advisory Group | 97,702 | 11.11 | 2,414 | 15.78 | ||||
| 2025-07-30 | 13F | TFB Advisors LLC | 10,732 | 265 | ||||||
| 2025-08-08 | 13F/A | Ignite Planners, LLC | 10,169 | 10.99 | 252 | 20.00 | ||||
| 2025-08-18 | 13F | Arq Wealth Advisors, Llc | 109,947 | 0.00 | 2,608 | 0.00 | ||||
| 2025-08-14 | 13F | Sequent Planning LLC | 57,286 | 5.88 | 1,416 | 10.29 | ||||
| 2025-07-30 | 13F | Insight Advisors, LLC/ PA | 44,394 | 2.67 | 1,097 | 6.93 | ||||
| 2025-08-04 | 13F | Bay Colony Advisory Group, Inc d/b/a Bay Colony Advisors | 8,263 | 204 | ||||||
| 2025-08-11 | 13F | Synergy Investment Management, LLC | 0 | -100.00 | 0 | |||||
| 2025-07-21 | 13F | Ameritas Advisory Services, LLC | 56,365 | -8.17 | 1,393 | -5.05 | ||||
| 2025-07-10 | 13F | Kozak & Associates, Inc. | 846 | 2.17 | 21 | 16.67 | ||||
| 2025-08-12 | 13F | Steward Partners Investment Advisory, Llc | 105,675 | 23.14 | 2,611 | 28.30 | ||||
| 2025-08-14 | 13F | Stifel Financial Corp | 2,142,991 | 45.52 | 52,953 | 51.59 | ||||
| 2025-08-07 | 13F | Argent Advisors, Inc. | 386,701 | -2.84 | 9,555 | 1.22 | ||||
| 2025-05-07 | 13F | Spectrum Wealth Counsel, LLC | 1,061,445 | 1.05 | 25,177 | -1.12 | ||||
| 2025-08-14 | 13F | Fmr Llc | 0 | -100.00 | 0 | |||||
| 2025-07-16 | 13F | ORG Partners LLC | 5,000 | -37.50 | 125 | -34.74 | ||||
| 2025-08-12 | 13F | Winnow Wealth Llc | 0 | -100.00 | 0 | -100.00 | ||||
| 2025-08-06 | 13F | AE Wealth Management LLC | 19,853 | 32.96 | 491 | 38.42 | ||||
| 2025-07-25 | 13F | Second Half Financial Partners, LLC | 634,190 | 2.22 | 15,671 | 6.48 | ||||
| 2025-08-11 | 13F | Regal Investment Advisors LLC | 29,767 | 736 | ||||||
| 2025-08-14 | 13F | Integrated Wealth Concepts LLC | 315,465 | -1.26 | 7,795 | 2.86 | ||||
| 2025-08-13 | 13F | Smith, Moore & Co. | 14,209 | -0.41 | 351 | 3.85 | ||||
| 2025-07-23 | 13F | Clear Creek Financial Management, LLC | 10,530 | 22.16 | 260 | 27.45 | ||||
| 2025-08-12 | 13F | Resolute Wealth Strategies, LLC | 49,043 | 11.62 | 1,212 | 16.22 | ||||
| 2025-07-18 | 13F | Midwest Financial Group LLC | 108,595 | -53.09 | 2,683 | -51.14 | ||||
| 2025-08-19 | 13F | Newbridge Financial Services Group, Inc. | 43,266 | 1,069 | ||||||
| 2025-08-14 | 13F | Old Mission Capital Llc | 31,007 | 766 | ||||||
| 2025-08-11 | 13F | Mach-1 Financial Group, Inc. | 8,793 | 217 | ||||||
| 2025-08-05 | 13F | Milestone Asset Management, Llc | 40,171 | 47.52 | 993 | 53.80 | ||||
| 2025-07-24 | 13F | Aurora Private Wealth, Inc. | 74,971 | 143.01 | 2 | |||||
| 2025-08-14 | 13F | Harwood Advisory Group, LLC | 14,823 | 36.40 | 366 | 39.16 | ||||
| 2025-07-31 | 13F | Whipplewood Advisors, LLC | 128,883 | 2,526.51 | 3,185 | 10.71 | ||||
| 2025-07-17 | 13F | Global Trust Asset Management, LLC | 0 | -100.00 | 0 | |||||
| 2025-08-06 | 13F | Legacy Investment Solutions, LLC | 27,523 | 65.67 | 680 | 62.29 | ||||
| 2025-08-25 | NP | FTBI - First Trust Balanced Income ETF | 8,319 | 206 | ||||||
| 2025-08-01 | 13F | Delta Investment Management, LLC | 79,777 | 10.97 | 1,971 | 15.60 | ||||
| 2025-08-14 | 13F | Snowden Capital Advisors LLC | 134,011 | 2.48 | 3,311 | 6.77 | ||||
| 2025-04-23 | 13F | Golden State Wealth Management, LLC | 0 | -100.00 | 0 | |||||
| 2025-07-29 | 13F | Stratos Wealth Partners, LTD. | 163,639 | 591.57 | 4,044 | 620.68 | ||||
| 2025-08-04 | 13F | L.m. Kohn & Company | 13,520 | 334 | ||||||
| 2025-08-14 | 13F | IHT Wealth Management, LLC | 75,319 | 115.13 | 1,861 | 124.22 | ||||
| 2025-08-01 | 13F | Chilton Capital Management Llc | 27,862 | 1.76 | 688 | 6.01 | ||||
| 2025-08-01 | 13F | Ashton Thomas Private Wealth, LLC | 49,028 | 0.36 | 1,211 | 4.58 | ||||
| 2025-07-21 | 13F | Patriot Financial Group Insurance Agency, LLC | 144,676 | 18.56 | 3,575 | 23.50 | ||||
| 2025-08-13 | 13F | Cresset Asset Management, LLC | 9,198 | 227 | ||||||
| 2025-07-30 | 13F | Prosperity Financial Group, Inc. | 140,889 | 8.27 | 3,481 | 12.80 | ||||
| 2025-08-12 | 13F | Jpmorgan Chase & Co | 382 | -88.31 | 9 | -88.31 | ||||
| 2025-08-14 | 13F | GWM Advisors LLC | 167,898 | -19.45 | 4,149 | -16.10 | ||||
| 2025-07-22 | 13F | Echo Wealth Management, LLC | 334,806 | -0.20 | 8,273 | 3.97 | ||||
| 2025-07-22 | 13F | Global Assets Advisory, LLC | 34,775 | -67.76 | 868 | -64.22 | ||||
| 2025-07-30 | 13F | Retirement Planning Group | 53,867 | 21.96 | 1,331 | 27.13 | ||||
| 2025-08-05 | 13F | GPS Wealth Strategies Group, LLC | 58,683 | 16.42 | 1,450 | 21.34 | ||||
| 2025-08-08 | 13F | Financial Gravity Companies, Inc. | 0 | -100.00 | 0 | |||||
| 2025-07-23 | 13F | Prime Capital Investment Advisors, LLC | 564,607 | 3,213.42 | 13,951 | 3,353.22 | ||||
| 2025-08-07 | 13F | Allworth Financial LP | 1,617 | 40 | ||||||
| 2025-08-04 | 13F | Hantz Financial Services, Inc. | 163 | 0.00 | 0 | |||||
| 2025-08-12 | 13F | O'shaughnessy Asset Management, Llc | 28 | -85.34 | 1 | -100.00 | ||||
| 2025-07-25 | 13F | Hazlett, Burt & Watson, Inc. | 2,874 | 60.38 | 0 | |||||
| 2025-08-05 | 13F | Sigma Planning Corp | 33,504 | -50.66 | 828 | -48.63 | ||||
| 2025-08-08 | 13F | Cooper Capital Advisors LLC | 291,424 | 7,201 | ||||||
| 2025-08-14 | 13F | Sunbelt Securities, Inc. | 17,037 | -1.89 | 413 | 0.24 | ||||
| 2025-08-18 | 13F | Tyler-Stone Wealth Management | 29,601 | 8.78 | 731 | 13.33 | ||||
| 2025-05-12 | 13F | Simplex Trading, Llc | 0 | -100.00 | 0 | |||||
| 2025-07-24 | 13F | SLT Holdings LLC | 0 | -100.00 | 0 | |||||
| 2025-07-25 | 13F | Envestnet Portfolio Solutions, Inc. | 0 | -100.00 | 0 | |||||
| 2025-08-13 | 13F | WCG Wealth Advisors LLC | 0 | -100.00 | 0 | |||||
| 2025-08-08 | 13F | Hartland & Co., LLC | 1,053 | 0.00 | 26 | 8.33 | ||||
| 2025-07-22 | 13F | Accel Wealth Management | 12,352 | 4.58 | 305 | 8.93 | ||||
| 2025-07-09 | 13F | Tounjian Advisory Partners, Llc | 11,665 | 0.00 | 277 | 0.00 | ||||
| 2025-05-12 | 13F | Independent Advisor Alliance | 0 | -100.00 | 0 | |||||
| 2025-08-04 | 13F | Northwest Financial Advisors | 8,516 | 210 | ||||||
| 2025-08-14 | 13F | Wells Fargo & Company/mn | 2,371,052 | 13.50 | 58,589 | 18.24 | ||||
| 2025-08-12 | 13F | SRS Capital Advisors, Inc. | 685,753 | 30.68 | 16,945 | 36.13 | ||||
| 2025-07-25 | 13F | Apollon Wealth Management, LLC | 15,244 | 0.00 | 377 | 4.16 | ||||
| 2025-05-15 | 13F | Citadel Advisors Llc | 0 | -100.00 | 0 | -100.00 | ||||
| 2025-07-14 | 13F | IronOak Wealth LLC. | 0 | -100.00 | 0 | |||||
| 2025-08-14 | 13F | Raymond James Financial Inc | 2,589,340 | 18.69 | 63,983 | 23.64 | ||||
| 2025-07-24 | 13F | WMG Financial Advisors, LLC | 25,097 | 620 | ||||||
| 2025-08-08 | 13F | Kingsview Wealth Management, LLC | 189,271 | 13.40 | 4,677 | 18.11 | ||||
| 2025-08-04 | 13F | Atria Investments Llc | 13,997 | -9.81 | 346 | -6.25 | ||||
| 2025-08-14 | 13F | Susquehanna International Group, Llp | 121,952 | 107.82 | 3,013 | 116.61 | ||||
| 2025-04-30 | 13F | POM Investment Strategies, LLC | 0 | -100.00 | 0 | |||||
| 2025-07-30 | 13F | D.a. Davidson & Co. | 98,553 | 7.73 | 2,435 | 12.26 | ||||
| 2025-08-08 | 13F | Cetera Investment Advisers | 1,521,561 | 11.69 | 37,598 | 16.35 | ||||
| 2025-07-17 | 13F | Wagner Wealth Management, Llc | 1,745 | 1.99 | 43 | 7.50 | ||||
| 2025-07-29 | 13F | International Assets Investment Management, Llc | 52,300 | 20.65 | 1,292 | 25.68 | ||||
| 2025-08-26 | 13F/A | Thrivent Financial For Lutherans | 35,109 | 4.17 | 1 | |||||
| 2025-07-17 | 13F | G&S Capital LLC | 132,218 | 1.17 | 3,267 | 5.42 | ||||
| 2025-08-14 | 13F/A | Rockefeller Capital Management L.P. | 147,119 | 14.30 | 3,635 | 19.06 | ||||
| 2025-08-14 | 13F | Mariner, LLC | 310,752 | 27.78 | 7,679 | 33.11 | ||||
| 2025-08-14 | 13F | Wiley Bros.-aintree Capital, Llc | 26,522 | -86.85 | 655 | -86.18 | ||||
| 2025-07-21 | 13F | Barrett & Company, Inc. | 4,875 | 120 | ||||||
| 2025-08-06 | 13F | Cherry Creek Investment Advisors, Inc. | 9,674 | -0.30 | 239 | 3.91 | ||||
| 2025-08-14 | 13F | Synovus Financial Corp | 64,967 | 443.43 | 1,605 | 467.14 | ||||
| 2025-07-08 | 13F | Nbc Securities, Inc. | 10,874 | 0.74 | 0 | |||||
| 2025-07-16 | 13F | Maridea Wealth Management LLC | 89,941 | 2,222 | ||||||
| 2025-07-31 | 13F | Cambridge Investment Research Advisors, Inc. | 687,426 | 2.36 | 17 | 6.67 | ||||
| 2025-08-13 | 13F | Level Four Advisory Services, Llc | 14,186 | 11.00 | 351 | 15.51 | ||||
| 2025-07-23 | 13F | REAP Financial Group, LLC | 0 | -100.00 | 0 | |||||
| 2025-07-31 | 13F | Moloney Securities Asset Management, LLC | 58,620 | 3.65 | 1,448 | 7.98 | ||||
| 2025-07-24 | 13F | IFP Advisors, Inc | 74,071 | -7.18 | 1,830 | -3.28 | ||||
| 2025-08-06 | 13F | Prospera Financial Services Inc | 683,304 | 17.67 | 16,890 | 22.58 | ||||
| 2025-08-12 | 13F | Gladstone Institutional Advisory LLC | 13,785 | -18.33 | 341 | -15.00 | ||||
| 2025-07-24 | 13F | Ronald Blue Trust, Inc. | 500 | -77.92 | 12 | -78.18 | ||||
| 2025-08-06 | 13F | Moors & Cabot, Inc. | 17,782 | 2.27 | 439 | 6.55 | ||||
| 2025-08-19 | 13F | Advisory Services Network, LLC | 16,209 | 31.78 | 401 | 37.46 | ||||
| 2025-07-30 | 13F | BlueChip Wealth Advisors LLC | 19,324 | 0.00 | 477 | 4.15 | ||||
| 2025-07-29 | 13F | Private Trust Co Na | 24,036 | -3.03 | 594 | 1.02 | ||||
| 2025-07-16 | 13F | Formidable Asset Management, LLC | 9,475 | 0.00 | 225 | 0.00 | ||||
| 2025-08-14 | 13F | Acorn Wealth Advisors, LLC | 15,174 | 0.46 | 375 | 4.47 | ||||
| 2025-07-28 | 13F | Harbour Investments, Inc. | 564,819 | 10.32 | 13,957 | 14.92 | ||||
| 2025-08-04 | 13F | Spire Wealth Management | 0 | -100.00 | 0 | |||||
| 2025-07-25 | 13F | Atria Wealth Solutions, Inc. | 82,162 | 3.60 | 2,030 | 7.92 | ||||
| 2025-08-12 | 13F | NWF Advisory Services Inc. | 0 | -100.00 | 0 | |||||
| 2025-08-14 | 13F | Benjamin Edwards Inc | 9,620 | 238 | ||||||
| 2025-08-12 | 13F | Change Path, LLC | 37,076 | -24.08 | 916 | -20.90 | ||||
| 2025-08-08 | 13F | Avantax Advisory Services, Inc. | 179,318 | -1.36 | 4,431 | 2.74 | ||||
| 2025-08-19 | 13F | National Asset Management, Inc. | 13,986 | -95.77 | 346 | -95.69 | ||||
| 2025-08-04 | 13F | IFG Advisory, LLC | 17,146 | 424 | ||||||
| 2025-08-11 | 13F | Aptus Capital Advisors, LLC | 7,000 | 0.00 | 173 | 3.61 | ||||
| 2025-08-13 | 13F | StoneX Group Inc. | 93,331 | 3.61 | 2,306 | 7.96 | ||||
| 2025-07-18 | 13F | Truist Financial Corp | 187,433 | -85.94 | 4,631 | -85.36 | ||||
| 2025-08-04 | 13F | Creekmur Asset Management LLC | 1,916 | 2.13 | 47 | 6.82 | ||||
| 2025-08-13 | 13F | Capital Analysts, Inc. | 87,484 | -0.61 | 2 | 0.00 | ||||
| 2025-08-06 | 13F | Walkner Condon Financial Advisors LLC | 9,750 | -26.69 | 241 | -23.81 | ||||
| 2025-04-21 | 13F | MN Wealth Advisors, LLC | 0 | -100.00 | 0 | |||||
| 2025-08-15 | 13F | First Heartland Consultants, Inc. | 16,744 | -5.93 | 414 | -2.13 | ||||
| 2025-07-08 | 13F | Next Level Private LLC | 25,106 | -9.84 | 620 | -6.06 | ||||
| 2025-08-05 | 13F | Lifeworks Advisors, LLC | 55,852 | -4.20 | 1,380 | -0.14 | ||||
| 2025-07-02 | 13F | HBW Advisory Services LLC | 12,012 | 0.00 | 297 | 4.23 | ||||
| 2025-07-15 | 13F | Clarus Group, Inc. | 433,007 | 10,700 | ||||||
| 2025-07-28 | 13F | BRYN MAWR TRUST Co | 12,962 | 31.02 | 320 | 36.75 | ||||
| 2025-07-30 | 13F | Avidian Wealth Solutions, LLC | 32,757 | -7.83 | 809 | -3.92 | ||||
| 2025-08-07 | 13F | Pinnacle Wealth Management Advisory Group, LLC | 318,232 | 8.16 | 7,864 | 12.68 | ||||
| 2025-08-11 | 13F | Core Wealth Partners LLC | 25,258 | 74.97 | 624 | 82.46 | ||||
| 2025-08-14 | 13F | Mml Investors Services, Llc | 37,782 | -23.32 | 1 | -100.00 | ||||
| 2025-08-06 | 13F | Stonebridge Financial Planning Group, LLC | 68,696 | 8.28 | 1,697 | 12.83 | ||||
| 2025-08-18 | 13F | N.E.W. Advisory Services LLC | 0 | -100.00 | 0 | |||||
| 2025-07-09 | 13F | Beacon Financial Group | 54,880 | -0.23 | 1,356 | 3.99 | ||||
| 2025-08-11 | 13F | Private Advisor Group, LLC | 142,300 | -9.01 | 3,516 | -5.20 | ||||
| 2025-05-14 | 13F | Triad Wealth Partners, LLC | 0 | -100.00 | 0 | |||||
| 2025-08-14 | 13F | Citadel Advisors Llc | Call | 20,200 | 499 | |||||
| 2025-07-30 | 13F | IMG Wealth Management, Inc. | 2,253 | 31.37 | 56 | 37.50 | ||||
| 2025-08-14 | 13F | Marshall Investment Management, Llc | 0 | -100.00 | 0 | |||||
| 2025-07-23 | 13F | Tcfg Wealth Management, Llc | 16,729 | 0.00 | 413 | 4.29 | ||||
| 2025-04-30 | 13F | Sofos Investments, Inc. | 0 | -100.00 | 0 | |||||
| 2025-07-23 | 13F | Trueblood Wealth Management, LLC | 130,488 | 5.60 | 3,224 | 10.03 | ||||
| 2025-08-14 | 13F | Main Street Financial Solutions, LLC | 20,286 | 0.21 | 501 | 4.38 | ||||
| 2025-07-21 | 13F | Ashton Thomas Securities, Llc | 12,225 | 32.52 | 302 | 38.53 | ||||
| 2025-07-03 | 13F | TrueWealth Advisors, LLC | 37,736 | 2.04 | 932 | 6.27 | ||||
| 2025-07-14 | 13F | U.S. Capital Wealth Advisors, LLC | 16,495 | -0.15 | 408 | 4.09 | ||||
| 2025-08-12 | 13F | J.w. Cole Advisors, Inc. | 118,014 | 34.04 | 2,916 | 39.66 | ||||
| 2025-07-29 | 13F | Stephens Inc /ar/ | 98,235 | 4.96 | 2,427 | 9.32 | ||||
| 2025-05-12 | 13F | Sandy Spring Bank | 56,350 | 0.62 | 1,337 | -1.55 | ||||
| 2025-07-11 | 13F | Quad-Cities Investment Group, LLC | 54,793 | 7.66 | 1,354 | 12.10 | ||||
| 2025-07-17 | 13F | Greenleaf Trust | 0 | -100.00 | 0 | |||||
| 2025-08-13 | 13F | First Trust Advisors Lp | 27,782 | 686 | ||||||
| 2025-08-14 | 13F | Colony Group, LLC | 857,825 | 21,197 | ||||||
| 2025-08-13 | 13F | Gateway Wealth Partners, LLC | 166,853 | 2.72 | 4,123 | 7.01 | ||||
| 2025-08-14 | 13F | Royal Bank Of Canada | 1,849,080 | 10.54 | 45,691 | 15.15 | ||||
| 2025-08-13 | 13F | Baird Financial Group, Inc. | 1,020,175 | 10.32 | 25,209 | 14.93 | ||||
| 2025-07-16 | 13F | Owen LaRue, LLC | 62,136 | -34.78 | 1,535 | -32.05 | ||||
| 2025-08-04 | 13F | Pinnacle Associates Ltd | 772,479 | 5.57 | 19,088 | 9.97 | ||||
| 2025-08-14 | 13F | Warren Averett Asset Management, LLC | 22,251 | 1.35 | 550 | 5.58 | ||||
| 2025-08-13 | 13F | EverSource Wealth Advisors, LLC | 33,125 | 14.31 | 819 | 19.07 | ||||
| 2025-08-15 | 13F | Asset Allocation Strategies LLC | 26,251 | 649 | ||||||
| 2025-08-14 | 13F | EP Wealth Advisors, Inc. | 9,650 | 238 | ||||||
| 2025-08-04 | 13F | Econ Financial Services Corp | 62,530 | -6.04 | 1,545 | -2.09 | ||||
| 2025-07-08 | 13F | Adamsbrown Wealth Consultants Llc | 541,004 | 15.37 | 13,368 | 20.18 | ||||
| 2025-08-18 | 13F | Geneos Wealth Management Inc. | 3,044 | 18.81 | 75 | 25.00 | ||||
| 2025-08-13 | 13F | Transce3nd, LLC | 0 | -100.00 | 0 | |||||
| 2025-07-21 | 13F | DHJJ Financial Advisors, Ltd. | 8,482 | -15.70 | 210 | -12.18 | ||||
| 2025-08-14 | 13F | Ausdal Financial Partners, Inc. | 64,656 | 1.75 | 1,598 | 5.97 | ||||
| 2025-08-01 | 13F | Brookwood Investment Group LLC | 8,813 | 0.40 | 218 | 4.33 | ||||
| 2025-08-13 | 13F | Raab & Moskowitz Asset Management LLC | 20,500 | 0.00 | 507 | 4.12 | ||||
| 2025-08-14 | 13F | Guardian Wealth Advisors, Llc / Nc | 7,000 | 0.00 | 173 | 3.61 | ||||
| 2025-07-10 | 13F | Wealth Enhancement Advisory Services, Llc | 591,620 | 6.81 | 14,814 | 12.76 | ||||
| 2025-08-14 | 13F | Atomi Financial Group, Inc. | 43,266 | -3.79 | 1,069 | 0.28 | ||||
| 2025-07-18 | 13F | QTR Family Wealth, LLC | 24,418 | 4.97 | 603 | 9.44 | ||||
| 2025-07-22 | 13F | Hickory Asset Management, Inc. | 9,769 | -4.61 | 241 | -0.41 | ||||
| 2025-05-14 | 13F | Summit Financial Wealth Advisors, LLC | 347,949 | 9.61 | 8,253 | 2.85 | ||||
| 2025-07-11 | 13F | Seacrest Wealth Management, Llc | 0 | -100.00 | 0 | |||||
| 2025-08-06 | 13F | Legacy Wealth Managment, LLC/ID | 27,523 | 33.41 | 680 | 39.06 | ||||
| 2025-08-06 | 13F | TKG Advisors, LLC | 19,579 | 10.71 | 484 | 15.27 | ||||
| 2025-07-25 | 13F | Total Clarity Wealth Management, Inc. | 16,305 | 0.00 | 403 | 1.77 | ||||
| 2025-05-13 | 13F | Quadrature Capital Ltd | 0 | -100.00 | 0 | |||||
| 2025-08-06 | 13F | Atlantic Union Bankshares Corp | 56,223 | 1,389 | ||||||
| 2025-08-12 | 13F | Global Retirement Partners, LLC | 328 | 8 | ||||||
| 2025-08-27 | 13F/A | Brinker Capital Investments, LLC | 55,708 | 22.96 | 1,377 | 28.12 | ||||
| 2025-07-25 | 13F | Concurrent Investment Advisors, LLC | 228,560 | 19.19 | 5,648 | 24.16 | ||||
| 2025-08-08 | 13F | Creative Planning | 55,758 | 0.00 | 1,378 | 4.16 | ||||
| 2025-08-14 | 13F | Visionary Wealth Advisors | 8,480 | 210 | ||||||
| 2025-08-05 | 13F | Atlas Private Wealth Advisors | 903,006 | 69.69 | 22,313 | 76.78 | ||||
| 2025-08-15 | 13F | Equitable Holdings, Inc. | 56,320 | 26.49 | 1,392 | 31.72 | ||||
| 2025-08-14 | 13F | Garden State Investment Advisory Services LLC | 30,511 | -5.33 | 754 | -1.44 | ||||
| 2025-08-14 | 13F | Bank Of America Corp /de/ | 32,293 | -1.88 | 798 | 2.18 | ||||
| 2025-08-20 | 13F/A | Coppell Advisory Solutions LLC | 135,223 | 628.45 | 3,325 | 684.20 | ||||
| 2025-07-11 | 13F | SILVER OAK SECURITIES, Inc | 344,821 | 30.77 | 8,521 | 37.51 | ||||
| 2025-07-15 | 13F | BKA Wealth Consulting, Inc. | 65,345 | 17.44 | 1,615 | 22.37 | ||||
| 2025-07-16 | 13F | Independent Wealth Network Inc. | 17,254 | 2.01 | 426 | 6.23 | ||||
| 2025-08-08 | 13F | SBI Securities Co., Ltd. | 1,457 | -17.03 | 36 | -12.20 | ||||
| 2025-08-11 | 13F | HighTower Advisors, LLC | 282,398 | 0.77 | 6,978 | 4.98 | ||||
| 2025-08-14 | 13F | Jane Street Group, Llc | 17,163 | -84.51 | 424 | -83.87 | ||||
| 2025-08-08 | 13F | MTM Investment Management, LLC | 49,662 | 0.00 | 1,227 | 3.90 | ||||
| 2025-07-22 | 13F | Ergawealth Advisors, Inc. | 191,905 | -25.00 | 4,742 | -21.88 | ||||
| 2025-05-14 | 13F | Luminist Capital LLC | 0 | -100.00 | 0 | |||||
| 2025-08-08 | 13F | Good Life Advisors, LLC | 296,484 | 11.70 | 7,326 | 16.36 |