Mga Batayang Estadistika
| Pemilik Institusional | 171 total, 168 long only, 1 short only, 2 long/short - change of 4.91% MRQ |
| Alokasi Portofolio Rata-rata | 0.0510 % - change of -13.09% MRQ |
| Saham Institusional (Jangka Panjang) | 45,771,478 (ex 13D/G) - change of 7.03MM shares 18.15% MRQ |
| Nilai Institusional (Jangka Panjang) | $ 274,205 USD ($1000) |
Kepemilikan Institusional dan Pemegang Saham
Turkcell Iletisim Hizmetleri A.S. - Depositary Receipt (Common Stock) (US:TKC) memiliki 171 pemilik institusional dan pemegang saham yang telah mengajukan formulir 13D/G atau 13F kepada Komisi Bursa Efek (Securities Exchange Commission/SEC). Lembaga-lembaga ini memegang total 45,771,854 saham. Pemegang saham terbesar meliputi Morgan Stanley, Macquarie Group Ltd, DEMAX - Delaware Emerging Markets Fund Class A, BlackRock, Inc., Arrowstreet Capital, Limited Partnership, Marshall Wace, Llp, Goldman Sachs Group Inc, American Century Companies Inc, Two Sigma Investments, Lp, and Discovery Capital Management, Llc / Ct .
Struktur kepemilikan institusional Turkcell Iletisim Hizmetleri A.S. - Depositary Receipt (Common Stock) (NYSE:TKC) menunjukkan posisi terkini di perusahaan oleh institusi dan dana, serta perubahan terbaru dalam ukuran posisi. Pemegang saham utama dapat mencakup investor individu, reksa dana, dana lindung nilai, atau institusi. Jadwal 13D menunjukkan bahwa investor memegang (atau pernah memegang) lebih dari 5% saham perusahaan dan bermaksud (atau pernah bermaksud) untuk secara aktif mengejar perubahan strategi bisnis. Jadwal 13G menunjukkan investasi pasif lebih dari 5%.
The share price as of September 5, 2025 is 5.54 / share. Previously, on September 6, 2024, the share price was 7.00 / share. This represents a decline of 20.86% over that period.

Skor Sentimen Dana
Skor Sentimen Dana (sebelumnya dikenal sebagai Skor Akumulasi Kepemilikan) menemukan saham-saham yang paling banyak dibeli oleh dana. Ini adalah hasil dari model kuantitatif multi-faktor yang canggih yang mengidentifikasi perusahaan dengan tingkat akumulasi institusional tertinggi. Model penilaian menggunakan kombinasi dari total peningkatan pemilik yang diungkapkan, perubahan dalam alokasi portofolio pada pemilik tersebut, dan metrik lainnya. Angka berkisar dari 0 hingga 100, dengan angka yang lebih tinggi menunjukkan tingkat akumulasi yang lebih tinggi dibandingkan dengan perusahaan sejenisnya, dan 50 adalah rata-ratanya.
Frekuensi Pembaruan: Setiap Hari
Lihat Ownership Explorer, yang menyediakan daftar perusahaan dengan peringkat tertinggi.
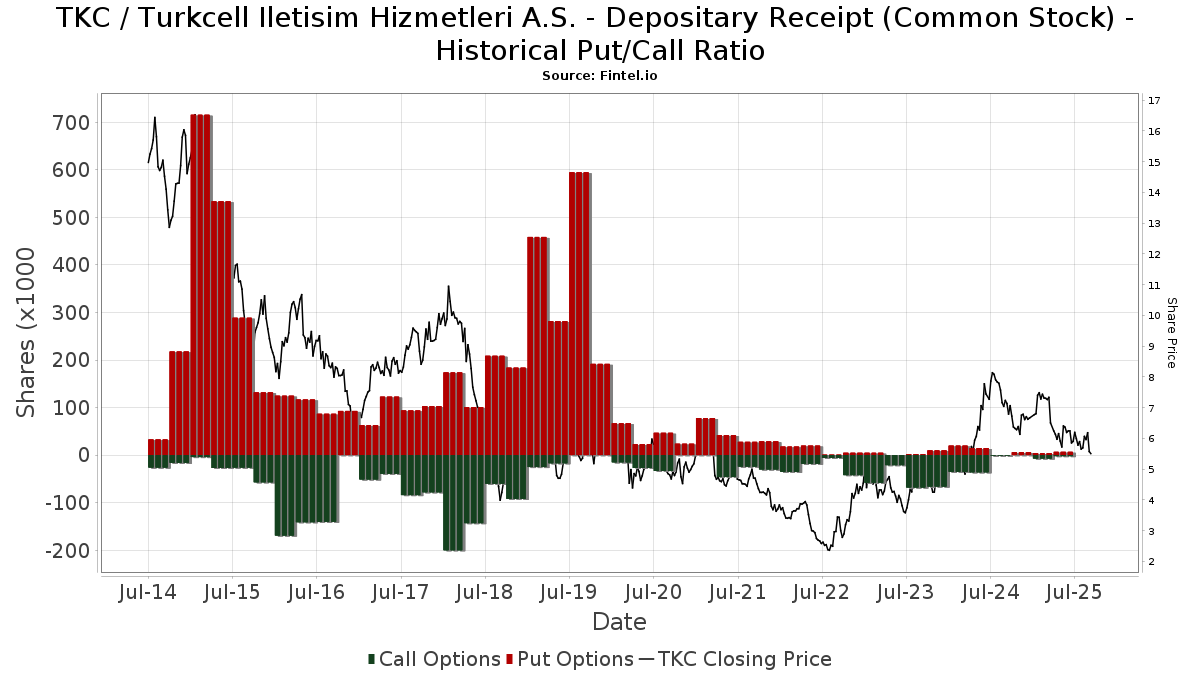
Rasio Put/Call Institusional
Selain melaporkan isu ekuitas dan utang standar, institusi dengan aset di bawah manajemen lebih dari 100 juta dolar AS juga harus mengungkapkan kepemilikan opsi put dan call mereka. Karena opsi put umumnya menunjukkan sentimen negatif, dan opsi call menunjukkan sentimen positif, kita dapat mengetahui sentimen institusional secara keseluruhan dengan memplot rasio put terhadap call. Grafik di sebelah kanan memplot rasio put/call historis untuk instrumen ini.
Menggunakan Rasio Put/Call sebagai indikator sentimen investor mengatasi salah satu kekurangan utama dari penggunaan total kepemilikan institusional, yaitu sejumlah besar aset yang dikelola diinvestasikan secara pasif untuk melacak indeks. Dana yang dikelola secara pasif biasanya tidak membeli opsi, sehingga indikator rasio put/call lebih akurat dalam melacak sentimen dana yang dikelola secara aktif.
Pengajuan 13F dan NPORT
Detail pada pengajuan 13F tersedia gratis. Detail pada pengajuan NP memerlukan keanggotaan premium. Baris berwarna hijau menunjukkan posisi baru. Baris berwarna merah menunjukkan posisi yang sudah ditutup. Klik tautan ini ikon untuk melihat riwayat transaksi selengkapnya.
Tingkatkan
untuk membuka data premium dan mengekspor ke Excel ![]() .
.
| Tanggal File | Sumber | Investor | Ketik | Presyo ng Avg (Silangan) |
Saham | Δ Saham (%) |
Dilaporkan Nilai ($1000) |
Nilai Δ (%) |
Alokasi Port (%) |
|
|---|---|---|---|---|---|---|---|---|---|---|
| 2025-08-11 | 13F | Frank, Rimerman Advisors LLC | 27,401 | 166 | ||||||
| 2025-07-28 | NP | AVES - Avantis Emerging Markets Value ETF This fund is a listed as child fund of American Century Companies Inc and if that institution has disclosed ownership in this security, then these positions will not be double counted when calculating total shares and total value | 108,676 | 120.69 | 661 | 98.20 | ||||
| 2025-08-08 | 13F | Creative Planning | 240,117 | -6.96 | 1,453 | -9.53 | ||||
| 2025-08-14 | 13F | Bank Of America Corp /de/ | 53,322 | -35.42 | 323 | -37.23 | ||||
| 2025-08-06 | 13F | Savant Capital, LLC | 15,843 | -34.38 | 96 | -36.67 | ||||
| 2025-08-12 | 13F | O'shaughnessy Asset Management, Llc | 675,177 | -7.91 | 4,085 | -10.44 | ||||
| 2025-08-14 | 13F | Wetherby Asset Management Inc | 88,252 | -7.78 | 534 | -14.31 | ||||
| 2025-05-14 | 13F | Walleye Capital LLC | 0 | -100.00 | 0 | |||||
| 2025-08-14 | 13F | Millennium Management Llc | 819,710 | 153.29 | 4,959 | 146.47 | ||||
| 2025-08-14 | 13F | UBS Group AG | 10,524 | -42.02 | 64 | -43.75 | ||||
| 2025-08-28 | NP | NDOW - Anydrus Advantage ETF | 6,935 | 42 | ||||||
| 2025-05-08 | NP | QGBLX - Quantified Global Fund Investor Class | 24,880 | 155 | ||||||
| 2025-05-15 | 13F | CAPROCK Group, Inc. | 84,668 | -0.56 | 527 | -5.05 | ||||
| 2025-08-13 | 13F | Jones Financial Companies Lllp | 0 | -100.00 | 0 | |||||
| 2025-08-14 | 13F/A | Barclays Plc | 60,108 | 0.00 | 0 | |||||
| 2025-08-14 | 13F | Verition Fund Management LLC | 80,689 | 488 | ||||||
| 2025-08-14 | 13F | Vident Advisory, LLC | 334,622 | 1.91 | 2,024 | -0.88 | ||||
| 2025-08-12 | 13F | Coldstream Capital Management Inc | 0 | -100.00 | 0 | |||||
| 2025-08-14 | 13F | Smartleaf Asset Management LLC | 0 | -100.00 | 0 | |||||
| 2025-08-12 | 13F | Atlas Capital Advisors Llc | 546 | -98.86 | 3 | -98.99 | ||||
| 2025-08-14 | 13F | Aprio Wealth Management, LLC | 14,379 | -38.30 | 87 | -40.28 | ||||
| 2025-08-12 | 13F | CIBC Private Wealth Group, LLC | 8,166 | 4.03 | 49 | 8.89 | ||||
| 2025-08-12 | 13F | Global Retirement Partners, LLC | 418 | -20.08 | 3 | -33.33 | ||||
| 2025-05-12 | 13F | Simplex Trading, Llc | 0 | -100.00 | 0 | |||||
| 2025-08-13 | 13F | Renaissance Technologies Llc | 364,900 | 2,208 | ||||||
| 2025-08-14 | 13F | TCG Advisory Services, LLC | 0 | -100.00 | 0 | |||||
| 2025-08-11 | 13F | Integrated Quantitative Investments LLC | 72,057 | 436 | ||||||
| 2025-05-05 | 13F | Lindbrook Capital, Llc | 10,384 | 4.88 | 65 | 0.00 | ||||
| 2025-08-07 | 13F | Vise Technologies, Inc. | 500,209 | 26.42 | 3,026 | 17.51 | ||||
| 2025-07-25 | 13F | Cwm, Llc | 12,322 | -6.93 | 0 | |||||
| 2025-08-04 | 13F | Assetmark, Inc | 61 | -79.67 | 0 | -100.00 | ||||
| 2025-07-24 | 13F | IFP Advisors, Inc | 120 | 0.00 | 1 | |||||
| 2025-08-14 | 13F | Citadel Advisors Llc | 157,003 | 2.87 | 950 | 0.00 | ||||
| 2025-08-12 | 13F | Pathstone Holdings, LLC | 95,837 | 2.21 | 581 | -0.51 | ||||
| 2025-08-11 | 13F | Bell Investment Advisors, Inc | 988 | 0.00 | 6 | -16.67 | ||||
| 2025-08-14 | 13F | Glenmede Investment Management, LP | 11,761 | 71 | ||||||
| 2025-08-14 | 13F | Group One Trading, L.p. | Put | 2,900 | 18 | |||||
| 2025-08-14 | 13F | Group One Trading, L.p. | Call | 2,600 | 23.81 | 16 | 15.38 | |||
| 2025-07-21 | 13F | Credential Qtrade Securities Inc. | 0 | -100.00 | 0 | |||||
| 2025-08-13 | 13F | Gabelli Funds Llc | 405,500 | -0.12 | 2,453 | -2.85 | ||||
| 2025-08-14 | 13F | Syon Capital Llc | 15,795 | 96 | ||||||
| 2025-08-12 | 13F | American Century Companies Inc | 1,049,023 | 24.39 | 6,347 | 20.99 | ||||
| 2025-07-28 | NP | AVEEX - Avantis Emerging Markets Equity Fund Institutional Class This fund is a listed as child fund of American Century Companies Inc and if that institution has disclosed ownership in this security, then these positions will not be double counted when calculating total shares and total value | 43,376 | 8.59 | 264 | -2.59 | ||||
| 2025-08-13 | 13F | Hsbc Holdings Plc | 29,556 | -52.26 | 179 | -54.12 | ||||
| 2025-09-02 | 13F | Investors Towarzystwo Funduszy Inwestycyjnych Spolka Akcyjna | 0 | -100.00 | 0 | -100.00 | ||||
| 2025-08-07 | 13F | Parkside Financial Bank & Trust | 398 | -62.91 | 2 | -66.67 | ||||
| 2025-05-12 | 13F | Peapack Gladstone Financial Corp | 0 | -100.00 | 0 | |||||
| 2025-08-08 | 13F | KBC Group NV | 35,111 | 0.00 | 0 | |||||
| 2025-08-05 | 13F | Simplex Trading, Llc | Put | 4,400 | 10.00 | 0 | ||||
| 2025-08-11 | 13F | Pinnacle Wealth Planning Services, Inc. | 13,467 | -21.54 | 81 | -23.58 | ||||
| 2025-08-05 | 13F | Simplex Trading, Llc | Call | 100 | 0 | |||||
| 2025-08-12 | 13F | Proequities, Inc. | Put | 0 | 0 | |||||
| 2025-08-12 | 13F | Proequities, Inc. | Call | 0 | 0 | |||||
| 2025-08-12 | 13F | Proequities, Inc. | 0 | 0 | ||||||
| 2025-07-25 | 13F | JustInvest LLC | 129,670 | 1.52 | 785 | -1.26 | ||||
| 2025-07-17 | 13F | HB Wealth Management, LLC | 10,992 | 67 | ||||||
| 2025-07-14 | 13F | Abound Wealth Management | 78 | 11.43 | 0 | |||||
| 2025-08-12 | 13F | MAI Capital Management | 8,807 | 53 | ||||||
| 2025-08-29 | NP | Gabelli Multimedia Trust Inc. | 30,000 | 0.00 | 182 | -2.69 | ||||
| 2025-08-12 | 13F | Legal & General Group Plc | 10,317 | 0.00 | 62 | -3.12 | ||||
| 2025-08-14 | 13F | Royal Bank Of Canada | 20,104 | 3,477.22 | 122 | 2,950.00 | ||||
| 2025-08-11 | 13F | Lsv Asset Management | 102,400 | 0.00 | 1 | |||||
| 2025-08-04 | 13F | Hantz Financial Services, Inc. | 2,292 | 1,046.00 | 0 | |||||
| 2025-08-13 | 13F | Arrowstreet Capital, Limited Partnership | 2,601,742 | 37.70 | 15,741 | 33.93 | ||||
| 2025-08-14 | 13F | Modern Wealth Management, LLC | 20,726 | -43.85 | 125 | -45.41 | ||||
| 2025-08-12 | 13F | XTX Topco Ltd | 145,416 | 880 | ||||||
| 2025-07-25 | 13F | Sequoia Financial Advisors, LLC | 70,326 | 27.94 | 425 | 24.63 | ||||
| 2025-08-27 | NP | TIFF INVESTMENT PROGRAM - TIFF Multi-Asset Fund | Short | -376 | -2 | |||||
| 2025-07-28 | NP | AVEM - Avantis Emerging Markets Equity ETF This fund is a listed as child fund of American Century Companies Inc and if that institution has disclosed ownership in this security, then these positions will not be double counted when calculating total shares and total value | 845,998 | 20.84 | 5,144 | 8.36 | ||||
| 2025-08-29 | NP | Gabelli Global Utility & Income Trust | 28,000 | 0.00 | 169 | -2.87 | ||||
| 2025-08-14 | 13F | Discovery Capital Management, Llc / Ct | 898,131 | -9.74 | 5,434 | -12.22 | ||||
| 2025-07-14 | 13F | GAMMA Investing LLC | 16,397 | 9.31 | 99 | 6.45 | ||||
| 2025-08-29 | NP | Gabelli Utility Trust | 60,000 | 0.00 | 363 | -2.68 | ||||
| 2025-04-30 | 13F | Nisa Investment Advisors, Llc | 0 | -100.00 | 0 | |||||
| 2025-08-14 | 13F | Mercer Global Advisors Inc /adv | 16,780 | -16.48 | 102 | -18.55 | ||||
| 2025-08-15 | 13F | CI Private Wealth, LLC | 192,180 | 80.74 | 1,163 | 75.79 | ||||
| 2025-08-12 | 13F | Virtu Financial LLC | 58,945 | 0 | ||||||
| 2025-07-28 | NP | AVSE - Avantis Responsible Emerging Markets Equity ETF | 8,438 | 13.23 | 51 | 2.00 | ||||
| 2025-07-14 | 13F | AdvisorNet Financial, Inc | 52 | 0.00 | 0 | |||||
| 2025-08-14 | 13F | Macquarie Group Ltd | 4,674,902 | 0.00 | 28,283 | -2.73 | ||||
| 2025-09-04 | 13F/A | Advisor Group Holdings, Inc. | 1,113 | -3.13 | 7 | -14.29 | ||||
| 2025-07-24 | 13F | PDS Planning, Inc | 34,924 | 2.95 | 211 | 0.00 | ||||
| 2025-08-12 | 13F | Jpmorgan Chase & Co | 7,829 | 102.51 | 47 | 95.83 | ||||
| 2025-08-11 | 13F | Inspire Advisors, LLC | 20,062 | 4.72 | 121 | 1.68 | ||||
| 2025-08-05 | 13F | Advisors Preferred, LLC | 0 | -100.00 | 0 | |||||
| 2025-08-14 | 13F | Aqr Capital Management Llc | 304,118 | -11.26 | 1,825 | -14.08 | ||||
| 2025-08-15 | 13F | Tower Research Capital LLC (TRC) | 427 | 3 | ||||||
| 2025-08-01 | 13F | Bessemer Group Inc | 46,920 | 0.86 | 0 | |||||
| 2025-08-14 | 13F | Jane Street Group, Llc | 0 | -100.00 | 0 | |||||
| 2025-08-13 | 13F | Twin Peaks Wealth Advisors, LLC | 90 | 1 | ||||||
| 2025-07-25 | 13F | Yousif Capital Management, Llc | 15,522 | 14.28 | 94 | 10.71 | ||||
| 2025-07-28 | NP | AVXC - Avantis Emerging Markets ex-China Equity ETF | 11,387 | 37.49 | 69 | 23.21 | ||||
| 2025-08-13 | 13F | CLARET ASSET MANAGEMENT Corp | 28,430 | 0.00 | 0 | |||||
| 2025-08-05 | 13F | NewSquare Capital LLC | 45 | -70.00 | 0 | |||||
| 2025-08-14 | 13F | Quantinno Capital Management LP | 161,838 | 82.65 | 979 | 77.68 | ||||
| 2025-05-06 | 13F | Venturi Wealth Management, LLC | 0 | -100.00 | 0 | |||||
| 2025-07-09 | 13F | Sivia Capital Partners, LLC | 15,347 | -19.63 | 93 | -22.03 | ||||
| 2025-07-21 | 13F | HighMark Wealth Management LLC | 310 | 0.00 | 2 | 0.00 | ||||
| 2025-07-30 | 13F | Cullen/frost Bankers, Inc. | 0 | -100.00 | 0 | |||||
| 2025-08-13 | 13F | Cerity Partners LLC | 176,080 | -11.47 | 1,066 | -13.82 | ||||
| 2025-08-12 | 13F | BlackRock, Inc. | 4,038,714 | 6.23 | 24,434 | 3.32 | ||||
| 2025-08-13 | 13F/A | StoneX Group Inc. | 0 | -100.00 | 0 | -100.00 | ||||
| 2025-08-12 | 13F | Discerene Group LP | 199,788 | 0.00 | 1,209 | -2.74 | ||||
| 2025-04-21 | 13F | Nelson, Van Denburg & Campbell Wealth Management Group, LLC | 0 | -100.00 | 0 | |||||
| 2025-08-08 | 13F | Larson Financial Group LLC | 50 | 0 | ||||||
| 2025-08-14 | 13F | Qube Research & Technologies Ltd | 543,971 | 72.71 | 3,291 | 67.99 | ||||
| 2025-08-12 | 13F | SRS Capital Advisors, Inc. | 1,239 | 7 | ||||||
| 2025-08-08 | 13F | D'Orazio & Associates, Inc. | 14,587 | -10.79 | 88 | -12.87 | ||||
| 2025-08-14 | 13F | Point72 Asset Management, L.P. | 197,500 | 185.82 | 1,195 | 178.32 | ||||
| 2025-08-12 | 13F | Segall Bryant & Hamill, Llc | 0 | -100.00 | 0 | |||||
| 2025-05-15 | 13F | WPG Advisers, LLC | 0 | -100.00 | 0 | |||||
| 2025-07-24 | 13F | Us Bancorp \de\ | 41,707 | 14.72 | 252 | 11.50 | ||||
| 2025-08-12 | 13F | Wayfinding Financial, LLC | 0 | -100.00 | 0 | |||||
| 2025-08-14 | 13F | Wells Fargo & Company/mn | 74 | -99.85 | 0 | -100.00 | ||||
| 2025-07-15 | 13F | Colonial River Wealth Management, LLC | 15,090 | 0.00 | 88 | -5.38 | ||||
| 2025-07-28 | NP | NSI - National Security Emerging Markets Index ETF | 5,723 | 38.47 | 35 | 21.43 | ||||
| 2025-08-14 | 13F | Raymond James Financial Inc | 756 | 5 | ||||||
| 2025-08-13 | 13F | West Family Investments, Inc. | 38,446 | 55.04 | 233 | 50.65 | ||||
| 2025-07-11 | 13F | BTC Capital Management, Inc. | 0 | -100.00 | 0 | |||||
| 2025-08-14 | 13F | Balyasny Asset Management Llc | 36,773 | 222 | ||||||
| 2025-05-27 | NP | RMEAX - Aspiriant Risk-Managed Equity Allocation Fund Advisor Shares | 40,219 | 0.00 | 250 | -4.21 | ||||
| 2025-08-11 | 13F | Principal Securities, Inc. | 167 | 65.35 | 1 | |||||
| 2025-07-16 | 13F | Signaturefd, Llc | 43,298 | -4.42 | 262 | -7.12 | ||||
| 2025-08-14 | 13F | Citadel Advisors Llc | Call | 0 | -100.00 | 0 | ||||
| 2025-07-28 | 13F | BRYN MAWR TRUST Co | 0 | -100.00 | 0 | |||||
| 2025-08-07 | 13F | Connor, Clark & Lunn Investment Management Ltd. | 45,955 | -17.41 | 278 | -19.65 | ||||
| 2025-08-13 | 13F | EverSource Wealth Advisors, LLC | 22,358 | 51.76 | 135 | 48.35 | ||||
| 2025-08-14 | 13F | Citadel Advisors Llc | Put | 0 | -100.00 | 0 | ||||
| 2025-08-15 | 13F | Morgan Stanley | 10,634,501 | 1.10 | 64,339 | -1.66 | ||||
| 2025-08-08 | 13F | JBF Capital, Inc. | 15,000 | 0.00 | 91 | -3.23 | ||||
| 2025-08-14 | 13F | Two Sigma Securities, Llc | 25,886 | 157 | ||||||
| 2025-07-14 | 13F | Foster Group, Inc. | 11,053 | 67 | ||||||
| 2025-08-29 | NP | MPLAX - Praxis International Index Fund Class A | 161,575 | 147.88 | 978 | 141.23 | ||||
| 2025-08-28 | NP | KOMP - SPDR S&P Kensho New Economies Composite ETF This fund is a listed as child fund of State Street Corp and if that institution has disclosed ownership in this security, then these positions will not be double counted when calculating total shares and total value | 707,146 | 4,278 | ||||||
| 2025-08-13 | 13F | Quadrant Capital Group Llc | 82,000 | -8.75 | 496 | -11.11 | ||||
| 2025-07-28 | NP | MAKX - ProShares S&P Kensho Smart Factories ETF | 5,848 | -8.61 | 36 | -18.60 | ||||
| 2025-07-15 | 13F | Ballentine Partners, LLC | 72,883 | -0.51 | 441 | -3.30 | ||||
| 2025-07-21 | 13F | Ascent Group, LLC | 18,160 | -6.48 | 110 | -9.17 | ||||
| 2025-08-07 | 13F | Sierra Ocean, Llc | 1,393 | 6.42 | 8 | 0.00 | ||||
| 2025-08-13 | 13F | Marshall Wace, Llp | 2,595,560 | 284.94 | 15,703 | 274.42 | ||||
| 2025-08-14 | 13F | Cubist Systematic Strategies, LLC | 88,031 | 10.96 | 533 | 7.91 | ||||
| 2025-07-30 | NP | APIE - ActivePassive International Equity ETF | 35,052 | 767.41 | 213 | 688.89 | ||||
| 2025-05-09 | 13F | GeoWealth Management, LLC | 0 | -100.00 | 0 | |||||
| 2025-07-28 | 13F | Axxcess Wealth Management, Llc | 15,090 | 0.00 | 91 | -2.15 | ||||
| 2025-08-14 | 13F | Fmr Llc | 113,168 | 40.72 | 685 | 36.80 | ||||
| 2025-05-12 | 13F | National Bank Of Canada /fi/ | 0 | -100.00 | 0 | |||||
| 2025-05-15 | 13F | Glenmede Trust Co Na | 11,819 | -17.52 | 74 | -21.51 | ||||
| 2025-08-13 | 13F | First Trust Advisors Lp | 56,920 | -16.07 | 344 | -18.29 | ||||
| 2025-08-07 | 13F | Acadian Asset Management Llc | 122,395 | -32.68 | 1 | -100.00 | ||||
| 2025-07-15 | 13F | Maseco Llp | 272 | 2 | ||||||
| 2025-08-06 | 13F | Valued Wealth Advisors LLC | 689 | 0.00 | 4 | 0.00 | ||||
| 2025-08-14 | 13F | Bnp Paribas Arbitrage, Sa | 466,398 | -16.65 | 2,822 | -18.94 | ||||
| 2025-08-14 | 13F | Stifel Financial Corp | 222,084 | -18.71 | 1,344 | -20.95 | ||||
| 2025-08-14 | 13F | State Street Corp | 776,151 | 732.82 | 4,771 | 724.01 | ||||
| 2025-08-12 | 13F | Franklin Resources Inc | 0 | -100.00 | 0 | |||||
| 2025-05-01 | 13F | Schechter Investment Advisors, LLC | 14,735 | -23.96 | 92 | -27.78 | ||||
| 2025-08-29 | NP | GAUAX - The Gabelli Utilities Fund Class A | 267,500 | -0.19 | 1,618 | -2.88 | ||||
| 2025-07-24 | 13F | Jfs Wealth Advisors, Llc | 925 | 0.00 | 6 | 0.00 | ||||
| 2025-08-14 | 13F | Two Sigma Advisers, Lp | 378,400 | 933.88 | 2,289 | 908.37 | ||||
| 2025-08-12 | 13F | Rhumbline Advisers | 88,781 | -39.41 | 537 | -41.05 | ||||
| 2025-08-14 | 13F | Goldman Sachs Group Inc | 1,694,970 | 82.63 | 10,255 | 77.65 | ||||
| 2025-08-07 | 13F | Allworth Financial LP | 1,455 | 31.67 | 9 | 33.33 | ||||
| 2025-08-14 | 13F | Barometer Capital Management Inc. | 67,016 | 29.33 | 405 | 25.78 | ||||
| 2025-08-07 | 13F | Mitsubishi UFJ Kokusai Asset Management Co., Ltd. | 27,243 | 67.45 | 165 | 62.38 | ||||
| 2025-07-28 | 13F | Harbour Investments, Inc. | 234 | 0.00 | 1 | 0.00 | ||||
| 2025-07-18 | 13F | Warren Street Wealth Advisors, LLC | 17,381 | 6.86 | 105 | 3.96 | ||||
| 2025-07-25 | 13F | Verdence Capital Advisors LLC | 10,903 | 2.59 | 66 | -1.52 | ||||
| 2025-08-15 | 13F | WealthCollab, LLC | 3,758 | 0.00 | 23 | -4.35 | ||||
| 2025-07-25 | 13F | RHS Financial, LLC | 24,224 | -5.61 | 147 | -8.18 | ||||
| 2025-07-17 | 13F | Greenleaf Trust | 0 | -100.00 | 0 | |||||
| 2025-03-26 | NP | TDVI - FT Vest Technology Dividend Target Income ETF | 1,272 | 27.07 | 9 | 50.00 | ||||
| 2025-05-22 | NP | TDIV - First Trust NASDAQ Technology Dividend Index Fund This fund is a listed as child fund of First Trust Advisors Lp and if that institution has disclosed ownership in this security, then these positions will not be double counted when calculating total shares and total value | 0 | -100.00 | 0 | -100.00 | ||||
| 2025-08-11 | 13F | United Capital Financial Advisers, Llc | 14,499 | -5.98 | 88 | -8.42 | ||||
| 2025-08-14 | 13F | Evergreen Capital Management Llc | 23,271 | 143 | ||||||
| 2025-08-11 | 13F | Brown Brothers Harriman & Co | 336 | 66.34 | 2 | -33.33 | ||||
| 2025-08-13 | 13F | Guggenheim Capital Llc | 112,096 | 13.83 | 678 | 10.78 | ||||
| 2025-07-25 | NP | DEMAX - Delaware Emerging Markets Fund Class A | 4,449,485 | 0.00 | 27,053 | -10.33 | ||||
| 2025-08-14 | 13F | Atomi Financial Group, Inc. | 29,194 | -2.36 | 177 | -4.86 | ||||
| 2025-08-28 | NP | GHTA - Goose Hollow Tactical Allocation ETF | 30,000 | 182 | ||||||
| 2025-08-08 | 13F | Pnc Financial Services Group, Inc. | 88,492 | 33.86 | 535 | 30.17 | ||||
| 2025-08-12 | 13F | Dimensional Fund Advisors Lp | 38,730 | 7.90 | 234 | 4.93 | ||||
| 2025-08-14 | 13F/A | Skopos Labs, Inc. | 8,066 | 806.29 | 49 | 860.00 | ||||
| 2025-07-24 | 13F | Ronald Blue Trust, Inc. | 15,561 | -9.21 | 94 | -11.32 | ||||
| 2025-05-15 | 13F | Aquatic Capital Management LLC | 0 | -100.00 | 0 | |||||
| 2025-04-14 | 13F | Clean Yield Group | 0 | -100.00 | 0 | |||||
| 2025-07-08 | 13F | Parallel Advisors, LLC | 29,385 | 7.86 | 178 | 4.73 | ||||
| 2025-08-26 | NP | SBHEX - Segall Bryant & Hamill Emerging Markets Fund Retail Class | 11,000 | 0.00 | 67 | -2.94 | ||||
| 2025-07-14 | 13F | UMA Financial Services, Inc. | 221 | -64.98 | 1 | -66.67 | ||||
| 2025-08-13 | 13F | Townsquare Capital Llc | 0 | -100.00 | 0 | |||||
| 2025-06-26 | 13F/A | Deutsche Bank Ag\ | 0 | -100.00 | 0 | |||||
| 2025-07-16 | 13F | Kathmere Capital Management, LLC | 22,401 | -5.48 | 136 | -8.16 | ||||
| 2025-07-21 | 13F | Qrg Capital Management, Inc. | 22,586 | -6.90 | 137 | -9.33 | ||||
| 2025-07-28 | 13F | Ritholtz Wealth Management | 334,599 | -5.31 | 2,024 | -7.87 | ||||
| 2025-08-06 | 13F | Fox Run Management, L.l.c. | 0 | -100.00 | 0 | |||||
| 2025-08-14 | 13F | Two Sigma Investments, Lp | 966,517 | 1,142.52 | 5,847 | 1,110.56 | ||||
| 2025-08-08 | 13F | SBI Securities Co., Ltd. | 3,533 | 4.56 | 21 | 0.00 | ||||
| 2025-07-15 | 13F | Public Employees Retirement System Of Ohio | 1,447 | -29.76 | 9 | -33.33 | ||||
| 2025-08-06 | 13F | True Wealth Design, LLC | 133 | -2.21 | 1 | |||||
| 2025-08-29 | NP | GCAEX - The Gabelli Equity Income Fund Class A | 20,000 | 0.00 | 121 | -2.42 | ||||
| 2025-08-13 | 13F | Northern Trust Corp | 297,940 | 1.29 | 1,803 | -1.48 | ||||
| 2025-08-14 | 13F | Mariner, LLC | 83,651 | -6.12 | 506 | -8.84 | ||||
| 2025-05-05 | 13F | Transce3nd, LLC | 0 | -100.00 | 0 | |||||
| 2025-07-21 | 13F | Credential Securities Inc. | 207 | 0.00 | 1 | 0.00 | ||||
| 2025-07-30 | 13F | Ethic Inc. | 74,871 | -2.87 | 425 | -12.22 | ||||
| 2025-08-11 | 13F | TD Waterhouse Canada Inc. | 4,000 | 0.00 | 25 | -4.00 | ||||
| 2025-07-11 | 13F | Farther Finance Advisors, LLC | 2,795 | 302.74 | 17 | 300.00 | ||||
| 2025-08-14 | 13F | Ieq Capital, Llc | 41,181 | 189.90 | 249 | 182.95 | ||||
| 2025-08-11 | 13F | Citigroup Inc | 287,120 | 8.25 | 1,737 | 5.34 | ||||
| 2025-07-29 | NP | RBB FUND, INC. - Aquarius International Fund | 28,289 | 36.12 | 172 | 22.14 | ||||
| 2025-05-14 | 13F | Boston Private Wealth Llc | 0 | -100.00 | 0 | |||||
| 2025-08-07 | 13F | Hennion & Walsh Asset Management, Inc. | 0 | -100.00 | 0 | |||||
| 2025-08-13 | 13F | Quadrature Capital Ltd | 61,346 | 415.51 | 371 | 437.68 |