Mga Batayang Estadistika
| Pemilik Institusional | 169 total, 166 long only, 0 short only, 3 long/short - change of 27.07% MRQ |
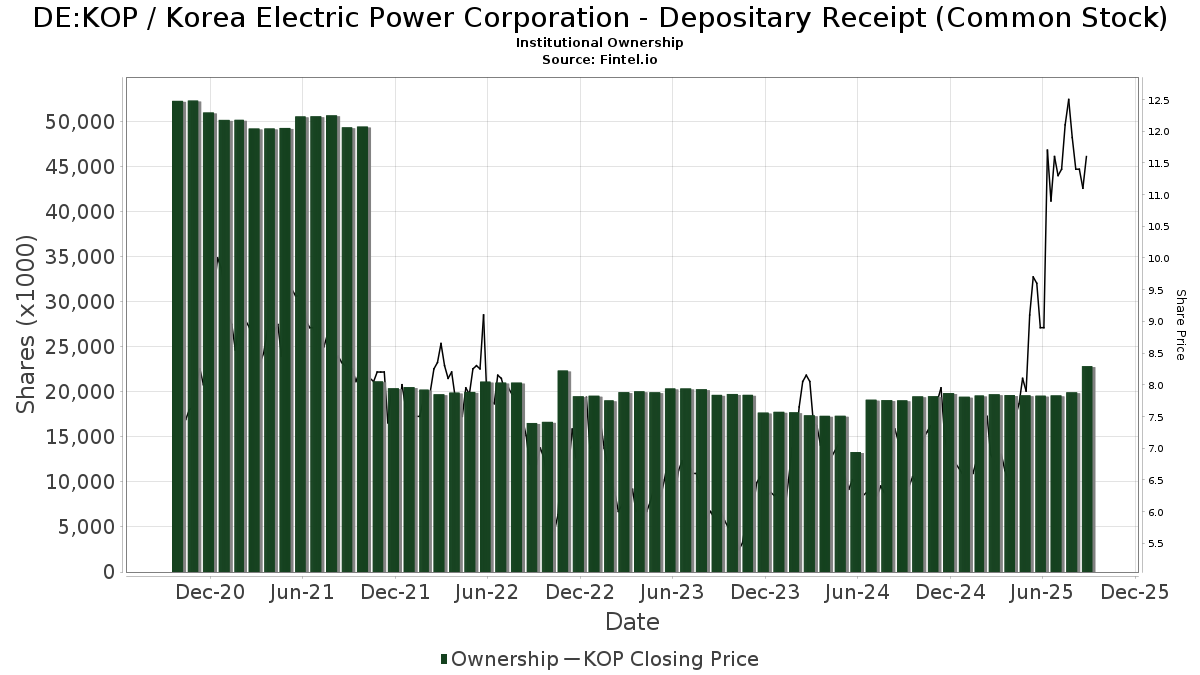
| Harga Saham | 11.20 |
| Alokasi Portofolio Rata-rata | 0.0779 % - change of 165.37% MRQ |
| Saham Institusional (Jangka Panjang) | 22,843,705 (ex 13D/G) - change of 3.25MM shares 16.61% MRQ |
| Nilai Institusional (Jangka Panjang) | $ 317,461 USD ($1000) |
Kepemilikan Institusional dan Pemegang Saham
Korea Electric Power Corporation - Depositary Receipt (Common Stock) (DE:KOP) memiliki 169 pemilik institusional dan pemegang saham yang telah mengajukan formulir 13D/G atau 13F kepada Komisi Bursa Efek (Securities Exchange Commission/SEC). Lembaga-lembaga ini memegang total 22,843,705 saham. Pemegang saham terbesar meliputi Morgan Stanley, Vanguard Group Inc, Causeway Capital Management Llc, Arrowstreet Capital, Limited Partnership, BlackRock, Inc., VGTSX - Vanguard Total International Stock Index Fund Investor Shares, Goldman Sachs Group Inc, Northern Trust Corp, State Street Corp, and SPDW - SPDR(R) Portfolio Developed World ex-US ETF .
Struktur kepemilikan institusional Korea Electric Power Corporation - Depositary Receipt (Common Stock) (DB:KOP) menunjukkan posisi terkini di perusahaan oleh institusi dan dana, serta perubahan terbaru dalam ukuran posisi. Pemegang saham utama dapat mencakup investor individu, reksa dana, dana lindung nilai, atau institusi. Jadwal 13D menunjukkan bahwa investor memegang (atau pernah memegang) lebih dari 5% saham perusahaan dan bermaksud (atau pernah bermaksud) untuk secara aktif mengejar perubahan strategi bisnis. Jadwal 13G menunjukkan investasi pasif lebih dari 5%.
The share price as of September 5, 2025 is 11.20 / share. Previously, on September 9, 2024, the share price was 7.00 / share. This represents an increase of 60.00% over that period.
Skor Sentimen Dana
Skor Sentimen Dana (sebelumnya dikenal sebagai Skor Akumulasi Kepemilikan) menemukan saham-saham yang paling banyak dibeli oleh dana. Ini adalah hasil dari model kuantitatif multi-faktor yang canggih yang mengidentifikasi perusahaan dengan tingkat akumulasi institusional tertinggi. Model penilaian menggunakan kombinasi dari total peningkatan pemilik yang diungkapkan, perubahan dalam alokasi portofolio pada pemilik tersebut, dan metrik lainnya. Angka berkisar dari 0 hingga 100, dengan angka yang lebih tinggi menunjukkan tingkat akumulasi yang lebih tinggi dibandingkan dengan perusahaan sejenisnya, dan 50 adalah rata-ratanya.
Frekuensi Pembaruan: Setiap Hari
Lihat Ownership Explorer, yang menyediakan daftar perusahaan dengan peringkat tertinggi.
Pengajuan 13F dan NPORT
Detail pada pengajuan 13F tersedia gratis. Detail pada pengajuan NP memerlukan keanggotaan premium. Baris berwarna hijau menunjukkan posisi baru. Baris berwarna merah menunjukkan posisi yang sudah ditutup. Klik tautan ini ikon untuk melihat riwayat transaksi selengkapnya.
Tingkatkan
untuk membuka data premium dan mengekspor ke Excel ![]() .
.
| Tanggal File | Sumber | Investor | Ketik | Presyo ng Avg (Silangan) |
Saham | Δ Saham (%) |
Dilaporkan Nilai ($1000) |
Nilai Δ (%) |
Alokasi Port (%) |
|
|---|---|---|---|---|---|---|---|---|---|---|
| 2025-05-14 | 13F | Trexquant Investment LP | 0 | -100.00 | 0 | |||||
| 2025-08-14 | 13F | Citadel Advisors Llc | Put | 0 | -100.00 | 0 | ||||
| 2025-08-12 | 13F | Global Retirement Partners, LLC | 0 | -100.00 | 0 | |||||
| 2025-08-13 | 13F | Causeway Capital Management Llc | 1,220,320 | 17,194 | ||||||
| 2025-08-11 | 13F | Citigroup Inc | 29,008 | 15.96 | 413 | 123.24 | ||||
| 2025-08-12 | 13F | LPL Financial LLC | 18,109 | 258 | ||||||
| 2025-08-14 | 13F | Raymond James Financial Inc | 44,719 | 637 | ||||||
| 2025-08-15 | 13F | Tower Research Capital LLC (TRC) | 0 | -100.00 | 0 | |||||
| 2025-09-04 | 13F/A | Advisor Group Holdings, Inc. | 3,447 | 1,144.40 | 49 | 2,350.00 | ||||
| 2025-08-12 | 13F | American Century Companies Inc | 530,743 | 19.79 | 7,558 | 130.19 | ||||
| 2025-08-14 | 13F | Two Sigma Investments, Lp | 20,774 | 296 | ||||||
| 2025-08-05 | 13F | NewSquare Capital LLC | 456 | 99.13 | 6 | 500.00 | ||||
| 2025-05-15 | 13F | Centiva Capital, LP | 0 | -100.00 | 0 | -100.00 | ||||
| 2025-08-14 | 13F | Hrt Financial Lp | 63,654 | 1 | ||||||
| 2025-05-15 | 13F | Rise Advisors, LLC | 0 | -100.00 | 0 | |||||
| 2025-08-12 | 13F | Coldstream Capital Management Inc | 12,105 | 21.39 | 172 | 135.62 | ||||
| 2025-08-08 | 13F | Cetera Investment Advisers | 20,162 | -4.54 | 287 | 83.97 | ||||
| 2025-07-11 | 13F | Farther Finance Advisors, LLC | 1,559 | 4.63 | 22 | 120.00 | ||||
| 2025-07-31 | 13F | Nisa Investment Advisors, Llc | 1,500 | 0.00 | 21 | 90.91 | ||||
| 2025-08-08 | 13F/A | Sterling Capital Management LLC | 18,861 | 269 | ||||||
| 2025-08-14 | 13F | Quantinno Capital Management LP | 259,649 | 90.32 | 3,697 | 266.04 | ||||
| 2025-08-13 | 13F | Bare Financial Services, Inc | 551 | 166.18 | 8 | 600.00 | ||||
| 2025-07-21 | 13F | HighMark Wealth Management LLC | 100 | 0.00 | 1 | |||||
| 2025-08-14 | 13F | Diversify Advisory Services, LLC | 25,540 | 360 | ||||||
| 2025-08-04 | 13F | Spire Wealth Management | 187 | 0.00 | 3 | 100.00 | ||||
| 2025-08-08 | 13F | Pnc Financial Services Group, Inc. | 60,668 | 23.46 | 864 | 137.09 | ||||
| 2025-07-18 | 13F | Generali Investments CEE, investicni spolecnost, a.s. | 48,200 | 0.00 | 686 | 92.16 | ||||
| 2025-08-01 | 13F | Envestnet Asset Management Inc | 189,490 | 2,698 | ||||||
| 2025-07-09 | 13F | Sivia Capital Partners, LLC | 16,222 | -9.24 | 231 | 75.00 | ||||
| 2025-07-31 | 13F | Oppenheimer Asset Management Inc. | 49,353 | 703 | ||||||
| 2025-08-28 | NP | IDVO - Amplify International Enhanced Dividend Income ETF | 202,308 | 2,881 | ||||||
| 2025-08-14 | 13F | Bnp Paribas Arbitrage, Sa | 13,274 | -39.82 | 189 | 15.95 | ||||
| 2025-08-13 | 13F | Arrowstreet Capital, Limited Partnership | 1,201,548 | 22.02 | 17,110 | 134.51 | ||||
| 2025-08-29 | NP | Gabelli Dividend & Income Trust | 115,000 | 0.00 | 1,638 | 92.14 | ||||
| 2025-06-18 | NP | RMYAX - Multi-Strategy Income Fund Class A | 3,098 | -35.97 | 28 | -20.00 | ||||
| 2025-08-05 | 13F | Key FInancial Inc | 580 | 0.00 | 8 | 100.00 | ||||
| 2025-05-05 | 13F | Private Advisor Group, LLC | 0 | -100.00 | 0 | |||||
| 2025-07-25 | 13F | Yousif Capital Management, Llc | 23,954 | 21.32 | 341 | 133.56 | ||||
| 2025-08-14 | 13F | Royal Bank Of Canada | 50,387 | 1,579.57 | 717 | 3,159.09 | ||||
| 2025-07-25 | 13F | Sequoia Financial Advisors, LLC | 64,355 | 6.01 | 916 | 104.01 | ||||
| 2025-08-12 | 13F | Dimensional Fund Advisors Lp | 678,329 | 4.92 | 9,655 | 101.50 | ||||
| 2025-08-13 | 13F | GeoWealth Management, LLC | 8,605 | 123 | ||||||
| 2025-08-18 | 13F | Geneos Wealth Management Inc. | 468 | 7 | ||||||
| 2025-07-15 | 13F | Public Employees Retirement System Of Ohio | 33,917 | -41.89 | 483 | 11.57 | ||||
| 2025-05-15 | 13F/A | Orion Portfolio Solutions, LLC | 23,295 | 6.39 | 173 | 14.67 | ||||
| 2025-05-05 | 13F | Lindbrook Capital, Llc | 1,086 | -8.12 | 8 | 0.00 | ||||
| 2025-08-29 | NP | Gabelli Global Utility & Income Trust | 35,000 | 0.00 | 498 | 92.28 | ||||
| 2025-08-28 | NP | SPDW - SPDR(R) Portfolio Developed World ex-US ETF | 717,718 | 2.78 | 10,220 | 97.53 | ||||
| 2025-08-15 | 13F | Morgan Stanley | 6,003,052 | 7.27 | 85,483 | 106.14 | ||||
| 2025-06-26 | NP | DFAX - Dimensional World ex U.S. Core Equity 2 ETF | 18,475 | 0.00 | 168 | 25.56 | ||||
| 2025-07-16 | 13F | Signaturefd, Llc | 23,521 | 0.00 | 335 | 91.95 | ||||
| 2025-07-24 | 13F | Ramirez Asset Management, Inc. | 278,651 | -0.47 | 3,968 | 91.27 | ||||
| 2025-05-06 | 13F | Advisors Preferred, LLC | 0 | -100.00 | 0 | |||||
| 2025-07-25 | 13F | Cwm, Llc | 10,901 | -7.54 | 0 | |||||
| 2025-08-26 | NP | EHLS - Even Herd Long Short ETF | 26,888 | 383 | ||||||
| 2025-06-26 | NP | DFEM - Dimensional Emerging Markets Core Equity 2 ETF | 81,954 | 12.05 | 745 | 40.38 | ||||
| 2025-08-07 | 13F | Vise Technologies, Inc. | 19,844 | 52.79 | 283 | 216.85 | ||||
| 2025-08-14 | 13F | Qube Research & Technologies Ltd | 0 | -100.00 | 0 | |||||
| 2025-04-21 | 13F | Nelson, Van Denburg & Campbell Wealth Management Group, LLC | 0 | -100.00 | 0 | |||||
| 2025-08-05 | 13F | GHP Investment Advisors, Inc. | 0 | -100.00 | 0 | |||||
| 2025-06-26 | NP | DEXC - Dimensional Emerging Markets ex China Core Equity ETF | 8,160 | 19.33 | 74 | 51.02 | ||||
| 2025-07-28 | NP | NSI - National Security Emerging Markets Index ETF | 7,449 | 38.48 | 82 | 110.26 | ||||
| 2025-06-26 | NP | DFAE - Dimensional Emerging Core Equity Market ETF | 98,650 | 29.60 | 897 | 62.61 | ||||
| 2025-08-28 | NP | QEMM - SPDR MSCI Emerging Markets StrategicFactors ETF | 2,984 | 0.00 | 42 | 90.91 | ||||
| 2025-08-13 | 13F | West Family Investments, Inc. | 13,948 | 0.00 | 199 | 92.23 | ||||
| 2025-08-13 | 13F | Walleye Capital LLC | 242,832 | 216.69 | 3,458 | 508.63 | ||||
| 2025-08-14 | 13F | D. E. Shaw & Co., Inc. | 119,425 | -33.03 | 1,701 | 28.69 | ||||
| 2025-08-12 | 13F | Proequities, Inc. | Put | 0 | 0 | |||||
| 2025-08-12 | 13F | Proequities, Inc. | Call | 0 | 0 | |||||
| 2025-08-12 | 13F | Proequities, Inc. | 0 | 0 | ||||||
| 2025-08-14 | 13F | Kopernik Global Investors, LLC | 268,151 | -75.62 | 3,818 | -53.15 | ||||
| 2025-08-04 | 13F | Assetmark, Inc | 30 | 0 | ||||||
| 2025-08-11 | 13F | Principal Securities, Inc. | 186 | 3 | ||||||
| 2025-08-14 | 13F | GWM Advisors LLC | 248 | 0.40 | 4 | 200.00 | ||||
| 2025-07-10 | 13F | Wealth Enhancement Advisory Services, Llc | 15,058 | 201 | ||||||
| 2025-08-13 | 13F | Donald Smith & Co., Inc. | 9,149 | -99.23 | 130 | -98.52 | ||||
| 2025-08-28 | NP | CWI - SPDR(R) MSCI ACWI EX-US ETF | 43,109 | 0.35 | 614 | 92.77 | ||||
| 2025-08-14 | 13F | Bank Of America Corp /de/ | 371,494 | 133.67 | 5,290 | 349.07 | ||||
| 2025-08-07 | 13F | Campbell & CO Investment Adviser LLC | 50,740 | -25.24 | 723 | 43.82 | ||||
| 2025-08-04 | 13F | Simon Quick Advisors, Llc | 10,300 | 147 | ||||||
| 2025-08-12 | 13F | Seeds Investor Llc | 11,176 | 159 | ||||||
| 2025-08-14 | 13F | State Street Corp | 818,515 | 2.47 | 11,656 | 96.91 | ||||
| 2025-08-20 | NP | REMG - Emerging Markets Equity Active ETF | 15,576 | 222 | ||||||
| 2025-08-12 | 13F | Jpmorgan Chase & Co | 790 | -27.99 | 11 | 37.50 | ||||
| 2025-07-14 | 13F | Abound Wealth Management | 63 | -21.25 | 1 | |||||
| 2025-05-16 | 13F | Jones Financial Companies Lllp | 0 | -100.00 | 0 | |||||
| 2025-08-11 | 13F | Bell Investment Advisors, Inc | 469 | 300.85 | 7 | |||||
| 2025-08-12 | 13F | Virtu Financial LLC | 0 | -100.00 | 0 | |||||
| 2025-08-13 | 13F | Gabelli Funds Llc | 381,000 | 0.00 | 5,425 | 92.17 | ||||
| 2025-08-14 | 13F | Atomi Financial Group, Inc. | 16,797 | 4.30 | 239 | 100.84 | ||||
| 2025-08-13 | 13F | Russell Investments Group, Ltd. | 203,420 | -19.80 | 2,897 | 54.12 | ||||
| 2025-06-26 | NP | KGIIX - KOPERNIK INTERNATIONAL FUND CLASS I SHARES | 86,677 | 0.00 | 788 | 25.32 | ||||
| 2025-08-18 | 13F/A | National Bank Of Canada /fi/ | 366 | 5 | ||||||
| 2025-07-24 | 13F | Jfs Wealth Advisors, Llc | 653 | 11.82 | 9 | 125.00 | ||||
| 2025-08-13 | 13F | Twin Peaks Wealth Advisors, LLC | 182 | 3 | ||||||
| 2025-08-14 | 13F | Aqr Capital Management Llc | 59,257 | 102.86 | 844 | 290.28 | ||||
| 2025-08-14 | 13F | Group One Trading, L.p. | Call | 5,600 | 180.00 | 80 | 464.29 | |||
| 2025-08-14 | 13F | Group One Trading, L.p. | 901 | 1,225.00 | 13 | |||||
| 2025-08-14 | 13F | Group One Trading, L.p. | Put | 1,700 | 24 | |||||
| 2025-08-07 | 13F | Connor, Clark & Lunn Investment Management Ltd. | 336,913 | -16.96 | 4,798 | 59.58 | ||||
| 2025-05-09 | 13F | R Squared Ltd | 0 | -100.00 | 0 | |||||
| 2025-08-08 | 13F | Creative Planning | 12,556 | 179 | ||||||
| 2025-08-11 | 13F | WPG Advisers, LLC | 109 | 2 | ||||||
| 2025-07-28 | NP | AVEEX - Avantis Emerging Markets Equity Fund Institutional Class This fund is a listed as child fund of American Century Companies Inc and if that institution has disclosed ownership in this security, then these positions will not be double counted when calculating total shares and total value | 20,470 | 0.00 | 226 | 51.68 | ||||
| 2025-07-08 | 13F | Parallel Advisors, LLC | 1,476 | -11.51 | 21 | 75.00 | ||||
| 2025-08-12 | 13F | Atlas Capital Advisors Llc | 32,952 | 158.77 | 469 | 398.94 | ||||
| 2025-05-12 | 13F | Townsquare Capital Llc | 0 | -100.00 | 0 | |||||
| 2025-07-28 | NP | AVEM - Avantis Emerging Markets Equity ETF This fund is a listed as child fund of American Century Companies Inc and if that institution has disclosed ownership in this security, then these positions will not be double counted when calculating total shares and total value | 493,896 | 21.44 | 5,458 | 83.80 | ||||
| 2025-06-30 | 13F/A | Deutsche Bank Ag\ | 0 | -100.00 | 0 | |||||
| 2025-08-05 | 13F | Simplex Trading, Llc | Put | 600 | 0 | |||||
| 2025-08-26 | NP | EMIF - iShares Emerging Markets Infrastructure ETF | 27,693 | -29.37 | 394 | 29.61 | ||||
| 2025-08-05 | 13F | Simplex Trading, Llc | 77,994 | 1 | ||||||
| 2025-08-13 | 13F | Marshall Wace, Llp | 191,445 | 3.42 | 2,726 | 98.83 | ||||
| 2025-08-05 | 13F | Simplex Trading, Llc | Call | 1,000 | 100.00 | 0 | ||||
| 2025-08-13 | 13F | Cerity Partners LLC | 135,299 | -6.98 | 1,927 | 78.83 | ||||
| 2025-05-01 | 13F | Schechter Investment Advisors, LLC | 0 | -100.00 | 0 | |||||
| 2025-06-30 | NP | VGTSX - Vanguard Total International Stock Index Fund Investor Shares | 956,690 | 0.00 | 8,696 | 25.37 | ||||
| 2025-08-05 | 13F | Huntington National Bank | 1 | 0.00 | 0 | |||||
| 2025-07-07 | 13F | Northwest & Ethical Investments L.P. | 0 | -100.00 | 0 | -100.00 | ||||
| 2025-08-15 | 13F | Binnacle Investments Inc | 59 | 1 | ||||||
| 2025-06-26 | NP | DFCEX - Emerging Markets Core Equity Portfolio - Institutional Class This fund is a listed as child fund of Dimensional Fund Advisors Lp and if that institution has disclosed ownership in this security, then these positions will not be double counted when calculating total shares and total value | 326,264 | 0.00 | 2,966 | 25.37 | ||||
| 2025-08-29 | NP | Gabelli Utility Trust | 38,000 | 0.00 | 541 | 92.53 | ||||
| 2025-08-14 | 13F | Goldman Sachs Group Inc | 859,893 | 1.18 | 12,245 | 94.44 | ||||
| 2025-07-14 | 13F | GAMMA Investing LLC | 15,343 | 169.60 | 218 | 419.05 | ||||
| 2025-08-28 | NP | SPGM - SPDR(R) Portfolio MSCI Global Stock Market ETF | 4,989 | 2.97 | 71 | 102.86 | ||||
| 2025-08-12 | 13F | XTX Topco Ltd | 17,410 | 248 | ||||||
| 2025-07-24 | 13F | Ronald Blue Trust, Inc. | 34,023 | 12.47 | 484 | 116.07 | ||||
| 2025-08-04 | 13F | Hantz Financial Services, Inc. | 2,757 | 204.30 | 0 | |||||
| 2025-07-25 | 13F | JustInvest LLC | 175,690 | 57.21 | 2,502 | 202.05 | ||||
| 2025-08-12 | 13F | BlackRock, Inc. | 1,003,546 | 24.81 | 14,290 | 139.89 | ||||
| 2025-08-13 | 13F | EverSource Wealth Advisors, LLC | 17,187 | -0.54 | 245 | 90.63 | ||||
| 2025-07-28 | NP | AVXC - Avantis Emerging Markets ex-China Equity ETF | 4,725 | 33.14 | 52 | 108.00 | ||||
| 2025-07-30 | NP | APIE - ActivePassive International Equity ETF | 11,530 | 127 | ||||||
| 2025-08-14 | 13F | Kovitz Investment Group Partners, LLC | 11,472 | 163 | ||||||
| 2025-08-29 | NP | GCAEX - The Gabelli Equity Income Fund Class A | 5,000 | 0.00 | 71 | 91.89 | ||||
| 2025-07-31 | 13F | Whipplewood Advisors, LLC | 325 | 5 | ||||||
| 2025-08-12 | 13F | MAI Capital Management | 6,556 | 93 | ||||||
| 2025-07-17 | 13F | Janney Montgomery Scott LLC | 57,896 | 1 | ||||||
| 2025-08-15 | 13F | WealthCollab, LLC | 49 | 0.00 | 1 | |||||
| 2025-08-13 | 13F | Quadrant Capital Group Llc | 171,595 | 369.12 | 2,444 | 801.48 | ||||
| 2025-08-14 | 13F | Wetherby Asset Management Inc | 30,636 | -0.08 | 436 | 107.62 | ||||
| 2025-08-12 | 13F | Summit Global Investments | 44,281 | 1 | ||||||
| 2025-08-14 | 13F | Citadel Advisors Llc | 105,935 | 17.03 | 1,509 | 125.07 | ||||
| 2025-08-14 | 13F | Stifel Financial Corp | 21,505 | 17.84 | 306 | 126.67 | ||||
| 2025-08-14 | 13F | Ieq Capital, Llc | 34,563 | 242.51 | 492 | 564.86 | ||||
| 2025-08-14 | 13F | Citadel Advisors Llc | Call | 12,700 | 1,714.29 | 181 | 3,500.00 | |||
| 2025-08-12 | 13F | Pathstone Holdings, LLC | 166,737 | 431.84 | 2,374 | 923.28 | ||||
| 2025-07-24 | 13F | Us Bancorp \de\ | 9,266 | 0.00 | 132 | 92.65 | ||||
| 2025-08-27 | NP | TIFF INVESTMENT PROGRAM - TIFF Multi-Asset Fund | 66,802 | -37.04 | 951 | 20.99 | ||||
| 2025-08-14 | 13F/A | Skopos Labs, Inc. | 5,979 | 225.12 | 85 | 553.85 | ||||
| 2025-06-26 | NP | DFA INVESTMENT DIMENSIONS GROUP INC - World ex U.S. Core Equity Portfolio Institutional Class Shares | 1,200 | 0.00 | 11 | 25.00 | ||||
| 2025-07-07 | 13F | Thurston, Springer, Miller, Herd & Titak, Inc. | 0 | -100.00 | 0 | |||||
| 2025-05-05 | 13F | Transce3nd, LLC | 0 | -100.00 | 0 | |||||
| 2025-08-14 | 13F | Vident Advisory, LLC | 179,369 | 16.04 | 2,554 | 123.06 | ||||
| 2025-08-07 | 13F | Capital Wealth Planning, LLC | 203,428 | 2,897 | ||||||
| 2025-08-14 | 13F | Toroso Investments, LLC | 26,888 | 383 | ||||||
| 2025-08-12 | 13F | Rhumbline Advisers | 163,208 | 0.73 | 2,324 | 93.67 | ||||
| 2025-08-07 | 13F | Allworth Financial LP | 952 | 0.00 | 14 | 62.50 | ||||
| 2025-08-13 | 13F | Northern Trust Corp | 842,080 | 160.34 | 11,991 | 400.46 | ||||
| 2025-08-14 | 13F | Mariner, LLC | 90,291 | 17.76 | 1,286 | 126.23 | ||||
| 2025-08-14 | 13F | Millennium Management Llc | 0 | -100.00 | 0 | |||||
| 2025-08-14 | 13F | Diversify Wealth Management, Llc | 87,481 | 1,232 | ||||||
| 2025-08-29 | NP | JVANX - International Equity Index Trust NAV | 4,277 | 0.00 | 61 | 93.55 | ||||
| 2025-08-12 | 13F | O'shaughnessy Asset Management, Llc | 20,896 | 8.48 | 298 | 109.15 | ||||
| 2025-06-26 | NP | DAADX - Emerging Markets ex China Core Equity Portfolio Institutional Class | 22,118 | 0.00 | 201 | 25.63 | ||||
| 2025-08-14 | 13F | Ariadne Wealth Management, LP | 14,940 | 212 | ||||||
| 2025-07-28 | 13F | BRYN MAWR TRUST Co | 4,500 | 0.00 | 64 | 93.94 | ||||
| 2025-08-14 | 13F | Susquehanna International Group, Llp | 67,500 | 961 | ||||||
| 2025-06-30 | NP | VEU - Vanguard FTSE All-World ex-US Index Fund ETF Shares | 323,139 | 4.37 | 2,937 | 30.88 | ||||
| 2025-08-13 | 13F | Northwestern Mutual Wealth Management Co | 2,323 | -59.55 | 33 | -21.43 | ||||
| 2025-08-14 | 13F | Sei Investments Co | 142,109 | 122.49 | 2,024 | 327.70 | ||||
| 2025-08-11 | 13F | TD Waterhouse Canada Inc. | 247 | 3 | ||||||
| 2025-08-14 | 13F | Wells Fargo & Company/mn | 1,427 | 367.87 | 20 | 900.00 | ||||
| 2025-08-14 | 13F | Fmr Llc | 143,844 | 54.84 | 2,048 | 197.67 | ||||
| 2025-05-29 | NP | MCTOX - Modern Capital Tactical Opportunities Fund Class A Shares | 57,699 | -17.60 | 428 | -11.23 | ||||
| 2025-08-12 | 13F | SRS Capital Advisors, Inc. | 1,254 | 18 | ||||||
| 2025-08-11 | 13F | Pinnacle Wealth Planning Services, Inc. | 23,465 | 38.96 | 334 | 167.20 | ||||
| 2025-08-27 | 13F/A | Brinker Capital Investments, LLC | 38,871 | 66.86 | 554 | 221.51 | ||||
| 2025-08-11 | 13F | Vanguard Group Inc | 1,346,340 | 2.59 | 19,172 | 97.15 | ||||
| 2025-08-13 | 13F | Natixis Advisors, L.p. | 107,800 | 2 | ||||||
| 2025-05-05 | 13F | IFP Advisors, Inc | 0 | -100.00 | 0 | |||||
| 2025-08-14 | 13F | UBS Group AG | 376,794 | -3.70 | 5,366 | 85.06 | ||||
| 2025-08-15 | 13F | CI Private Wealth, LLC | 153,117 | 1.62 | 2,180 | 95.34 | ||||
| 2025-07-29 | 13F | Wealthstream Advisors, Inc. | 11,867 | 169 | ||||||
| 2025-08-14 | 13F | Jane Street Group, Llc | 242,154 | 3,448 | ||||||
| 2025-08-29 | NP | GAUAX - The Gabelli Utilities Fund Class A | 188,000 | 0.00 | 2,677 | 92.18 | ||||
| 2025-08-11 | 13F | EntryPoint Capital, LLC | 20,351 | -24.65 | 290 | 44.50 | ||||
| 2025-08-14 | 13F | Ameriprise Financial Inc | 13,198 | 27.88 | 188 | 146.05 | ||||
| 2025-08-06 | 13F | True Wealth Design, LLC | 103 | 0.00 | 1 | |||||
| 2025-06-18 | NP | RAZAX - Multi-Asset Growth Strategy Fund Class A | 11,267 | 0.00 | 102 | 25.93 | ||||
| 2025-08-14 | 13F | Cubist Systematic Strategies, LLC | 0 | -100.00 | 0 | |||||
| 2025-05-06 | 13F | Venturi Wealth Management, LLC | 0 | -100.00 | 0 | |||||
| 2025-08-14 | 13F | Barometer Capital Management Inc. | 17,015 | 0.00 | 242 | 92.06 | ||||
| 2025-08-14 | 13F | Smartleaf Asset Management LLC | 0 | -100.00 | 0 | |||||
| 2025-08-11 | 13F | HighTower Advisors, LLC | 13,595 | 194 | ||||||
| 2025-08-13 | 13F | First Trust Advisors Lp | 31,215 | -17.61 | 445 | 58.57 | ||||
| 2025-08-08 | 13F | SBI Securities Co., Ltd. | 3 | -25.00 | 0 | |||||
| 2025-05-15 | 13F | Engineers Gate Manager LP | 0 | -100.00 | 0 | |||||
| 2025-08-07 | 13F | Sierra Ocean, Llc | 1,241 | -10.53 | 18 | 70.00 | ||||
| 2025-08-08 | NP | QGBLX - Quantified Global Fund Investor Class | 26,098 | 372 | ||||||
| 2025-08-11 | 13F | Inspire Advisors, LLC | 16,900 | -14.10 | 241 | 65.52 | ||||
| 2025-07-24 | 13F | PDS Planning, Inc | 26,753 | -0.24 | 381 | 91.92 | ||||
| 2025-08-14 | 13F | Peak6 Llc | Put | 4,000 | 57 | |||||
| 2025-08-14 | 13F | Peak6 Llc | Call | 290,500 | 4,137 |
Other Listings
| US:KEP | US$ 13.37 |