Mga Batayang Estadistika
| Pemilik Institusional | 99 total, 91 long only, 0 short only, 8 long/short - change of 0.00% MRQ |
| Harga Saham | 1.45 |
| Alokasi Portofolio Rata-rata | 0.1666 % - change of 1.41% MRQ |
| Saham Institusional (Jangka Panjang) | 102,204,162 (ex 13D/G) - change of -12.00MM shares -10.50% MRQ |
| Nilai Institusional (Jangka Panjang) | $ 276,370 USD ($1000) |
Kepemilikan Institusional dan Pemegang Saham
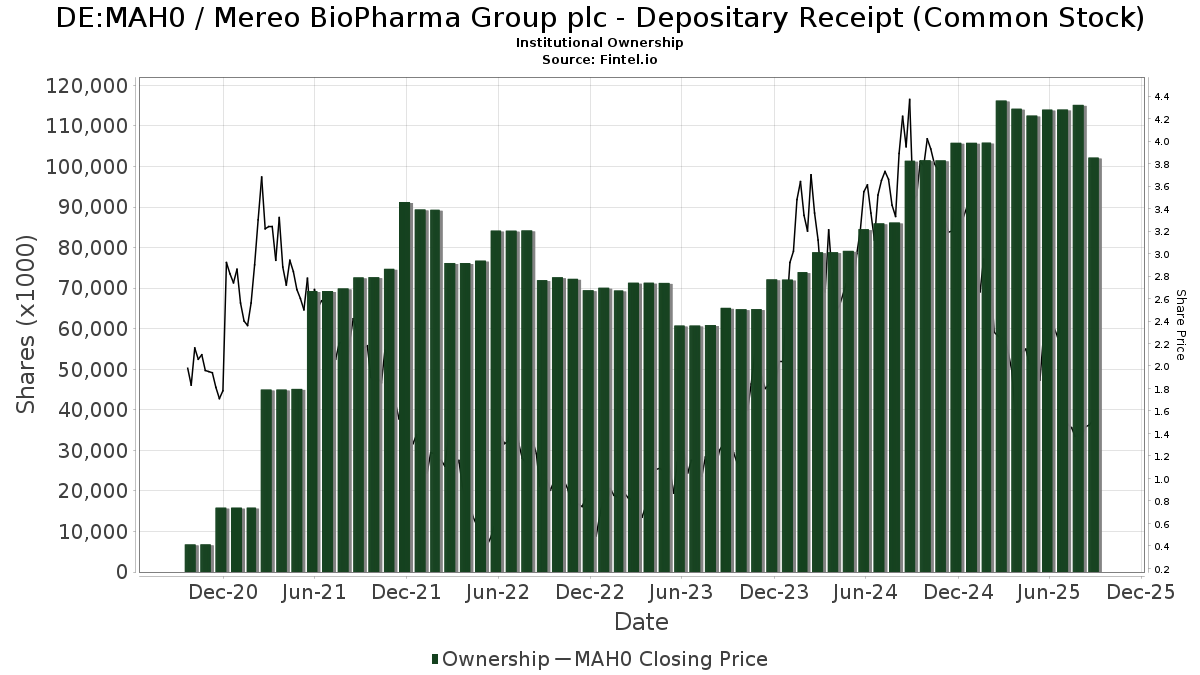
Mereo BioPharma Group plc - Depositary Receipt (Common Stock) (DE:MAH0) memiliki 99 pemilik institusional dan pemegang saham yang telah mengajukan formulir 13D/G atau 13F kepada Komisi Bursa Efek (Securities Exchange Commission/SEC). Lembaga-lembaga ini memegang total 102,204,162 saham. Pemegang saham terbesar meliputi Janus Henderson Group Plc, Rubric Capital Management LP, Frazier Life Sciences Management, L.P., Mangrove Partners, Deerfield Management Company, L.p. (series C), Alkeon Capital Management Llc, Rock Springs Capital Management LP, 683 Capital Management, LLC, Clearline Capital LP, and Goldman Sachs Group Inc .
Struktur kepemilikan institusional Mereo BioPharma Group plc - Depositary Receipt (Common Stock) (DB:MAH0) menunjukkan posisi terkini di perusahaan oleh institusi dan dana, serta perubahan terbaru dalam ukuran posisi. Pemegang saham utama dapat mencakup investor individu, reksa dana, dana lindung nilai, atau institusi. Jadwal 13D menunjukkan bahwa investor memegang (atau pernah memegang) lebih dari 5% saham perusahaan dan bermaksud (atau pernah bermaksud) untuk secara aktif mengejar perubahan strategi bisnis. Jadwal 13G menunjukkan investasi pasif lebih dari 5%.
The share price as of September 5, 2025 is 1.45 / share. Previously, on September 9, 2024, the share price was 3.82 / share. This represents a decline of 62.04% over that period.
Skor Sentimen Dana
Skor Sentimen Dana (sebelumnya dikenal sebagai Skor Akumulasi Kepemilikan) menemukan saham-saham yang paling banyak dibeli oleh dana. Ini adalah hasil dari model kuantitatif multi-faktor yang canggih yang mengidentifikasi perusahaan dengan tingkat akumulasi institusional tertinggi. Model penilaian menggunakan kombinasi dari total peningkatan pemilik yang diungkapkan, perubahan dalam alokasi portofolio pada pemilik tersebut, dan metrik lainnya. Angka berkisar dari 0 hingga 100, dengan angka yang lebih tinggi menunjukkan tingkat akumulasi yang lebih tinggi dibandingkan dengan perusahaan sejenisnya, dan 50 adalah rata-ratanya.
Frekuensi Pembaruan: Setiap Hari
Lihat Ownership Explorer, yang menyediakan daftar perusahaan dengan peringkat tertinggi.
Pengajuan 13F dan NPORT
Detail pada pengajuan 13F tersedia gratis. Detail pada pengajuan NP memerlukan keanggotaan premium. Baris berwarna hijau menunjukkan posisi baru. Baris berwarna merah menunjukkan posisi yang sudah ditutup. Klik tautan ini ikon untuk melihat riwayat transaksi selengkapnya.
Tingkatkan
untuk membuka data premium dan mengekspor ke Excel ![]() .
.
| Tanggal File | Sumber | Investor | Ketik | Presyo ng Avg (Silangan) |
Saham | Δ Saham (%) |
Dilaporkan Nilai ($1000) |
Nilai Δ (%) |
Alokasi Port (%) |
|
|---|---|---|---|---|---|---|---|---|---|---|
| 2025-08-13 | 13F | Renaissance Technologies Llc | 1,480,471 | 9.63 | 4,012 | 32.06 | ||||
| 2025-07-11 | 13F | Grove Bank & Trust | 0 | -100.00 | 0 | |||||
| 2025-08-12 | 13F | MAI Capital Management | 309 | 0.00 | 1 | |||||
| 2025-07-24 | NP | HRTS - Tema Cardiovascular and Metabolic ETF | 115,837 | -56.69 | 249 | -61.15 | ||||
| 2025-08-14 | 13F | Cubist Systematic Strategies, LLC | 21,099 | 57 | ||||||
| 2025-08-07 | 13F | Allworth Financial LP | 1,637 | 9.13 | 4 | 33.33 | ||||
| 2025-08-11 | 13F | Principal Securities, Inc. | 75 | 134.38 | 0 | |||||
| 2025-08-11 | 13F | Knott David M Jr | 319,337 | 0.00 | 865 | 20.47 | ||||
| 2025-08-11 | 13F | Persistent Asset Partners Ltd | Call | 3,035 | 155.90 | 244 | 65.31 | |||
| 2025-08-28 | NP | Tekla World Healthcare Fund | 1,681,804 | 29.33 | 4,558 | 55.79 | ||||
| 2025-07-31 | 13F | Caitong International Asset Management Co., Ltd | 4,544 | 206.20 | 12 | 300.00 | ||||
| 2025-07-18 | 13F | PFG Investments, LLC | 37,433 | 0.00 | 101 | 20.24 | ||||
| 2025-08-14 | 13F | Acuta Capital Partners, Llc | 0 | -100.00 | 0 | |||||
| 2025-08-13 | 13F | NEOS Investment Management LLC | 102,583 | -84.33 | 278 | -81.11 | ||||
| 2025-08-14 | 13F | Millennium Management Llc | Put | 288,700 | 0.00 | 782 | 20.49 | |||
| 2025-08-14 | 13F | Millennium Management Llc | Call | 153,000 | 415 | |||||
| 2025-08-13 | 13F | Level Four Advisory Services, Llc | 10,000 | 0.00 | 27 | 22.73 | ||||
| 2025-08-19 | 13F | Newbridge Financial Services Group, Inc. | 13,000 | 18.18 | 35 | 45.83 | ||||
| 2025-06-12 | 13F | Sheets Smith Investment Management | 16,890 | 0.00 | 38 | -35.59 | ||||
| 2025-08-19 | 13F | Marex Group plc | 10,000 | 27 | ||||||
| 2025-08-14 | 13F | Diadema Partners Lp | Put | 39,400 | 0.00 | 107 | 20.45 | |||
| 2025-08-14 | 13F | Diadema Partners Lp | Call | 1,317,600 | 155.75 | 3,571 | 208.02 | |||
| 2025-08-14 | 13F | Perceptive Advisors Llc | 0 | -100.00 | 0 | -100.00 | ||||
| 2025-08-14 | 13F | Citadel Advisors Llc | 760,659 | 121.35 | 2,061 | 166.62 | ||||
| 2025-08-14 | 13F | Cantor Fitzgerald, L. P. | 342,957 | -3.39 | 929 | 16.42 | ||||
| 2025-08-14 | 13F | Ubs Asset Management Americas Inc | 0 | -100.00 | 0 | |||||
| 2025-08-14 | 13F | Citadel Advisors Llc | Call | 62,200 | -18.69 | 169 | -2.33 | |||
| 2025-08-14 | 13F | Citadel Advisors Llc | Put | 99,800 | 187.61 | 270 | 246.15 | |||
| 2025-08-15 | 13F | Soleus Capital Management, L.P. | 599,711 | -12.70 | 1,625 | 5.18 | ||||
| 2025-08-14 | 13F | Integral Health Asset Management, LLC | 0 | -100.00 | 0 | |||||
| 2025-08-15 | 13F | Morgan Stanley | 785,377 | -63.97 | 2,128 | -56.61 | ||||
| 2025-08-14 | 13F | Caption Management, LLC | 197,599 | 88.58 | 535 | 127.66 | ||||
| 2025-08-14 | 13F | Schonfeld Strategic Advisors LLC | 909,640 | -42.83 | 2,465 | -31.13 | ||||
| 2025-08-14 | 13F | Caption Management, LLC | Call | 437,500 | 43.44 | 1,186 | 72.74 | |||
| 2025-07-14 | 13F | GAMMA Investing LLC | 9,257 | 10.47 | 25 | 38.89 | ||||
| 2025-08-12 | 13F | Jpmorgan Chase & Co | 0 | -100.00 | 0 | |||||
| 2025-08-14 | 13F | Millennium Management Llc | 595,673 | 51.02 | 1,614 | 81.96 | ||||
| 2025-08-14 | 13F | Point72 Asset Management, L.P. | 59,200 | 65.29 | 160 | 100.00 | ||||
| 2025-08-14 | 13F | Susquehanna International Group, Llp | 361,542 | 107.33 | 980 | 149.74 | ||||
| 2025-08-14 | 13F | Susquehanna International Group, Llp | Call | 133,600 | 43.66 | 362 | 73.21 | |||
| 2025-08-14 | 13F | Susquehanna International Group, Llp | Put | 111,600 | 27.11 | 302 | 53.30 | |||
| 2025-04-11 | 13F | Cranbrook Wealth Management, LLC | 0 | -100.00 | 0 | |||||
| 2025-08-12 | 13F | Proequities, Inc. | Put | 0 | 0 | |||||
| 2025-08-12 | 13F | Proequities, Inc. | Call | 0 | 0 | |||||
| 2025-08-14 | 13F | Diadema Partners Lp | 0 | -100.00 | 0 | -100.00 | ||||
| 2025-08-28 | NP | GWX - SPDR(R) S&P(R) International Small Cap ETF | 44,942 | -1.57 | 122 | 18.63 | ||||
| 2025-08-12 | 13F | Proequities, Inc. | 0 | 0 | ||||||
| 2025-08-14 | 13F | Fmr Llc | 1,478,500 | 94.77 | 4,007 | 134.68 | ||||
| 2025-07-24 | 13F | Us Bancorp \de\ | 13 | 0.00 | 0 | |||||
| 2025-08-14 | 13F | Jane Street Group, Llc | Put | 221,700 | 2.02 | 601 | 22.95 | |||
| 2025-08-14 | 13F | Deerfield Management Company, L.p. (series C) | 6,710,429 | 0.00 | 18,185 | 20.45 | ||||
| 2025-06-26 | NP | FBTAX - Fidelity Advisor Biotechnology Fund Class A This fund is a listed as child fund of Fmr Llc and if that institution has disclosed ownership in this security, then these positions will not be double counted when calculating total shares and total value | 759,100 | 1,966 | ||||||
| 2025-08-14 | 13F/A | Forefront Analytics, LLC | 19,138 | -59.82 | 52 | -52.34 | ||||
| 2025-08-14 | 13F | UBS Group AG | 373,505 | -59.93 | 1,012 | -51.74 | ||||
| 2025-05-15 | 13F | Verition Fund Management LLC | 0 | -100.00 | 0 | |||||
| 2025-08-14 | 13F | Clearline Capital LP | 3,618,163 | 12.44 | 9,805 | 35.43 | ||||
| 2025-07-16 | 13F | Signaturefd, Llc | 187 | 1 | ||||||
| 2025-08-08 | 13F | Geode Capital Management, Llc | 92,534 | 0.41 | 251 | 20.77 | ||||
| 2025-08-12 | 13F | Rhumbline Advisers | 9,878 | 49.94 | 27 | 85.71 | ||||
| 2025-08-14 | 13F | Two Sigma Investments, Lp | 659,158 | 168.82 | 1,786 | 224.14 | ||||
| 2025-08-05 | 13F | Simplex Trading, Llc | Put | 25,000 | 7.76 | 0 | ||||
| 2025-08-14 | 13F | Knoll Capital Management, LLC | 260,470 | 0.00 | 706 | 20.31 | ||||
| 2025-08-05 | 13F | Simplex Trading, Llc | 201,141 | 4,785.62 | 1 | |||||
| 2025-08-05 | 13F | Simplex Trading, Llc | Call | 199,200 | 250.09 | 1 | ||||
| 2025-07-14 | 13F | HealthInvest Partners AB | 764,901 | 96.13 | 2,073 | 136.26 | ||||
| 2025-08-12 | 13F | BlackRock, Inc. | 455,365 | 65.97 | 1,234 | 100.00 | ||||
| 2025-08-14 | 13F | Wells Fargo & Company/mn | 230 | -81.30 | 1 | -100.00 | ||||
| 2025-07-15 | 13F | Significant Wealth Partners LLC | 22,261 | 61.65 | 60 | 100.00 | ||||
| 2025-08-07 | 13F | Resources Investment Advisors, LLC. | 18,300 | 0.00 | 50 | 19.51 | ||||
| 2025-08-14 | 13F | Paloma Partners Management Co | 296,659 | 804 | ||||||
| 2025-08-14 | 13F | Janus Henderson Group Plc | 17,688,592 | -22.20 | 48,113 | -8.19 | ||||
| 2025-08-11 | 13F | Persistent Asset Partners Ltd | Put | 2,303 | 2,430.77 | 1,025 | 14,542.86 | |||
| 2025-08-14 | 13F | Alkeon Capital Management Llc | 4,698,100 | 0.00 | 12,732 | 20.44 | ||||
| 2025-08-14 | 13F | J. Goldman & Co LP | 52,384 | -34.01 | 142 | -20.79 | ||||
| 2025-08-14 | 13F | Bnp Paribas Arbitrage, Sa | 3 | 0.00 | 0 | |||||
| 2025-08-14 | 13F | Artia Global Partners LP | 475,361 | 12.82 | 1,288 | 35.86 | ||||
| 2025-08-14 | 13F | ADAR1 Capital Management, LLC | 0 | -100.00 | 0 | |||||
| 2025-07-24 | NP | Tema ETF Trust - Tema Oncology ETF | 147,616 | -43.59 | 317 | -49.52 | ||||
| 2025-08-14 | 13F/A | Skopos Labs, Inc. | 849 | 2 | ||||||
| 2025-08-14 | 13F | 683 Capital Management, LLC | 4,350,000 | -6.15 | 11,788 | 13.04 | ||||
| 2025-05-15 | 13F | Eversept Partners, LP | 0 | -100.00 | 0 | |||||
| 2025-04-18 | 13F | Bfsg, Llc | 0 | -100.00 | 0 | -100.00 | ||||
| 2025-08-13 | 13F | Virtus Investment Advisers, Inc. | 33,825 | -23.14 | 92 | -8.08 | ||||
| 2025-07-14 | 13F | Avanza Fonder AB | 38,235 | 35.97 | 104 | 56.06 | ||||
| 2025-08-13 | 13F | Centiva Capital, LP | 25,000 | 0.00 | 68 | 19.64 | ||||
| 2025-08-12 | 13F | XTX Topco Ltd | 69,341 | 188 | ||||||
| 2025-08-13 | 13F | Hsbc Holdings Plc | 0 | -100.00 | 0 | |||||
| 2025-05-15 | 13F | Blue Owl Capital Holdings LP | 0 | -100.00 | 0 | |||||
| 2025-08-08 | 13F | BIT Capital GmbH | 0 | -100.00 | 0 | -100.00 | ||||
| 2025-08-14 | 13F | LMR Partners LLP | Call | 125,000 | 339 | |||||
| 2025-06-26 | NP | IDNA - iShares Genomics Immunology and Healthcare ETF | 242,039 | -1.85 | 627 | -15.63 | ||||
| 2025-05-15 | 13F | Polar Asset Management Partners Inc. | 0 | -100.00 | 0 | |||||
| 2025-08-14 | 13F | Two Sigma Advisers, Lp | 144,600 | 393.52 | 392 | 501.54 | ||||
| 2025-08-14 | 13F | Mangrove Partners | 8,636,485 | 0.00 | 23,405 | 20.44 | ||||
| 2025-05-14 | 13F | Walleye Capital LLC | 0 | -100.00 | 0 | |||||
| 2025-08-13 | 13F | Marshall Wace, Llp | 767,744 | 0.00 | 2,081 | 20.44 | ||||
| 2025-07-24 | NP | FNCMX - Fidelity Nasdaq Composite Index Fund This fund is a listed as child fund of Fmr Llc and if that institution has disclosed ownership in this security, then these positions will not be double counted when calculating total shares and total value | 92,156 | 0.00 | 198 | -10.41 | ||||
| 2025-05-05 | 13F | Lindbrook Capital, Llc | 0 | -100.00 | 0 | -100.00 | ||||
| 2025-08-07 | 13F | Monaco Asset Management SAM | 395,000 | -5.15 | 1,070 | 14.19 | ||||
| 2025-08-14 | 13F | Hrt Financial Lp | 0 | -100.00 | 0 | |||||
| 2025-08-26 | NP | NORTHERN FUNDS - NORTHERN SMALL CAP CORE FUND Class K | 1,007 | 0.00 | 3 | 0.00 | ||||
| 2025-08-14 | 13F | Rubric Capital Management LP | 15,307,347 | 0.00 | 41,483 | 20.44 | ||||
| 2025-08-08 | 13F | New England Capital Financial Advisors LLC | 300 | 0.00 | 1 | |||||
| 2025-08-14 | 13F | Jane Street Group, Llc | Call | 27,000 | 126.89 | 73 | 180.77 | |||
| 2025-08-14 | 13F | Jane Street Group, Llc | 247,441 | 70.88 | 671 | 106.15 | ||||
| 2025-08-14 | 13F | Frazier Life Sciences Management, L.P. | 9,440,112 | 20.72 | 25,583 | 45.40 | ||||
| 2025-05-15 | 13F | J. Goldman & Co LP | Call | 0 | -100.00 | 0 | -100.00 | |||
| 2025-08-12 | 13F | SRS Capital Advisors, Inc. | 4,000 | 0.00 | 11 | 11.11 | ||||
| 2025-08-14 | 13F | Dauntless Investment Group, LLC | 134,122 | 363 | ||||||
| 2025-08-28 | NP | Tekla Life Sciences Investors | 1,347,068 | 65.88 | 3,651 | 99.78 | ||||
| 2025-08-14 | 13F | Raymond James Financial Inc | 1,570 | 4 | ||||||
| 2025-05-15 | 13F | Manufacturers Life Insurance Company, The | 0 | -100.00 | 0 | |||||
| 2025-05-09 | 13F | GeoWealth Management, LLC | 0 | -100.00 | 0 | |||||
| 2025-08-14 | 13F | Ameriprise Financial Inc | 0 | -100.00 | 0 | |||||
| 2025-05-14 | 13F | Jump Financial, LLC | 0 | -100.00 | 0 | |||||
| 2025-08-14 | 13F | Bank Of America Corp /de/ | 438,661 | -0.00 | 1,189 | 20.36 | ||||
| 2025-08-13 | 13F | Quadrature Capital Ltd | 25,399 | 11.95 | 69 | 35.29 | ||||
| 2025-08-13 | 13F | Tema Etfs Llc | 102,583 | -84.33 | 278 | -81.11 | ||||
| 2025-08-13 | 13F | Tejara Capital Ltd | 2,430,437 | -3.60 | 6,586 | 16.11 | ||||
| 2025-09-04 | 13F/A | Advisor Group Holdings, Inc. | 5,377 | 75.55 | 15 | 133.33 | ||||
| 2025-08-14 | 13F | Woodline Partners LP | 0 | -100.00 | 0 | |||||
| 2025-08-18 | 13F/A | Hudson Bay Capital Management LP | 450,000 | 0.00 | 1,220 | 20.45 | ||||
| 2025-07-14 | 13F | Clear Harbor Asset Management, LLC | 42,000 | 0.00 | 114 | 20.21 | ||||
| 2025-05-14 | 13F | Virtus ETF Advisers LLC | 0 | -100.00 | 0 | |||||
| 2025-08-14 | 13F | State Street Corp | 44,942 | -1.57 | 122 | 18.63 | ||||
| 2025-08-27 | 13F/A | Squarepoint Ops LLC | 20,668 | 15.26 | 56 | 40.00 | ||||
| 2025-08-14 | 13F | Aquatic Capital Management LLC | 26,930 | 73 | ||||||
| 2025-08-14 | 13F | Rock Springs Capital Management LP | 4,465,292 | -33.20 | 12,101 | -19.54 | ||||
| 2025-08-15 | 13F/A | Exome Asset Management LLC | 14,600 | 40 | ||||||
| 2025-08-14 | 13F | Graham Capital Management, L.P. | 21,176 | -57.15 | 57 | -48.65 | ||||
| 2025-07-14 | 13F | Golden State Equity Partners | 19,900 | 0.00 | 54 | 20.45 | ||||
| 2025-08-05 | 13F | GPS Wealth Strategies Group, LLC | 1,500 | 0.00 | 4 | 33.33 | ||||
| 2025-08-14 | 13F | Group One Trading, L.p. | Put | 56,100 | -33.29 | 152 | -19.58 | |||
| 2025-07-24 | 13F | Standard Life Aberdeen plc | 3,028,872 | 38.41 | 8,208 | 66.73 | ||||
| 2025-08-14 | 13F | Sit Investment Associates Inc | 970 | 0.00 | 0 | |||||
| 2025-08-14 | 13F | Group One Trading, L.p. | Call | 489,900 | 13.25 | 1,328 | 36.38 | |||
| 2025-08-18 | 13F/A | Nomura Holdings Inc | 125,000 | 339 | ||||||
| 2025-08-14 | 13F | Goldman Sachs Group Inc | 3,090,068 | 45.35 | 8,374 | 75.08 | ||||
| 2025-08-14 | 13F | Group One Trading, L.p. | 139,559 | 307.10 | 378 | 390.91 | ||||
| 2025-08-13 | 13F | Transce3nd, LLC | 127 | 0.00 | 0 | |||||
| 2025-08-13 | 13F/A | DLD Asset Management, LP | Call | 25,000 | 68 | |||||
| 2025-06-25 | NP | BBC - Virtus LifeSci Biotech Clinical Trials ETF | 44,024 | 170.19 | 114 | 132.65 | ||||
| 2025-08-14 | 13F | Adage Capital Partners Gp, L.l.c. | 0 | -100.00 | 0 | |||||
| 2025-08-11 | 13F | Persistent Asset Partners Ltd | 0 | -100.00 | 0 | -100.00 | ||||
| 2025-08-14 | 13F | Great Point Partners Llc | 0 | -100.00 | 0 | |||||
| 2025-08-13 | 13F | EverSource Wealth Advisors, LLC | 470 | 1 |