Mga Batayang Estadistika
| Pemilik Institusional | 192 total, 192 long only, 0 short only, 0 long/short - change of -1.54% MRQ |
| Alokasi Portofolio Rata-rata | 0.6513 % - change of -4.25% MRQ |
| Saham Institusional (Jangka Panjang) | 32,923,553 (ex 13D/G) - change of -2.19MM shares -6.24% MRQ |
| Nilai Institusional (Jangka Panjang) | $ 816,341 USD ($1000) |
Kepemilikan Institusional dan Pemegang Saham
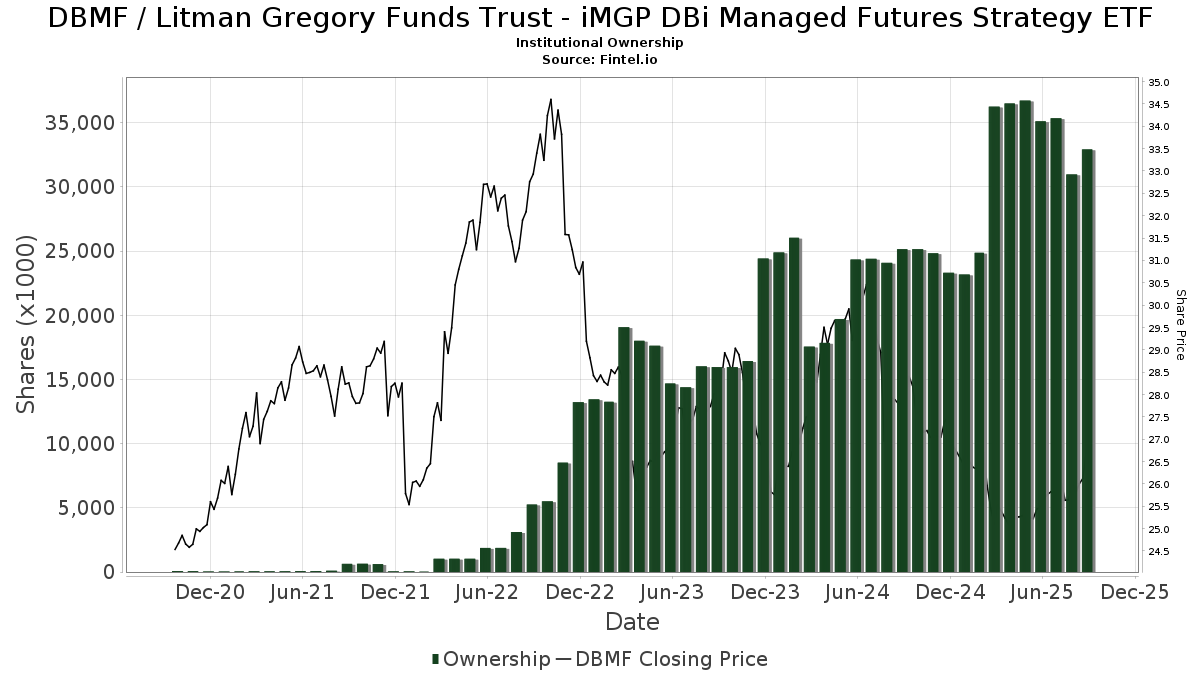
Litman Gregory Funds Trust - iMGP DBi Managed Futures Strategy ETF (US:DBMF) memiliki 192 pemilik institusional dan pemegang saham yang telah mengajukan formulir 13D/G atau 13F kepada Komisi Bursa Efek (Securities Exchange Commission/SEC). Lembaga-lembaga ini memegang total 32,923,553 saham. Pemegang saham terbesar meliputi LPL Financial LLC, Morgan Stanley, Northwestern Mutual Wealth Management Co, Raymond James Financial Inc, Goldstein Advisors, LLC, Litman Gregory Asset Management LLC, Cardinal Point Capital Management, ULC, RAA - SMI 3Fourteen Real Asset Allocation ETF SMI 3Fourteen REAL Asset Allocation ETF, Savant Capital, LLC, and Resources Investment Advisors, LLC. .
Struktur kepemilikan institusional Litman Gregory Funds Trust - iMGP DBi Managed Futures Strategy ETF (ARCA:DBMF) menunjukkan posisi terkini di perusahaan oleh institusi dan dana, serta perubahan terbaru dalam ukuran posisi. Pemegang saham utama dapat mencakup investor individu, reksa dana, dana lindung nilai, atau institusi. Jadwal 13D menunjukkan bahwa investor memegang (atau pernah memegang) lebih dari 5% saham perusahaan dan bermaksud (atau pernah bermaksud) untuk secara aktif mengejar perubahan strategi bisnis. Jadwal 13G menunjukkan investasi pasif lebih dari 5%.
The share price as of September 5, 2025 is 26.37 / share. Previously, on September 6, 2024, the share price was 27.59 / share. This represents a decline of 4.42% over that period.
Skor Sentimen Dana
Skor Sentimen Dana (sebelumnya dikenal sebagai Skor Akumulasi Kepemilikan) menemukan saham-saham yang paling banyak dibeli oleh dana. Ini adalah hasil dari model kuantitatif multi-faktor yang canggih yang mengidentifikasi perusahaan dengan tingkat akumulasi institusional tertinggi. Model penilaian menggunakan kombinasi dari total peningkatan pemilik yang diungkapkan, perubahan dalam alokasi portofolio pada pemilik tersebut, dan metrik lainnya. Angka berkisar dari 0 hingga 100, dengan angka yang lebih tinggi menunjukkan tingkat akumulasi yang lebih tinggi dibandingkan dengan perusahaan sejenisnya, dan 50 adalah rata-ratanya.
Frekuensi Pembaruan: Setiap Hari
Lihat Ownership Explorer, yang menyediakan daftar perusahaan dengan peringkat tertinggi.
Rasio Put/Call Institusional
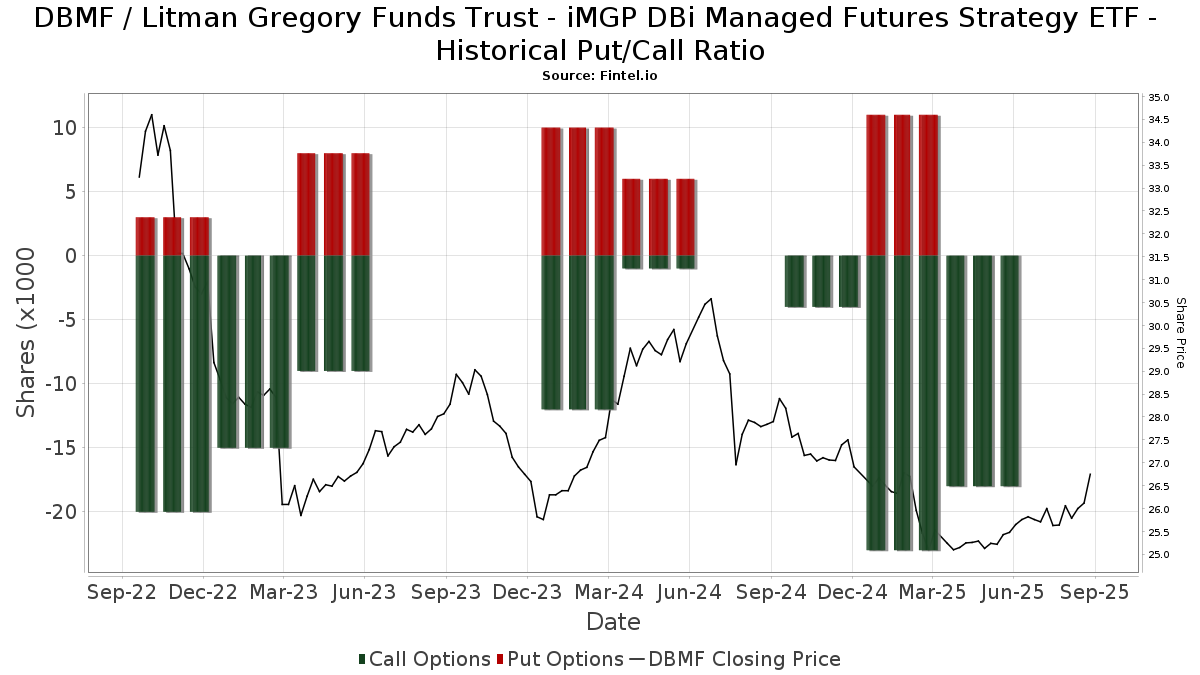
Selain melaporkan isu ekuitas dan utang standar, institusi dengan aset di bawah manajemen lebih dari 100 juta dolar AS juga harus mengungkapkan kepemilikan opsi put dan call mereka. Karena opsi put umumnya menunjukkan sentimen negatif, dan opsi call menunjukkan sentimen positif, kita dapat mengetahui sentimen institusional secara keseluruhan dengan memplot rasio put terhadap call. Grafik di sebelah kanan memplot rasio put/call historis untuk instrumen ini.
Menggunakan Rasio Put/Call sebagai indikator sentimen investor mengatasi salah satu kekurangan utama dari penggunaan total kepemilikan institusional, yaitu sejumlah besar aset yang dikelola diinvestasikan secara pasif untuk melacak indeks. Dana yang dikelola secara pasif biasanya tidak membeli opsi, sehingga indikator rasio put/call lebih akurat dalam melacak sentimen dana yang dikelola secara aktif.
Pengajuan 13F dan NPORT
Detail pada pengajuan 13F tersedia gratis. Detail pada pengajuan NP memerlukan keanggotaan premium. Baris berwarna hijau menunjukkan posisi baru. Baris berwarna merah menunjukkan posisi yang sudah ditutup. Klik tautan ini ikon untuk melihat riwayat transaksi selengkapnya.
Tingkatkan
untuk membuka data premium dan mengekspor ke Excel ![]() .
.
| Tanggal File | Sumber | Investor | Ketik | Presyo ng Avg (Silangan) |
Saham | Δ Saham (%) |
Dilaporkan Nilai ($1000) |
Nilai Δ (%) |
Alokasi Port (%) |
|
|---|---|---|---|---|---|---|---|---|---|---|
| 2025-08-11 | 13F | Trajan Wealth LLC | 25,272 | -15.53 | 650 | -13.91 | ||||
| 2025-08-04 | 13F | IFG Advisory, LLC | 62,396 | 23.82 | 1,605 | 26.18 | ||||
| 2025-07-16 | 13F | Castleview Partners, Llc | 49,055 | 225.84 | 1,262 | 232.11 | ||||
| 2025-04-21 | 13F | Envestnet Portfolio Solutions, Inc. | 0 | -100.00 | 0 | |||||
| 2025-05-08 | 13F | Altiora Financial Group, LLC | 0 | -100.00 | 0 | |||||
| 2025-05-06 | 13F | Proficio Capital Partners LLC | 0 | -100.00 | 0 | -100.00 | ||||
| 2025-07-30 | 13F | Drive Wealth Management, Llc | 0 | -100.00 | 0 | |||||
| 2025-08-12 | 13F | CIBC Private Wealth Group, LLC | 2,621 | 0.00 | 67 | 4.69 | ||||
| 2025-08-05 | 13F | Elyxium Wealth, LLC | 53,320 | 86.81 | 1,372 | 90.42 | ||||
| 2025-07-10 | 13F | Focus Financial Network, Inc. | 9,440 | 12.15 | 243 | 14.15 | ||||
| 2025-05-16 | 13F/A | Kestra Investment Management, LLC | 0 | -100.00 | 0 | |||||
| 2025-07-29 | 13F | Private Trust Co Na | 14,709 | 3.63 | 378 | 5.59 | ||||
| 2025-08-18 | 13F | N.E.W. Advisory Services LLC | 32 | 0.00 | 1 | |||||
| 2025-08-13 | 13F | Cambria Investment Management, L.P. | 266,136 | 6,848 | ||||||
| 2025-05-15 | 13F/A | Orion Portfolio Solutions, LLC | 18,786 | -8.09 | 475 | -11.24 | ||||
| 2025-07-28 | 13F | Innova Wealth Partners | 78,643 | 158.81 | 2,023 | 163.75 | ||||
| 2025-08-14 | 13F | Wells Fargo & Company/mn | 385,626 | -1.47 | 9,922 | 0.36 | ||||
| 2025-07-09 | 13F | Fermata Advisors, LLC | 131,305 | 16.23 | 3,378 | 18.40 | ||||
| 2025-08-14 | 13F | GWM Advisors LLC | 75,884 | 35.22 | 1,953 | 37.76 | ||||
| 2025-05-12 | 13F | Fmr Llc | 0 | -100.00 | 0 | |||||
| 2025-07-25 | 13F | We Are One Seven, LLC | 12,629 | -1.44 | 325 | 0.31 | ||||
| 2025-08-05 | 13F | ALM First Financial Advisors, LLC | 472,305 | 0.00 | 12,152 | 1.86 | ||||
| 2025-08-14 | 13F | Citadel Advisors Llc | Put | 0 | -100.00 | 0 | ||||
| 2025-08-25 | NP | MAINSTAY VP FUNDS TRUST - MainStay VP IQ Hedge Multi-Strategy Portfolio Initial Class | 104,896 | 9.97 | 2,699 | 12.00 | ||||
| 2025-06-24 | NP | TNMAX - 1290 Multi-Alternative Strategies Fund Class A | 88,890 | 16.71 | 2,245 | 11.41 | ||||
| 2025-08-01 | 13F | Solstein Capital, LLC | 35 | 0.00 | 1 | |||||
| 2025-08-14 | 13F | Citadel Advisors Llc | Call | 18,200 | -21.21 | 468 | -19.73 | |||
| 2025-08-14 | 13F | Visionary Wealth Advisors | 43,441 | -14.51 | 1,118 | -12.94 | ||||
| 2025-04-22 | 13F | FMA Wealth Management, LLC | 0 | -100.00 | 0 | -100.00 | ||||
| 2025-08-15 | 13F | Harvest Fund Management Co., Ltd | 1,053 | 0.00 | 0 | |||||
| 2025-08-08 | 13F | Austin Wealth Management, LLC | 559,759 | 23.93 | 14,335 | 25.31 | ||||
| 2025-07-10 | 13F | Wealth Enhancement Advisory Services, Llc | 34,466 | -58.36 | 888 | -57.51 | ||||
| 2025-07-10 | 13F | Rockland Trust Co | 293,140 | 7,542 | ||||||
| 2025-08-11 | 13F | HighTower Advisors, LLC | 0 | -100.00 | 0 | |||||
| 2025-07-28 | 13F | Axxcess Wealth Management, Llc | 362,965 | 42.58 | 9,339 | 45.24 | ||||
| 2025-08-13 | 13F | Quadrature Capital Ltd | 0 | -100.00 | 0 | |||||
| 2025-08-13 | 13F | Northwestern Mutual Wealth Management Co | 1,896,185 | -3.93 | 48,789 | -2.14 | ||||
| 2025-08-14 | 13F | Pinnacle Family Advisors, LLC | 17,684 | 5.51 | 455 | 7.57 | ||||
| 2025-08-08 | 13F | Meridian Wealth Management, LLC | 14,258 | -31.73 | 367 | -30.55 | ||||
| 2025-07-30 | NP | ENDW - Cambria Endowment Style ETF | 94,873 | 2,393 | ||||||
| 2025-07-09 | 13F | Burt Wealth Advisors | 21,460 | 80.32 | 552 | 84.00 | ||||
| 2025-08-15 | 13F | Equitable Holdings, Inc. | 171,614 | 2.51 | 4,416 | 4.42 | ||||
| 2025-08-14 | 13F | Mariner, LLC | 57,195 | -2.86 | 1,472 | -1.08 | ||||
| 2025-07-14 | 13F | Matrix Trust Co | 40,746 | -2.12 | 1 | 0.00 | ||||
| 2025-05-14 | 13F | Atomi Financial Group, Inc. | 0 | -100.00 | 0 | |||||
| 2025-08-14 | 13F | Principia Wealth Advisory, LLC | 200,450 | -5.96 | 5,157 | -3.61 | ||||
| 2025-08-08 | 13F | Avantax Advisory Services, Inc. | 0 | -100.00 | 0 | |||||
| 2025-07-22 | 13F | Wealthcare Advisory Partners LLC | 11,846 | 305 | ||||||
| 2025-05-16 | 13F | Arete Wealth Advisors, LLC | 0 | -100.00 | 0 | |||||
| 2025-07-15 | 13F | FLP Wealth Management, LLC | 0 | -100.00 | 0 | |||||
| 2025-08-14 | 13F | Stansberry Asset Management, Llc | 116,648 | -2.25 | 3,001 | -0.43 | ||||
| 2025-08-08 | 13F | Cetera Investment Advisers | 199,414 | 25.73 | 5,131 | 28.06 | ||||
| 2025-08-06 | 13F | New Millennium Group LLC | 1 | 0 | ||||||
| 2025-05-01 | 13F | Quest 10 Wealth Builders, Inc. | 569 | -38.82 | 14 | -41.67 | ||||
| 2025-07-25 | 13F | R. W. Roge & Company, Inc. | 71,213 | 2 | ||||||
| 2025-08-13 | 13F | GeoWealth Management, LLC | 12,985 | 0.64 | 334 | 2.77 | ||||
| 2025-08-07 | 13F | Howard Bailey Securities, Llc | 52,383 | -2.10 | 1,348 | -0.30 | ||||
| 2025-08-12 | 13F | SRS Capital Advisors, Inc. | 490 | 0.62 | 13 | 0.00 | ||||
| 2025-08-13 | 13F | West Chester Capital Advisors, Inc | 0 | -100.00 | 0 | |||||
| 2025-06-27 | NP | TRTY - Cambria Trinity ETF | 171,263 | 4,326 | ||||||
| 2025-07-25 | 13F | Northwest Capital Management Inc | 492 | 14.95 | 13 | 20.00 | ||||
| 2025-08-07 | 13F | Vise Technologies, Inc. | 0 | -100.00 | 0 | |||||
| 2025-07-03 | 13F | City Center Advisors, LLC | 35,289 | -2.47 | 908 | -0.77 | ||||
| 2025-07-08 | 13F | Zrc Wealth Management, Llc | 2,290 | 0.00 | 59 | 1.75 | ||||
| 2025-08-26 | NP | EQ ADVISORS TRUST - 1290 VT Multi-Alternative Strategies Portfolio Class IB | 42,840 | 1.73 | 1,102 | 3.67 | ||||
| 2025-08-06 | 13F | Ethos Financial Group, LLC | 13,107 | -37.65 | 335 | -38.76 | ||||
| 2025-08-11 | 13F | Citigroup Inc | 5,433 | -45.36 | 140 | -44.62 | ||||
| 2025-08-11 | 13F | Empowered Funds, LLC | 94,873 | 2,441 | ||||||
| 2025-08-12 | 13F | Global Retirement Partners, LLC | 25,841 | 5,088.96 | 665 | 5,007.69 | ||||
| 2025-05-14 | 13F | Legend Financial Advisors, Inc. | 0 | -100.00 | 0 | |||||
| 2025-07-09 | 13F | Dynamic Advisor Solutions LLC | 0 | -100.00 | 0 | |||||
| 2025-07-15 | 13F | Family Investment Center, Inc. | 26,591 | -92.49 | 684 | -92.35 | ||||
| 2025-08-12 | 13F | LPL Financial LLC | 5,156,988 | 5.09 | 132,689 | 7.04 | ||||
| 2025-08-13 | 13F | Renaissance Technologies Llc | 176,400 | 356.99 | 4,539 | 365.44 | ||||
| 2025-08-14 | 13F | Royal Bank Of Canada | 64,115 | 32.37 | 1,650 | 34.91 | ||||
| 2025-08-15 | 13F | WFA of San Diego, LLC | 136 | -80.26 | 3 | -84.21 | ||||
| 2025-08-11 | 13F | Private Advisor Group, LLC | 400,560 | -6.72 | 10,306 | -4.98 | ||||
| 2025-08-13 | 13F | Virtue Capital Management, LLC | 0 | -100.00 | 0 | |||||
| 2025-08-14 | 13F | Ausdal Financial Partners, Inc. | 25,821 | -1.45 | 664 | 0.45 | ||||
| 2025-07-10 | 13F | Exchange Traded Concepts, Llc | 27,384 | 1.36 | 705 | 3.23 | ||||
| 2025-07-23 | 13F | Valmark Advisers, Inc. | 475,069 | -3.99 | 12,224 | -2.21 | ||||
| 2025-08-14 | 13F | Raymond James Financial Inc | 1,285,564 | 54.95 | 33,078 | 57.83 | ||||
| 2025-07-16 | 13F | ORG Partners LLC | 14,785 | 7.01 | 381 | 8.88 | ||||
| 2025-07-18 | 13F | Midwest Financial Group LLC | 71,699 | 4.46 | 1,845 | 6.41 | ||||
| 2025-08-08 | 13F | Creative Planning | 17,424 | -9.37 | 448 | -7.63 | ||||
| 2025-08-01 | 13F | Bessemer Group Inc | 92 | 0.00 | 0 | |||||
| 2025-07-24 | 13F | IFP Advisors, Inc | 1,655 | -14.87 | 43 | -14.29 | ||||
| 2025-08-05 | 13F | Tsfg, Llc | 108 | 0.93 | 0 | |||||
| 2025-05-02 | 13F | Fortress Wealth Group, LLC | 0 | -100.00 | 0 | -100.00 | ||||
| 2025-08-14 | 13F | UBS Group AG | 6,000 | -26.95 | 154 | -25.60 | ||||
| 2025-07-28 | 13F | Fairman Group, LLC | 75,079 | -12.96 | 1,932 | -9.34 | ||||
| 2025-07-24 | 13F | Live Oak Investment Partners | 115,778 | 0.01 | 2,979 | 1.85 | ||||
| 2025-07-18 | 13F | Astor Investment Management LLC | 177,689 | -3.82 | 4,572 | -2.04 | ||||
| 2025-05-02 | 13F | Parcion Private Wealth LLC | 0 | -100.00 | 0 | |||||
| 2025-08-05 | 13F | Bank of New York Mellon Corp | 9,212 | -3.94 | 237 | -2.07 | ||||
| 2025-08-14 | 13F | Hrt Financial Lp | 26,999 | 1 | ||||||
| 2025-07-29 | 13F | Signature Estate & Investment Advisors Llc | 0 | -100.00 | 0 | |||||
| 2025-08-13 | 13F | Truvestments Capital Llc | 0 | -100.00 | 0 | |||||
| 2025-04-25 | 13F | New Wave Wealth Advisors Llc | 0 | -100.00 | 0 | |||||
| 2025-08-14 | 13F | Citadel Advisors Llc | 97,613 | 334.24 | 2,512 | 342.86 | ||||
| 2025-07-30 | 13F | Strategic Blueprint, LLC | 0 | -100.00 | 0 | |||||
| 2025-08-13 | 13F | Transce3nd, LLC | 1,686 | -0.35 | 43 | 2.38 | ||||
| 2025-08-13 | 13F | Legacy Capital Wealth Partners, LLC | 0 | -100.00 | 0 | |||||
| 2025-08-06 | 13F | Entrewealth, Llc | 90,668 | 8.40 | 2,333 | 10.42 | ||||
| 2025-08-07 | 13F | Nwam Llc | 31,991 | 19.32 | 820 | 20.97 | ||||
| 2025-07-11 | 13F | Deane Retirement Strategies, Inc. | 217,648 | 31,171.26 | 5,600 | 32,835.29 | ||||
| 2025-08-11 | 13F | Principal Securities, Inc. | 2,495 | 596.93 | 64 | 611.11 | ||||
| 2025-07-31 | 13F | West Michigan Advisors, Llc | 14,128 | 57.34 | 366 | 61.50 | ||||
| 2025-08-11 | 13F | Perennial Investment Advisors, LLC | 44,928 | 73.47 | 1,156 | 76.76 | ||||
| 2025-08-18 | 13F/A | National Bank Of Canada /fi/ | 37,316 | 2.39 | 960 | 4.24 | ||||
| 2025-07-17 | 13F | Fifth Third Securities, Inc. | 8,873 | -9.54 | 228 | -7.69 | ||||
| 2025-07-23 | 13F | TriaGen Wealth Management LLC | 88,500 | 11.88 | 2,277 | 13.96 | ||||
| 2025-08-12 | 13F | Change Path, LLC | 13,392 | 9.73 | 345 | 11.69 | ||||
| 2025-07-25 | 13F | Cwm, Llc | 194,372 | -93.01 | 5 | -92.86 | ||||
| 2025-07-18 | 13F | Truist Financial Corp | 0 | -100.00 | 0 | |||||
| 2025-08-13 | 13F | Flow Traders U.s. Llc | 29,355 | 1 | ||||||
| 2025-07-03 | 13F | Garde Capital, Inc. | 100 | 3 | ||||||
| 2025-08-14 | 13F | Css Llc/il | 205,764 | 2.02 | 5,294 | 3.93 | ||||
| 2025-07-31 | 13F | Longview Financial Advisors, Inc. | 134,819 | -8.76 | 3,469 | -7.07 | ||||
| 2025-07-14 | 13F | Legacy Capital Group California, Inc. | 45,872 | 2.62 | 1,180 | 4.52 | ||||
| 2025-09-04 | 13F/A | Advisor Group Holdings, Inc. | 39,125 | 75.22 | 1,007 | 78.37 | ||||
| 2025-06-02 | 13F/A | Modern Wealth Management, LLC | 8,541 | 0.31 | 216 | -3.15 | ||||
| 2025-07-16 | 13F | ORG Wealth Partners, LLC | 27,880 | 7.11 | 718 | 8.97 | ||||
| 2025-08-14 | 13F | Sunbelt Securities, Inc. | 64 | 0.00 | 2 | 0.00 | ||||
| 2025-05-15 | 13F | Advisory Services Network, LLC | 0 | -100.00 | 0 | |||||
| 2025-08-13 | 13F | Manning & Napier Advisors Llc | 888 | 23 | ||||||
| 2025-07-11 | 13F | Mkd Wealth Coaches, Llc | 92,434 | 0.01 | 2,378 | 1.89 | ||||
| 2025-07-14 | 13F | Ai Financial Services Llc | 222,129 | 2.48 | 5,715 | 4.40 | ||||
| 2025-08-14 | 13F | Comerica Bank | 24,850 | 19.27 | 639 | 21.48 | ||||
| 2025-07-15 | 13F | Verum Partners LLC | 8,899 | -49.45 | 229 | -48.65 | ||||
| 2025-08-15 | 13F | Kestra Advisory Services, LLC | 15,860 | -22.94 | 408 | -21.39 | ||||
| 2025-07-14 | 13F | E&G Advisors, LP | 72,782 | -3.45 | 1,873 | -1.68 | ||||
| 2025-07-29 | 13F | Sage Private Wealth Group, Llc | 460,951 | 9.99 | 11,860 | 12.03 | ||||
| 2025-05-08 | 13F | Moors & Cabot, Inc. | 0 | -100.00 | 0 | |||||
| 2025-07-24 | 13F | Ronald Blue Trust, Inc. | 50 | 0.00 | 1 | 0.00 | ||||
| 2025-08-14 | 13F | Mml Investors Services, Llc | 66,849 | 4.70 | 2 | 0.00 | ||||
| 2025-05-12 | 13F | Simplex Trading, Llc | 0 | -100.00 | 0 | |||||
| 2025-08-14 | 13F | Toroso Investments, LLC | 339,077 | 140.72 | 8,724 | 145.19 | ||||
| 2025-07-23 | 13F | Citizens National Bank Trust Department | 0 | -100.00 | 0 | |||||
| 2025-08-05 | 13F | Retirement Financial Solutions, Llc | 12,465 | -12.35 | 321 | -10.86 | ||||
| 2025-08-15 | 13F | Morgan Stanley | 2,680,823 | 13.59 | 68,978 | 15.70 | ||||
| 2025-08-05 | 13F | Optivise Advisory Services LLC | 69,008 | 1.78 | 1,776 | 3.68 | ||||
| 2025-07-28 | 13F | Smart Portfolios, LLC | 31,336 | 25.78 | 806 | 28.14 | ||||
| 2025-04-23 | 13F | PMV Capital Advisers, LLC | 0 | -100.00 | 0 | |||||
| 2025-08-04 | 13F | Savvy Advisors, Inc. | 48,641 | 25.96 | 1,252 | 28.31 | ||||
| 2025-04-22 | 13F | World Equity Group, Inc. | 0 | -100.00 | 0 | |||||
| 2025-08-01 | 13F | Envestnet Asset Management Inc | 633,318 | 6.89 | 16,295 | 8.89 | ||||
| 2025-08-29 | NP | RAA - SMI 3Fourteen Real Asset Allocation ETF SMI 3Fourteen REAL Asset Allocation ETF | 958,053 | 218.89 | 24,651 | 224.81 | ||||
| 2025-07-24 | 13F | Stonebridge Financial Group, LLC | 31,508 | 940.21 | 811 | 965.79 | ||||
| 2025-08-14 | 13F | Federation des caisses Desjardins du Quebec | 1,201 | 0.00 | 31 | 0.00 | ||||
| 2025-07-18 | 13F | Trilogy Capital Inc. | 24,044 | 14.35 | 619 | 16.38 | ||||
| 2025-08-11 | 13F | Advisor Resource Council | 9,053 | -96.69 | 233 | -96.53 | ||||
| 2025-08-14 | 13F | Ancora Advisors, LLC | 0 | -100.00 | 0 | |||||
| 2025-08-14 | 13F | Wiley Bros.-aintree Capital, Llc | 10,527 | 271 | ||||||
| 2025-08-07 | 13F | Resources Investment Advisors, LLC. | 689,223 | -1.08 | 17,734 | 0.76 | ||||
| 2025-08-12 | 13F | Integrated Advisors Network LLC | 9,900 | -40.04 | 255 | -39.09 | ||||
| 2025-08-12 | 13F | Proequities, Inc. | 0 | 0 | ||||||
| 2025-04-25 | 13F | Mather Group, Llc. | 0 | -100.00 | 0 | |||||
| 2025-08-29 | 13F | Centaurus Financial, Inc. | 10,785 | 0 | ||||||
| 2025-08-05 | 13F | Scarborough Advisors, LLC | 113,140 | -6.43 | 2,911 | -4.68 | ||||
| 2025-08-01 | 13F | New York Life Investment Management Llc | 474,820 | 19.04 | 12,217 | 21.26 | ||||
| 2025-08-13 | 13F | Empire Financial Management Company, LLC | 204,996 | -0.32 | 5,275 | 1.54 | ||||
| 2025-07-23 | 13F | Columbus Macro, LLC | 36,690 | 944 | ||||||
| 2025-08-14 | 13F | Integrated Wealth Concepts LLC | 28,097 | 5.26 | 723 | 7.12 | ||||
| 2025-08-13 | 13F | IAG Wealth Partners, LLC | 414,567 | 19.85 | 10,667 | 22.08 | ||||
| 2025-07-07 | 13F | Upper Left Wealth Management, LLC | 181,056 | 19.21 | 4,659 | 21.43 | ||||
| 2025-08-06 | 13F | Commonwealth Equity Services, Llc | 498,815 | -25.63 | 13 | -25.00 | ||||
| 2025-07-22 | 13F | Merit Financial Group, LLC | 36,954 | 951 | ||||||
| 2025-07-23 | 13F | Litman Gregory Asset Management LLC | 1,166,894 | -1.13 | 30,024 | 0.71 | ||||
| 2025-08-06 | 13F | Summit Wealth & Retirement Planning, Inc. | 585,899 | 3.96 | 15,075 | 5.89 | ||||
| 2025-08-04 | 13F | Atria Investments Llc | 115,102 | -4.19 | 2,962 | -2.41 | ||||
| 2025-08-08 | 13F | Gts Securities Llc | 0 | -100.00 | 0 | |||||
| 2025-04-15 | 13F | Kozak & Associates, Inc. | 0 | -100.00 | 0 | |||||
| 2025-08-13 | 13F | EverSource Wealth Advisors, LLC | 6,930 | -7.23 | 178 | -5.32 | ||||
| 2025-07-16 | 13F | Octavia Wealth Advisors, LLC | 0 | -100.00 | 0 | |||||
| 2025-07-31 | 13F | Cambridge Investment Research Advisors, Inc. | 196,550 | -6.71 | 5 | 0.00 | ||||
| 2025-08-14 | 13F | Aqr Capital Management Llc | 18,673 | -14.18 | 480 | -12.57 | ||||
| 2025-08-14 | 13F | Susquehanna International Group, Llp | 20,938 | -38.82 | 539 | -37.73 | ||||
| 2025-08-06 | 13F | Wedbush Securities Inc | 18,949 | 3.27 | 0 | |||||
| 2025-07-15 | 13F | Cranbrook Wealth Management, LLC | 0 | -100.00 | 0 | |||||
| 2025-07-21 | 13F | Rainey & Randall Investment Management Inc. | 63,699 | -80.25 | 1,639 | -79.89 | ||||
| 2025-08-12 | 13F | Steward Partners Investment Advisory, Llc | 18,927 | -7.45 | 487 | -5.81 | ||||
| 2025-07-16 | 13F | Perigon Wealth Management, LLC | 8,351 | -5.77 | 215 | -4.04 | ||||
| 2025-08-11 | 13F | Lake Street Financial Llc | 12,904 | -43.17 | 332 | -42.06 | ||||
| 2025-07-22 | 13F | Simplicity Wealth,LLC | 28,924 | 744 | ||||||
| 2025-07-10 | 13F | Professional Financial Advisors, LLC | 179,591 | 8.41 | 4,621 | 10.42 | ||||
| 2025-07-17 | 13F | Sterneck Capital Management, LLC | 44,052 | 1.69 | 1,133 | 3.56 | ||||
| 2025-07-31 | 13F | Brighton Jones Llc | 10,321 | 4.81 | 266 | 6.85 | ||||
| 2025-07-28 | 13F | Naviter Wealth, LLC | 0 | -100.00 | 0 | |||||
| 2025-08-07 | 13F | LFA - Lugano Financial Advisors SA | 11,620 | 0.00 | 299 | 1.71 | ||||
| 2025-08-14 | 13F/A | Rockefeller Capital Management L.P. | 24,552 | 0.00 | 632 | 1.77 | ||||
| 2025-08-14 | 13F | L2 Asset Management, LLC | 9,574 | 246 | ||||||
| 2025-07-21 | 13F | Greenwood Capital Associates Llc | 16,874 | 24.03 | 434 | 26.53 | ||||
| 2025-08-14 | 13F | Stifel Financial Corp | 60,221 | 33.02 | 1,550 | 35.52 | ||||
| 2025-08-14 | 13F | Two Sigma Securities, Llc | 10,342 | 266 | ||||||
| 2025-07-17 | 13F | Raleigh Capital Management Inc. | 3,601 | -8.95 | 93 | -7.07 | ||||
| 2025-06-30 | NP | ASTIX - Astor Dynamic Allocation Fund Class I shares | 79,365 | 0.00 | 2,005 | -4.57 | ||||
| 2025-07-25 | 13F | Concurrent Investment Advisors, LLC | 20,387 | 46.69 | 525 | 49.29 | ||||
| 2025-08-13 | 13F | Avestar Capital, LLC | 156,034 | 8.03 | 4,015 | 10.03 | ||||
| 2025-04-21 | 13F | Nelson, Van Denburg & Campbell Wealth Management Group, LLC | 0 | -100.00 | 0 | |||||
| 2025-04-28 | 13F | DAVENPORT & Co LLC | 0 | -100.00 | 0 | |||||
| 2025-07-31 | 13F | Leelyn Smith, LLC | 259,877 | 2.61 | 6,687 | 4.52 | ||||
| 2025-08-12 | 13F | Financial Advocates Investment Management | 18,891 | 6.61 | 486 | 8.72 | ||||
| 2025-08-14 | 13F | CoreCap Advisors, LLC | 129,462 | 3.31 | 3,331 | 5.24 | ||||
| 2025-08-13 | 13F | Cerity Partners LLC | 30,905 | 0.31 | 795 | 2.19 | ||||
| 2025-08-14 | 13F | Capitolis Liquid Global Markets LLC | 149,300 | -18.01 | 3,841 | -16.48 | ||||
| 2025-08-13 | 13F | Proactive Wealth Strategies LLC | 19,545 | -9.45 | 1 | |||||
| 2025-08-06 | 13F | AE Wealth Management LLC | 25,986 | 21.54 | 669 | 23.70 | ||||
| 2025-07-15 | 13F | Genesis Wealth Advisors, LLC | 10,189 | 0.00 | 262 | 1.95 | ||||
| 2025-07-01 | 13F | Burkett Financial Services, Llc | 0 | -100.00 | 0 | |||||
| 2025-07-28 | 13F | Kiker Wealth Management, LLC | 21 | 0.00 | 1 | |||||
| 2025-08-27 | 13F/A | Brinker Capital Investments, LLC | 18,342 | -2.36 | 472 | -0.63 | ||||
| 2025-07-11 | 13F | Farther Finance Advisors, LLC | 107,476 | -37.84 | 2,765 | -36.80 | ||||
| 2025-05-09 | 13F | Sound Financial Strategies Group, LLC | 0 | -100.00 | 0 | |||||
| 2025-07-21 | 13F | Ashton Thomas Securities, Llc | 133,968 | 3,447 | ||||||
| 2025-07-29 | 13F | Goldstein Advisors, LLC | 1,180,035 | -1.99 | 30,362 | -0.17 | ||||
| 2025-08-12 | 13F | Jpmorgan Chase & Co | 248,279 | 3.75 | 6,388 | 5.67 | ||||
| 2025-04-28 | 13F | Rossby Financial, LCC | 0 | 0 | ||||||
| 2025-08-05 | 13F | Bank Of Montreal /can/ | 22,324 | -0.49 | 574 | 1.41 | ||||
| 2025-07-25 | 13F | RHS Financial, LLC | 50,250 | -5.47 | 1,293 | -3.73 | ||||
| 2025-07-24 | 13F | Eastern Bank | 0 | -100.00 | 0 | |||||
| 2025-07-15 | 13F | Fortitude Family Office, LLC | 339,371 | 9.16 | 8,732 | 11.21 | ||||
| 2025-08-13 | 13F | Baird Financial Group, Inc. | 171,235 | -2.68 | 4,406 | -0.88 | ||||
| 2025-07-24 | 13F | Us Bancorp \de\ | 360 | -50.14 | 9 | -50.00 | ||||
| 2025-08-14 | 13F | Hilltop Holdings Inc. | 76,306 | 0.39 | 1,963 | 2.29 | ||||
| 2025-07-28 | 13F | Harbour Investments, Inc. | 8,933 | 8.48 | 230 | 10.10 | ||||
| 2025-08-15 | 13F | Captrust Financial Advisors | 81,817 | -18.50 | 2,105 | -16.96 | ||||
| 2025-07-31 | 13F | Oppenheimer & Co Inc | 0 | -100.00 | 0 | |||||
| 2025-08-13 | 13F | Johnson Financial Group, Inc. | 164 | 4 | ||||||
| 2025-06-26 | NP | FARX - Frontier Asset Absolute Return ETF | 27,016 | -6.38 | 682 | -10.62 | ||||
| 2025-08-06 | 13F | Savant Capital, LLC | 704,535 | 54.00 | 18,128 | 56.86 | ||||
| 2025-07-11 | 13F | UMA Financial Services, Inc. | 0 | -100.00 | 0 | |||||
| 2025-06-25 | NP | QAI - IQ Hedge Multi-Strategy Tracker ETF | 353,804 | 17.72 | 8,937 | 12.34 | ||||
| 2025-08-11 | 13F | Inspire Advisors, LLC | 8,032 | 207 | ||||||
| 2025-07-16 | 13F | Twelve Points Wealth Management LLC | 66,857 | 0.09 | 1,720 | 1.96 | ||||
| 2025-04-15 | 13F | Reuter James Wealth Management, Llc | 0 | -100.00 | 0 | |||||
| 2025-08-12 | 13F | Frontier Asset Management, LLC | 65,772 | -48.94 | 1,692 | -47.99 | ||||
| 2025-08-12 | 13F | MAI Capital Management | 40,749 | -13.70 | 1,048 | -12.08 | ||||
| 2025-05-23 | 13F | SWAN Capital LLC | 0 | -100.00 | 0 | |||||
| 2025-07-31 | 13F | Cardinal Point Capital Management, ULC | 1,084,995 | -0.26 | 27,917 | 1.59 | ||||
| 2025-08-08 | 13F | Advyzon Investment Management, LLC | 10,994 | 4.32 | 283 | 6.02 | ||||
| 2025-08-14 | 13F | Family Office Research LLC | 32,487 | 29.58 | 836 | 31.91 | ||||
| 2025-08-04 | 13F | Creekmur Asset Management LLC | 426 | 9.79 | 11 | 11.11 | ||||
| 2025-08-14 | 13F | Bank Of America Corp /de/ | 33,263 | 3.99 | 856 | 5.95 |