Mga Batayang Estadistika
| Pemilik Institusional | 193 total, 193 long only, 0 short only, 0 long/short - change of 6.56% MRQ |
| Alokasi Portofolio Rata-rata | 0.2430 % - change of 23.44% MRQ |
| Saham Institusional (Jangka Panjang) | 8,385,950 (ex 13D/G) - change of 0.51MM shares 6.46% MRQ |
| Nilai Institusional (Jangka Panjang) | $ 606,543 USD ($1000) |
Kepemilikan Institusional dan Pemegang Saham
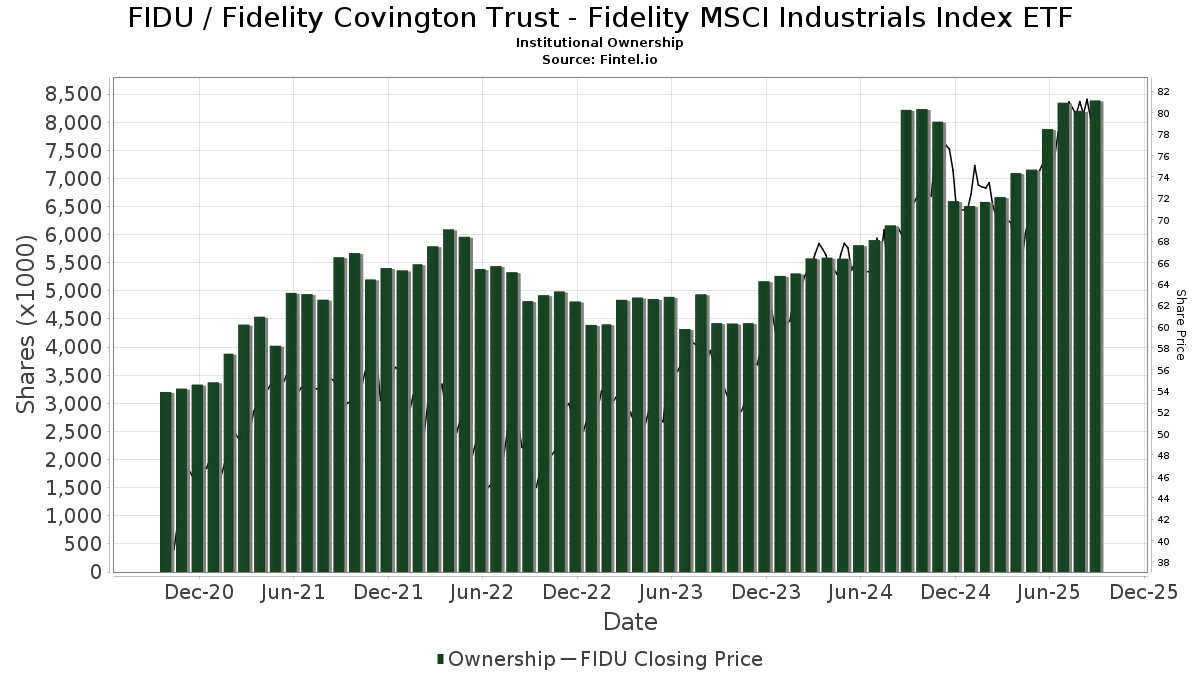
Fidelity Covington Trust - Fidelity MSCI Industrials Index ETF (US:FIDU) memiliki 193 pemilik institusional dan pemegang saham yang telah mengajukan formulir 13D/G atau 13F kepada Komisi Bursa Efek (Securities Exchange Commission/SEC). Lembaga-lembaga ini memegang total 8,385,950 saham. Pemegang saham terbesar meliputi Lido Advisors, LLC, AE Wealth Management LLC, Northwestern Mutual Wealth Management Co, Northern Lights Fund Trust - PFG Fidelity Institutional AM® Equity Sector Strategy Fund Class R Shares, Commonwealth Equity Services, Llc, Agf Management Ltd, Morgan Stanley, LPL Financial LLC, Full Sail Capital, LLC, and HighTower Advisors, LLC .
Struktur kepemilikan institusional Fidelity Covington Trust - Fidelity MSCI Industrials Index ETF (ARCA:FIDU) menunjukkan posisi terkini di perusahaan oleh institusi dan dana, serta perubahan terbaru dalam ukuran posisi. Pemegang saham utama dapat mencakup investor individu, reksa dana, dana lindung nilai, atau institusi. Jadwal 13D menunjukkan bahwa investor memegang (atau pernah memegang) lebih dari 5% saham perusahaan dan bermaksud (atau pernah bermaksud) untuk secara aktif mengejar perubahan strategi bisnis. Jadwal 13G menunjukkan investasi pasif lebih dari 5%.
The share price as of September 5, 2025 is 80.19 / share. Previously, on September 6, 2024, the share price was 66.92 / share. This represents an increase of 19.83% over that period.
Skor Sentimen Dana
Skor Sentimen Dana (sebelumnya dikenal sebagai Skor Akumulasi Kepemilikan) menemukan saham-saham yang paling banyak dibeli oleh dana. Ini adalah hasil dari model kuantitatif multi-faktor yang canggih yang mengidentifikasi perusahaan dengan tingkat akumulasi institusional tertinggi. Model penilaian menggunakan kombinasi dari total peningkatan pemilik yang diungkapkan, perubahan dalam alokasi portofolio pada pemilik tersebut, dan metrik lainnya. Angka berkisar dari 0 hingga 100, dengan angka yang lebih tinggi menunjukkan tingkat akumulasi yang lebih tinggi dibandingkan dengan perusahaan sejenisnya, dan 50 adalah rata-ratanya.
Frekuensi Pembaruan: Setiap Hari
Lihat Ownership Explorer, yang menyediakan daftar perusahaan dengan peringkat tertinggi.
Rasio Put/Call Institusional
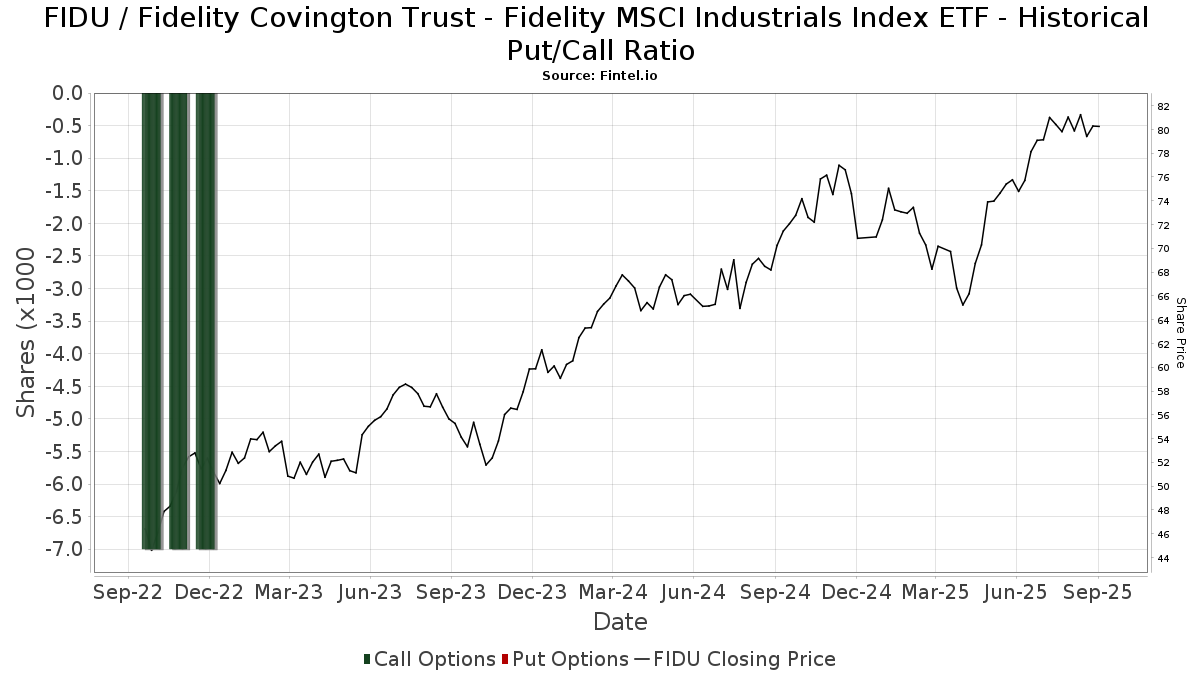
Selain melaporkan isu ekuitas dan utang standar, institusi dengan aset di bawah manajemen lebih dari 100 juta dolar AS juga harus mengungkapkan kepemilikan opsi put dan call mereka. Karena opsi put umumnya menunjukkan sentimen negatif, dan opsi call menunjukkan sentimen positif, kita dapat mengetahui sentimen institusional secara keseluruhan dengan memplot rasio put terhadap call. Grafik di sebelah kanan memplot rasio put/call historis untuk instrumen ini.
Menggunakan Rasio Put/Call sebagai indikator sentimen investor mengatasi salah satu kekurangan utama dari penggunaan total kepemilikan institusional, yaitu sejumlah besar aset yang dikelola diinvestasikan secara pasif untuk melacak indeks. Dana yang dikelola secara pasif biasanya tidak membeli opsi, sehingga indikator rasio put/call lebih akurat dalam melacak sentimen dana yang dikelola secara aktif.
Pengajuan 13F dan NPORT
Detail pada pengajuan 13F tersedia gratis. Detail pada pengajuan NP memerlukan keanggotaan premium. Baris berwarna hijau menunjukkan posisi baru. Baris berwarna merah menunjukkan posisi yang sudah ditutup. Klik tautan ini ikon untuk melihat riwayat transaksi selengkapnya.
Tingkatkan
untuk membuka data premium dan mengekspor ke Excel ![]() .
.
| Tanggal File | Sumber | Investor | Ketik | Presyo ng Avg (Silangan) |
Saham | Δ Saham (%) |
Dilaporkan Nilai ($1000) |
Nilai Δ (%) |
Alokasi Port (%) |
|
|---|---|---|---|---|---|---|---|---|---|---|
| 2025-07-17 | 13F | Janney Montgomery Scott LLC | 4,170 | 0.24 | 0 | |||||
| 2025-08-29 | 13F | Centaurus Financial, Inc. | 6,577 | -5.30 | 1 | |||||
| 2025-08-14 | 13F | Full Sail Capital, LLC | 146,950 | 6.16 | 11,393 | 20.19 | ||||
| 2025-08-14 | 13F | Susquehanna International Group, Llp | 0 | -100.00 | 0 | |||||
| 2025-08-15 | 13F | Kestra Advisory Services, LLC | 75,899 | 1.28 | 5,884 | 14.68 | ||||
| 2025-08-14 | 13F | Snowden Capital Advisors LLC | 15,045 | -4.18 | 1,166 | 8.47 | ||||
| 2025-08-04 | 13F | Creative Financial Designs Inc /adv | 633 | 0.00 | 49 | 13.95 | ||||
| 2025-08-08 | 13F | Capital Investment Advisory Services, LLC | 262 | 0.00 | 20 | 17.65 | ||||
| 2025-08-12 | 13F | Integrated Advisors Network LLC | 6,955 | -38.78 | 539 | -30.63 | ||||
| 2025-08-13 | 13F | Rsm Us Wealth Management Llc | 2,757 | 214 | ||||||
| 2025-08-07 | 13F | Kestra Private Wealth Services, Llc | 30,012 | 3.55 | 2,327 | 17.24 | ||||
| 2025-08-08 | 13F | IMA Wealth, Inc. | 33 | 0.00 | 3 | 0.00 | ||||
| 2025-08-14 | 13F | Stifel Financial Corp | 70,451 | 0.17 | 5,462 | 13.44 | ||||
| 2025-07-22 | 13F | Valley National Advisers Inc | 0 | -100.00 | 0 | |||||
| 2025-08-01 | 13F | Envestnet Asset Management Inc | 66,869 | 48.69 | 5,184 | 68.37 | ||||
| 2025-07-21 | 13F | Ameritas Advisory Services, LLC | 7,099 | -14.14 | 550 | -3.00 | ||||
| 2025-08-05 | 13F | Simplex Trading, Llc | 484 | 63.51 | 0 | |||||
| 2025-07-02 | 13F | Crumly & Associates Inc. | 4,175 | 0.00 | 324 | 13.33 | ||||
| 2025-08-05 | 13F | Smith Shellnut Wilson Llc /adv | 14,677 | -1.10 | 1,138 | 11.91 | ||||
| 2025-08-12 | 13F | Atlas Capital Advisors Llc | 37,608 | -1.24 | 2,916 | 11.81 | ||||
| 2025-08-14 | 13F | Jane Street Group, Llc | 0 | -100.00 | 0 | |||||
| 2025-08-14 | 13F | Goldman Sachs Group Inc | 0 | -100.00 | 0 | |||||
| 2025-07-17 | 13F | Wolff Wiese Magana Llc | 25 | 0.00 | 2 | 0.00 | ||||
| 2025-08-12 | 13F | Proequities, Inc. | 0 | 0 | ||||||
| 2025-08-13 | 13F | SCS Capital Management LLC | 7,955 | 0.00 | 617 | 13.24 | ||||
| 2025-07-14 | 13F | Ridgewood Investments LLC | 132 | 0.00 | 10 | 11.11 | ||||
| 2025-07-16 | 13F | Fischer Financial Services, Inc. | 59,351 | 0.40 | 4,601 | 13.69 | ||||
| 2025-08-14 | 13F | Mercer Global Advisors Inc /adv | 2,734 | 212 | ||||||
| 2025-05-01 | 13F | Grant/GrossMendelsohn, LLC | 0 | -100.00 | 0 | |||||
| 2025-08-07 | 13F | Fidelis Capital Partners, LLC | 2,669 | 213 | ||||||
| 2025-07-28 | 13F | Mutual Advisors, LLC | 17,759 | 0.51 | 1,454 | 21.39 | ||||
| 2025-05-15 | 13F/A | Orion Portfolio Solutions, LLC | 6,130 | 22.75 | 420 | 19.37 | ||||
| 2025-08-04 | 13F | Pensionmark Financial Group, Llc | 3,502 | 0.00 | 272 | 13.39 | ||||
| 2025-08-11 | 13F | TD Waterhouse Canada Inc. | 0 | -100.00 | 0 | |||||
| 2025-07-25 | 13F | We Are One Seven, LLC | 10,762 | -2.18 | 834 | 10.76 | ||||
| 2025-08-08 | 13F | Pnc Financial Services Group, Inc. | 378 | 51.20 | 29 | 70.59 | ||||
| 2025-08-11 | 13F | Mach-1 Financial Group, Inc. | 0 | -100.00 | 0 | |||||
| 2025-08-14 | 13F | Sunbelt Securities, Inc. | 22,244 | 47.97 | 1,564 | 51.90 | ||||
| 2025-08-12 | 13F | Jpmorgan Chase & Co | 944 | 1,866.67 | 73 | 2,333.33 | ||||
| 2025-04-21 | 13F | Nelson, Van Denburg & Campbell Wealth Management Group, LLC | 0 | -100.00 | 0 | |||||
| 2025-07-30 | 13F | Brookstone Capital Management | 3,467 | -7.32 | 269 | 4.69 | ||||
| 2025-07-22 | 13F | Yoder Wealth Management, Inc. | 69,564 | 6.91 | 5,393 | 21.05 | ||||
| 2025-08-12 | 13F | Steward Partners Investment Advisory, Llc | 2,124 | 165 | ||||||
| 2025-07-17 | 13F | CWA Asset Management Group, LLC | 5,046 | 0.02 | 391 | 13.33 | ||||
| 2025-07-29 | 13F | Harbor Asset Planning, Inc. | 2,678 | 208 | ||||||
| 2025-05-13 | 13F | Coston, McIsaac & Partners | 0 | -100.00 | 0 | |||||
| 2025-07-29 | 13F | AssuredPartners Investment Advisors, LLC | 3,424 | -25.77 | 265 | -15.87 | ||||
| 2025-08-14 | 13F | GWM Advisors LLC | 90,793 | -2.21 | 7,039 | 10.73 | ||||
| 2025-04-24 | 13F | HighMark Wealth Management LLC | 0 | -100.00 | 0 | |||||
| 2025-04-21 | 13F | Ronald Blue Trust, Inc. | 0 | -100.00 | 0 | -100.00 | ||||
| 2025-07-16 | 13F | Signature Resources Capital Management, LLC | 554 | 43 | ||||||
| 2025-07-30 | 13F | Gables Capital Management Inc. | 245 | 0.00 | 19 | 12.50 | ||||
| 2025-08-13 | 13F | KDK Private Wealth Management, LLC | 26,637 | -1.05 | 2,065 | 12.05 | ||||
| 2025-07-31 | 13F | Cambridge Investment Research Advisors, Inc. | 17,980 | -5.53 | 1 | 0.00 | ||||
| 2025-08-01 | 13F | Penobscot Wealth Management | 29,376 | 9.18 | 2,278 | 23.62 | ||||
| 2025-08-06 | 13F | AE Wealth Management LLC | 934,788 | 1.13 | 72,474 | 14.51 | ||||
| 2025-08-06 | 13F | Agf Management Ltd | 287,911 | 1.50 | 22,322 | 14.93 | ||||
| 2025-08-12 | 13F | SRS Capital Advisors, Inc. | 417 | 317.00 | 32 | 433.33 | ||||
| 2025-08-08 | 13F | Cetera Investment Advisers | 33,859 | 2.19 | 2,625 | 15.74 | ||||
| 2025-07-30 | 13F | Evermay Wealth Management Llc | 12 | 0.00 | 1 | |||||
| 2025-08-12 | 13F | Armor Investment Advisors, LLC | 43,102 | -1.29 | 3,342 | 11.78 | ||||
| 2025-08-12 | 13F | O'shaughnessy Asset Management, Llc | 19,888 | 22.64 | 1,542 | 38.83 | ||||
| 2025-08-08 | 13F | Meridian Wealth Management, LLC | 10,436 | -4.18 | 809 | 8.59 | ||||
| 2025-08-13 | 13F | River Wealth Advisors LLC | 2,715 | 210 | ||||||
| 2025-07-22 | 13F | Fortitude Advisory Group L.L.C. | 3,122 | 242 | ||||||
| 2025-08-13 | 13F | Jones Financial Companies Lllp | 8,633 | 22.98 | 667 | 39.54 | ||||
| 2025-05-02 | 13F | Capital A Wealth Management, LLC | 83 | 260.87 | 6 | 400.00 | ||||
| 2025-08-07 | 13F | Allworth Financial LP | 31 | 0.00 | 2 | 0.00 | ||||
| 2025-08-05 | 13F | Sigma Planning Corp | 4,000 | -0.67 | 310 | 12.73 | ||||
| 2025-07-25 | 13F | Cwm, Llc | 578 | 0.00 | 0 | |||||
| 2025-07-02 | 13F | HBW Advisory Services LLC | 2,791 | 216 | ||||||
| 2025-07-30 | 13F | Retirement Planning Group | 4,797 | 372 | ||||||
| 2025-04-23 | 13F | Aspetuck Financial Management LLC | 0 | -100.00 | 0 | -100.00 | ||||
| 2025-07-31 | 13F | BIP Wealth, LLC | 3,225 | 0.28 | 250 | 13.64 | ||||
| 2025-08-14 | 13F | UBS Group AG | 13,136 | 220.23 | 1,018 | 263.57 | ||||
| 2025-08-14 | 13F | Fmr Llc | 66,058 | 10.71 | 5,122 | 25.36 | ||||
| 2025-08-14 | 13F | Wells Fargo & Company/mn | 111,840 | 100.91 | 8,671 | 127.50 | ||||
| 2025-08-14 | 13F | CoreCap Advisors, LLC | 2,057 | 60.08 | 159 | 82.76 | ||||
| 2025-07-28 | 13F | Harbour Investments, Inc. | 228 | 0.00 | 18 | 13.33 | ||||
| 2025-05-01 | 13F | Stephens Inc /ar/ | 0 | -100.00 | 0 | |||||
| 2025-08-07 | 13F | Montag A & Associates Inc | 11,434 | 2.63 | 886 | 16.27 | ||||
| 2025-08-05 | 13F | Dunhill Financial, LLC | 1,686 | 131 | ||||||
| 2025-04-29 | 13F | Element Wealth, LLC | 0 | -100.00 | 0 | |||||
| 2025-08-12 | 13F | CIBC Private Wealth Group, LLC | 1 | -97.50 | 0 | -100.00 | ||||
| 2025-07-15 | 13F | Missouri Trust & Investment Co | 300 | 0.00 | 23 | 15.00 | ||||
| 2025-08-14 | 13F | Kovitz Investment Group Partners, LLC | 98,860 | 231.92 | 7,665 | 275.87 | ||||
| 2025-08-19 | 13F | Advisory Services Network, LLC | 9,194 | -22.62 | 739 | -9.10 | ||||
| 2025-08-01 | 13F | Chilton Capital Management Llc | 100 | 0.00 | 8 | 16.67 | ||||
| 2025-07-09 | 13F | Tounjian Advisory Partners, Llc | 21,010 | -1.61 | 1,439 | -1.64 | ||||
| 2025-08-12 | 13F | Minot DeBlois Advisors LLC | 65 | 0.00 | 5 | 25.00 | ||||
| 2025-07-08 | 13F | Nbc Securities, Inc. | 140 | 0.00 | 0 | |||||
| 2025-08-13 | 13F | Summit Financial, LLC | 5,835 | -12.26 | 452 | -0.66 | ||||
| 2025-08-14 | 13F | Raymond James Financial Inc | 9,514 | 10.36 | 738 | 24.92 | ||||
| 2025-07-24 | 13F | IFP Advisors, Inc | 427 | -58.42 | 33 | -52.86 | ||||
| 2025-08-08 | NP | QALTX - Quantified Alternative Investment Fund Investor Class Shares | 3,536 | -49.03 | 274 | -43.74 | ||||
| 2025-07-21 | 13F | Hilltop National Bank | 390 | 0.00 | 30 | 11.11 | ||||
| 2025-08-26 | 13F/A | Thrivent Financial For Lutherans | 76,846 | -16.47 | 6 | -16.67 | ||||
| 2025-08-05 | 13F | Lifeworks Advisors, LLC | 46,413 | -10.44 | 3,598 | 1.41 | ||||
| 2025-07-18 | 13F | Truist Financial Corp | 20,209 | -5.86 | 1,567 | 6.60 | ||||
| 2025-07-25 | 13F | Atria Wealth Solutions, Inc. | 17,471 | -11.55 | 1,376 | 1.70 | ||||
| 2025-08-14 | 13F | Federation des caisses Desjardins du Quebec | 1,905 | 148 | ||||||
| 2025-07-17 | 13F | Fifth Third Securities, Inc. | 27,519 | 2.52 | 2,134 | 16.11 | ||||
| 2025-08-14 | 13F | Boston Private Wealth Llc | 2,962 | 230 | ||||||
| 2025-07-28 | 13F | Rosenberg Matthew Hamilton | 2,886 | 0.00 | 224 | 13.20 | ||||
| 2025-09-04 | 13F/A | Advisor Group Holdings, Inc. | 48,645 | -29.47 | 3,785 | -20.06 | ||||
| 2025-05-16 | 13F | Arete Wealth Advisors, LLC | 0 | -100.00 | 0 | |||||
| 2025-08-15 | 13F | Tower Research Capital LLC (TRC) | 19 | -99.89 | 1 | -99.91 | ||||
| 2025-08-05 | 13F | Advisors Preferred, LLC | 3,536 | 276 | ||||||
| 2025-07-23 | 13F | Monte Financial Group, LLC | 3,442 | -1.71 | 267 | 15.65 | ||||
| 2025-07-22 | 13F | Grimes & Company, Inc. | 4,078 | 316 | ||||||
| 2025-05-09 | 13F | Briaud Financial Planning, Inc | 0 | -100.00 | 0 | |||||
| 2025-04-10 | 13F | Secure Asset Management, LLC | 0 | -100.00 | 0 | -100.00 | ||||
| 2025-08-14 | 13F | Mml Investors Services, Llc | 16,810 | -76.17 | 1 | -75.00 | ||||
| 2025-07-14 | 13F | Buska Wealth Management, LLC | 97,427 | -26.74 | 7,554 | -17.05 | ||||
| 2025-06-30 | NP | Northern Lights Fund Trust - PFG Fidelity Institutional AM® Equity Sector Strategy Fund Class R Shares | 864,020 | 118.36 | 59,384 | 103.77 | ||||
| 2025-07-09 | 13F | Bank of New Hampshire | 108 | 0.00 | 8 | 14.29 | ||||
| 2025-08-08 | 13F | Larson Financial Group LLC | 4,131 | 0.29 | 320 | 13.48 | ||||
| 2025-08-13 | 13F | Level Four Advisory Services, Llc | 14,214 | -0.04 | 1,102 | 13.26 | ||||
| 2025-07-15 | 13F | Define Financial, Llc | 3,029 | 235 | ||||||
| 2025-07-22 | 13F | PUREfi Wealth, LLC | 5,395 | 0.00 | 418 | 13.28 | ||||
| 2025-08-11 | 13F | Aptus Capital Advisors, LLC | 59 | 0.00 | 5 | 0.00 | ||||
| 2025-07-07 | 13F | Nova Wealth Management, Inc. | 9,641 | -16.14 | 747 | -5.08 | ||||
| 2025-07-11 | 13F | Farther Finance Advisors, LLC | 9 | -68.97 | 1 | -100.00 | ||||
| 2025-07-25 | 13F | Valley Brook Capital Group, Inc. | 5,562 | 1.37 | 431 | 14.93 | ||||
| 2025-07-30 | 13F | Bogart Wealth, LLC | 2,295 | 0.00 | 178 | 12.74 | ||||
| 2025-08-11 | 13F | Kingdom Financial Group LLC. | 2,762 | 214 | ||||||
| 2025-07-15 | 13F | Lynch & Associates/in | 25,388 | 5.20 | 1,968 | 19.13 | ||||
| 2025-05-01 | 13F | Quest 10 Wealth Builders, Inc. | 20 | 1 | ||||||
| 2025-07-22 | 13F | One Wealth Management Investment & Advisory Services, LLC | 4,996 | -0.89 | 387 | 12.17 | ||||
| 2025-08-27 | 13F/A | Brinker Capital Investments, LLC | 7,120 | 16.15 | 552 | 31.74 | ||||
| 2025-04-23 | 13F | PMV Capital Advisers, LLC | 0 | -100.00 | 0 | |||||
| 2025-07-23 | 13F | Heck Capital Advisors, LLC | 12,109 | 1.91 | 939 | 15.38 | ||||
| 2025-07-31 | 13F | Sage Mountain Advisors LLC | 1,104 | 0.00 | 86 | 13.33 | ||||
| 2025-08-14 | 13F | Qube Research & Technologies Ltd | 120 | 9 | ||||||
| 2025-08-05 | 13F | Trail Ridge Investment Advisors, LLC | 15,185 | -4.15 | 1,221 | 12.64 | ||||
| 2025-07-24 | 13F | Us Bancorp \de\ | 851 | 66 | ||||||
| 2025-08-11 | 13F | HighTower Advisors, LLC | 138,329 | 75.40 | 10,725 | 98.63 | ||||
| 2025-08-13 | 13F | Whalerock Point Partners, Llc | 5,890 | 0.00 | 457 | 13.15 | ||||
| 2025-08-05 | 13F | EPG Wealth Management LLC | 30,506 | -0.74 | 2,365 | 12.40 | ||||
| 2025-08-12 | 13F | MAI Capital Management | 179 | 0.00 | 14 | 8.33 | ||||
| 2025-07-16 | 13F/A | CX Institutional | 545 | -16.54 | 0 | |||||
| 2025-07-18 | 13F | Vicus Capital | 0 | -100.00 | 0 | |||||
| 2025-08-01 | 13F | SYM FINANCIAL Corp | 365 | 28 | ||||||
| 2025-08-13 | 13F | Continuum Advisory, LLC | 8,231 | -3.44 | 638 | 9.43 | ||||
| 2025-08-14 | 13F | Bank Of America Corp /de/ | 107,444 | -11.33 | 8,330 | 0.41 | ||||
| 2025-08-12 | 13F | J.w. Cole Advisors, Inc. | 4,928 | 382 | ||||||
| 2025-08-14 | 13F | Modern Wealth Management, LLC | 52,981 | 6.39 | 4,108 | 20.48 | ||||
| 2025-08-14 | 13F | DecisionPoint Financial, LLC | 108 | 0.00 | 8 | 14.29 | ||||
| 2025-07-16 | 13F | Essex Financial Services, Inc. | 13,076 | 10.53 | 1,014 | 25.22 | ||||
| 2025-08-04 | 13F | Canton Hathaway, LLC | 2,300 | 0.00 | 0 | |||||
| 2025-08-21 | 13F | Pathway Financial Advisers, LLC | 3,821 | 6.20 | 296 | 20.33 | ||||
| 2025-07-07 | 13F | Trust Co Of Oklahoma | 15,690 | 2.37 | 1,216 | 15.92 | ||||
| 2025-08-14 | 13F | Hurley Capital, LLC | 2,017 | 0.05 | 156 | 13.04 | ||||
| 2025-08-01 | 13F | Bessemer Group Inc | 0 | -100.00 | 0 | |||||
| 2025-08-14 | 13F | Evergreen Wealth Solutions, LLC | 2,690 | 209 | ||||||
| 2025-07-30 | 13F | Princeton Global Asset Management LLC | 518 | 0.00 | 40 | 14.29 | ||||
| 2025-08-12 | 13F | Franklin Resources Inc | 0 | -100.00 | 0 | |||||
| 2025-08-25 | 13F/A | Promus Capital, LLC | 99 | 0.00 | 8 | 16.67 | ||||
| 2025-08-06 | 13F | Decker Retirement Planning Inc. | 434 | 0.00 | 34 | 13.79 | ||||
| 2025-08-08 | 13F | Creative Planning | 2,925 | 227 | ||||||
| 2025-09-03 | 13F | Q3 Asset Management | 5,161 | 0 | ||||||
| 2025-08-13 | 13F | Transce3nd, LLC | 312 | 24 | ||||||
| 2025-08-07 | 13F | Traynor Capital Management, Inc. | 60,427 | 0.62 | 4,708 | 14.52 | ||||
| 2025-08-14 | 13F | Glen Eagle Advisors, LLC | 116 | 0.00 | 9 | 14.29 | ||||
| 2025-08-08 | 13F | Independence Financial Advisors, LLC | 83,950 | -4.85 | 6,509 | 7.73 | ||||
| 2025-08-14 | 13F | IHT Wealth Management, LLC | 43,295 | 6.80 | 3,357 | 20.94 | ||||
| 2025-07-21 | 13F | DHJJ Financial Advisors, Ltd. | 67 | 48.89 | 5 | 66.67 | ||||
| 2025-08-12 | 13F | Global Retirement Partners, LLC | 1,554 | -0.45 | 120 | 10.09 | ||||
| 2025-07-28 | 13F | Kiker Wealth Management, LLC | 0 | -100.00 | 0 | |||||
| 2025-08-04 | 13F | Arkadios Wealth Advisors | 32,935 | -0.28 | 2,553 | 12.91 | ||||
| 2025-08-12 | 13F | PKS Advisory Services, LLC | 4,921 | -12.45 | 382 | -0.78 | ||||
| 2025-08-11 | 13F | Elite Financial, Inc. | 0 | -100.00 | 0 | |||||
| 2025-07-14 | 13F | U.S. Capital Wealth Advisors, LLC | 32,419 | 6.21 | 2,513 | 20.30 | ||||
| 2025-04-28 | 13F | Mainstream Capital Management LLC | 0 | -100.00 | 0 | |||||
| 2025-08-13 | 13F | Colonial Trust Co / SC | 559 | -18.87 | 43 | -8.51 | ||||
| 2025-07-07 | 13F | Roxbury Financial LLC | 14,660 | -1.33 | 1,137 | 6.57 | ||||
| 2025-08-11 | 13F | Beaumont Capital Management, LLC | 0 | -100.00 | 0 | |||||
| 2025-07-16 | 13F | American National Bank | 11,086 | 3.54 | 859 | 17.19 | ||||
| 2025-08-01 | 13F | Purkiss Capital Advisors LLC | 3,440 | 267 | ||||||
| 2025-08-13 | 13F | Townsquare Capital Llc | 0 | -100.00 | 0 | |||||
| 2025-07-08 | 13F | Parallel Advisors, LLC | 250 | 0.00 | 19 | 11.76 | ||||
| 2025-05-12 | 13F | Ameritas Investment Partners, Inc. | 0 | -100.00 | 0 | |||||
| 2025-08-06 | 13F | Stonebridge Financial Planning Group, LLC | 16,547 | 1.81 | 1,283 | 15.29 | ||||
| 2025-08-13 | 13F | Northwestern Mutual Wealth Management Co | 882,815 | 16.98 | 68,445 | 32.45 | ||||
| 2025-08-11 | 13F | Vista Cima Wealth Management LLC | 0 | -100.00 | 0 | -100.00 | ||||
| 2025-08-14 | 13F | Ausdal Financial Partners, Inc. | 3,935 | 0.28 | 305 | 13.81 | ||||
| 2025-08-05 | 13F | Bank Of Montreal /can/ | 500 | -54.83 | 39 | -49.33 | ||||
| 2025-07-10 | 13F | Selective Wealth Management, Inc. | 2,746 | 217 | ||||||
| 2025-07-29 | 13F | Primoris Wealth Advisors, Llc | 7,479 | -16.94 | 580 | -6.01 | ||||
| 2025-07-30 | 13F | IMG Wealth Management, Inc. | 29 | 2 | ||||||
| 2025-08-05 | 13F | Huntington National Bank | 4 | -50.00 | ||||||
| 2025-08-12 | 13F | Pathstone Holdings, LLC | 4,646 | -44.27 | 360 | -36.95 | ||||
| 2025-08-01 | 13F | Schmidt P J Investment Management Inc | 6,051 | -4.50 | 469 | 8.31 | ||||
| 2025-08-14 | 13F | Comerica Bank | 3,139 | 15.49 | 243 | 30.65 | ||||
| 2025-08-14 | 13F | Mariner, LLC | 15,473 | 11.58 | 1,200 | 26.34 | ||||
| 2025-08-14 | 13F | Citadel Advisors Llc | 0 | -100.00 | 0 | |||||
| 2025-08-13 | 13F | Lido Advisors, LLC | 1,704,467 | 7.93 | 132,147 | 22.21 | ||||
| 2025-08-14 | 13F | Integrated Wealth Concepts LLC | 4,552 | 21.87 | 353 | 38.04 | ||||
| 2025-08-08 | 13F | MTM Investment Management, LLC | 479 | 37 | ||||||
| 2025-08-14 | 13F | Redwood Financial Network Corp | 0 | -100.00 | 0 | |||||
| 2025-07-10 | 13F | Wealth Enhancement Advisory Services, Llc | 0 | -100.00 | 0 | |||||
| 2025-08-04 | 13F | Prairie Wealth Advisors, Inc. | 6,702 | 0.00 | 520 | 13.32 | ||||
| 2025-08-06 | 13F | Mcrae Capital Management Inc | 5,123 | 397 | ||||||
| 2025-07-15 | 13F | Elevated Capital Advisors, LLC | 18,282 | 0.00 | 1,252 | 0.00 | ||||
| 2025-08-13 | 13F | Congress Wealth Management LLC / DE / | 10,133 | -0.84 | 786 | 12.30 | ||||
| 2025-07-14 | 13F | UMA Financial Services, Inc. | 50 | 0.00 | 4 | 0.00 | ||||
| 2025-08-08 | 13F | Atlantic Trust, LLC | 63 | 0.00 | 5 | 0.00 | ||||
| 2025-08-14 | 13F | Diversify Advisory Services, LLC | 3,205 | -1.75 | 258 | 16.22 | ||||
| 2025-08-12 | 13F | Founders Financial Alliance, LLC | 0 | -100.00 | 0 | |||||
| 2025-08-07 | 13F | Ibex Wealth Advisors | 3,700 | 287 | ||||||
| 2025-07-17 | 13F | Smith, Salley & Associates | 30,934 | 0.50 | 2,398 | 13.81 | ||||
| 2025-07-21 | 13F | Exchange Capital Management, Inc. | 30,156 | -2.49 | 2,338 | 10.39 | ||||
| 2025-07-30 | 13F | VCI Wealth Management LLC | 21,379 | 6.64 | 1,657 | 20.77 | ||||
| 2025-07-07 | 13F | Versant Capital Management, Inc | 433 | 0.00 | 34 | 13.79 | ||||
| 2025-07-17 | 13F | Sound Income Strategies, LLC | 23 | 0.00 | 2 | 0.00 | ||||
| 2025-08-14 | 13F | Ameriprise Financial Inc | 102,212 | -18.62 | 7,931 | -7.78 | ||||
| 2025-08-06 | 13F | Maltin Wealth Management, Inc. | 7,287 | 1.50 | 565 | 14.87 | ||||
| 2025-07-16 | 13F | Beaumont Financial Advisors, LLC | 22,508 | -7.08 | 1,745 | 5.25 | ||||
| 2025-08-12 | 13F | LPL Financial LLC | 181,712 | 1.89 | 14,088 | 15.37 | ||||
| 2025-07-17 | 13F | Centennial Wealth Advisory LLC | 5,134 | -7.09 | 399 | 5.56 | ||||
| 2025-08-11 | 13F | Citigroup Inc | 13,146 | 21.97 | 1,019 | 38.26 | ||||
| 2025-08-14 | 13F | Royal Bank Of Canada | 111,285 | -8.79 | 8,628 | 3.28 | ||||
| 2025-08-11 | 13F | Principal Securities, Inc. | 2,177 | 31.94 | 169 | 44.83 | ||||
| 2025-08-15 | 13F | Morgan Stanley | 198,915 | -21.87 | 15,422 | -11.54 | ||||
| 2025-08-01 | 13F | Rossby Financial, LCC | 59 | 0.00 | 5 | 33.33 | ||||
| 2025-07-23 | 13F | Godsey & Gibb Associates | 761 | 48.92 | 59 | 73.53 | ||||
| 2025-08-06 | 13F | Commonwealth Equity Services, Llc | 327,871 | 19.42 | 25 | 38.89 |