Mga Batayang Estadistika
| Pemilik Institusional | 233 total, 233 long only, 0 short only, 0 long/short - change of 11.90% MRQ |
| Alokasi Portofolio Rata-rata | 0.1469 % - change of 12.78% MRQ |
| Saham Institusional (Jangka Panjang) | 17,931,271 (ex 13D/G) - change of 0.83MM shares 4.83% MRQ |
| Nilai Institusional (Jangka Panjang) | $ 902,170 USD ($1000) |
Kepemilikan Institusional dan Pemegang Saham
Fidelity Covington Trust - Fidelity MSCI Utilities Index ETF (US:FUTY) memiliki 233 pemilik institusional dan pemegang saham yang telah mengajukan formulir 13D/G atau 13F kepada Komisi Bursa Efek (Securities Exchange Commission/SEC). Lembaga-lembaga ini memegang total 17,931,271 saham. Pemegang saham terbesar meliputi Bank Of America Corp /de/, AE Wealth Management LLC, Advisor Group Holdings, Inc., LPL Financial LLC, Lido Advisors, LLC, Kestra Advisory Services, LLC, Commonwealth Equity Services, Llc, Mariner, LLC, Morgan Stanley, and Cambridge Investment Research Advisors, Inc. .
Struktur kepemilikan institusional Fidelity Covington Trust - Fidelity MSCI Utilities Index ETF (ARCA:FUTY) menunjukkan posisi terkini di perusahaan oleh institusi dan dana, serta perubahan terbaru dalam ukuran posisi. Pemegang saham utama dapat mencakup investor individu, reksa dana, dana lindung nilai, atau institusi. Jadwal 13D menunjukkan bahwa investor memegang (atau pernah memegang) lebih dari 5% saham perusahaan dan bermaksud (atau pernah bermaksud) untuk secara aktif mengejar perubahan strategi bisnis. Jadwal 13G menunjukkan investasi pasif lebih dari 5%.
The share price as of September 11, 2025 is 54.96 / share. Previously, on September 12, 2024, the share price was 49.80 / share. This represents an increase of 10.36% over that period.

Skor Sentimen Dana
Skor Sentimen Dana (sebelumnya dikenal sebagai Skor Akumulasi Kepemilikan) menemukan saham-saham yang paling banyak dibeli oleh dana. Ini adalah hasil dari model kuantitatif multi-faktor yang canggih yang mengidentifikasi perusahaan dengan tingkat akumulasi institusional tertinggi. Model penilaian menggunakan kombinasi dari total peningkatan pemilik yang diungkapkan, perubahan dalam alokasi portofolio pada pemilik tersebut, dan metrik lainnya. Angka berkisar dari 0 hingga 100, dengan angka yang lebih tinggi menunjukkan tingkat akumulasi yang lebih tinggi dibandingkan dengan perusahaan sejenisnya, dan 50 adalah rata-ratanya.
Frekuensi Pembaruan: Setiap Hari
Lihat Ownership Explorer, yang menyediakan daftar perusahaan dengan peringkat tertinggi.
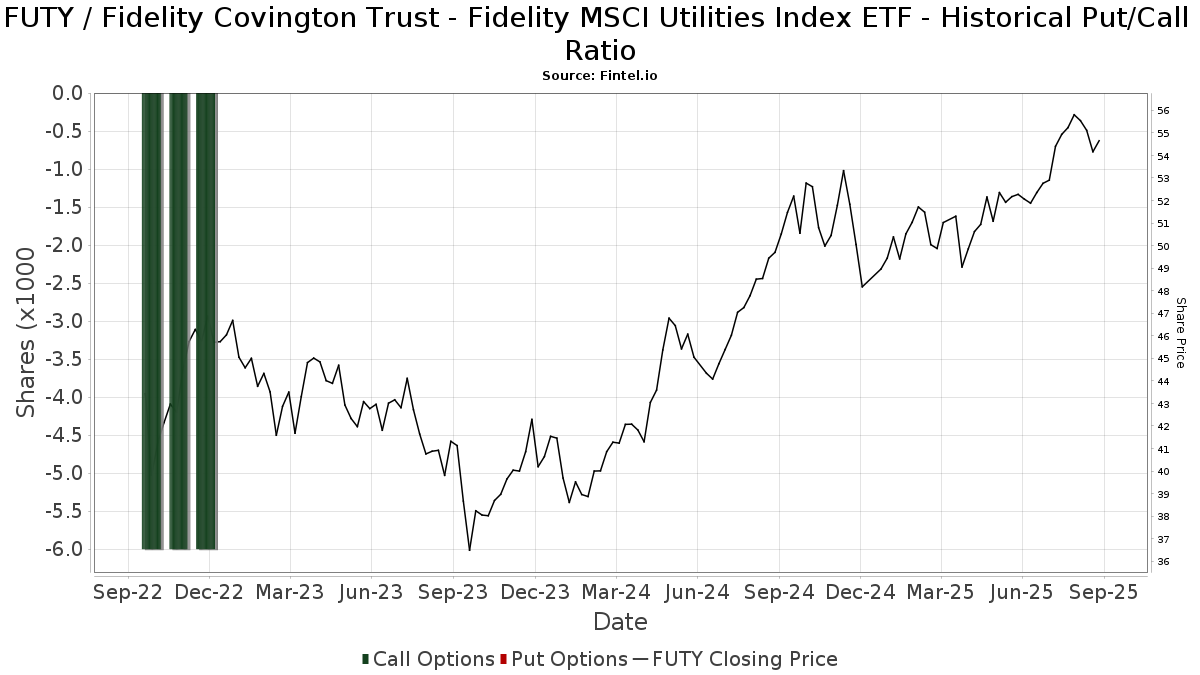
Rasio Put/Call Institusional
Selain melaporkan isu ekuitas dan utang standar, institusi dengan aset di bawah manajemen lebih dari 100 juta dolar AS juga harus mengungkapkan kepemilikan opsi put dan call mereka. Karena opsi put umumnya menunjukkan sentimen negatif, dan opsi call menunjukkan sentimen positif, kita dapat mengetahui sentimen institusional secara keseluruhan dengan memplot rasio put terhadap call. Grafik di sebelah kanan memplot rasio put/call historis untuk instrumen ini.
Menggunakan Rasio Put/Call sebagai indikator sentimen investor mengatasi salah satu kekurangan utama dari penggunaan total kepemilikan institusional, yaitu sejumlah besar aset yang dikelola diinvestasikan secara pasif untuk melacak indeks. Dana yang dikelola secara pasif biasanya tidak membeli opsi, sehingga indikator rasio put/call lebih akurat dalam melacak sentimen dana yang dikelola secara aktif.
Pengajuan 13F dan NPORT
Detail pada pengajuan 13F tersedia gratis. Detail pada pengajuan NP memerlukan keanggotaan premium. Baris berwarna hijau menunjukkan posisi baru. Baris berwarna merah menunjukkan posisi yang sudah ditutup. Klik tautan ini ikon untuk melihat riwayat transaksi selengkapnya.
Tingkatkan
untuk membuka data premium dan mengekspor ke Excel ![]() .
.
| Tanggal File | Sumber | Investor | Ketik | Presyo ng Avg (Silangan) |
Saham | Δ Saham (%) |
Dilaporkan Nilai ($1000) |
Nilai Δ (%) |
Alokasi Port (%) |
|
|---|---|---|---|---|---|---|---|---|---|---|
| 2025-07-17 | 13F | Janney Montgomery Scott LLC | 5,632 | -1.83 | 0 | |||||
| 2025-08-14 | 13F | GWM Advisors LLC | 64,625 | 1.83 | 3,399 | 5.13 | ||||
| 2025-07-15 | 13F | Mather Group, Llc. | 0 | -100.00 | 0 | |||||
| 2025-08-29 | 13F | Centaurus Financial, Inc. | 2,060 | 0 | ||||||
| 2025-08-07 | 13F | Richard C. Young & CO., LTD. | 74,586 | -0.29 | 3,923 | 2.94 | ||||
| 2025-08-14 | 13F | Full Sail Capital, LLC | 30,569 | -1.04 | 1,608 | 2.16 | ||||
| 2025-08-08 | 13F | Beck Bode, LLC | 9,946 | -35.75 | 523 | -33.63 | ||||
| 2025-07-14 | 13F | Sweeney & Michel, Llc | 82,997 | 2.74 | 4,409 | 15.39 | ||||
| 2025-08-01 | 13F | Envestnet Asset Management Inc | 101,584 | -2.86 | 5,343 | 0.30 | ||||
| 2025-08-04 | 13F | Creative Financial Designs Inc /adv | 7,639 | 1.22 | 402 | 4.43 | ||||
| 2025-08-08 | 13F | Capital Investment Advisory Services, LLC | 27,446 | 3.81 | 1,444 | 7.13 | ||||
| 2025-08-15 | 13F | Kestra Advisory Services, LLC | 425,441 | 17.49 | 22,378 | 21.30 | ||||
| 2025-07-21 | 13F | Ameritas Advisory Services, LLC | 21,706 | 1.33 | 1,142 | 7.84 | ||||
| 2025-08-07 | 13F | Nwam Llc | 21,539 | 0.00 | 1,183 | 7.84 | ||||
| 2025-08-01 | 13F | Purkiss Capital Advisors LLC | 4,044 | 213 | ||||||
| 2025-08-08 | 13F | Avalon Trust Co | 4,600 | 242 | ||||||
| 2025-08-14 | 13F | Bnp Paribas Arbitrage, Sa | 50,000 | 2,630 | ||||||
| 2025-08-07 | 13F | Kestra Private Wealth Services, Llc | 4,234 | -9.20 | 223 | -6.33 | ||||
| 2025-08-14 | 13F | Snowden Capital Advisors LLC | 12,373 | -3.68 | 651 | -0.61 | ||||
| 2025-07-10 | 13F | Financial Management Network Inc | 12,851 | -0.16 | 678 | 10.98 | ||||
| 2025-07-14 | 13F | Sowell Financial Services LLC | 52,017 | 898.98 | 2,736 | 932.45 | ||||
| 2025-08-11 | 13F | PFG Private Wealth Management, LLC | 0 | -100.00 | 0 | |||||
| 2025-07-29 | 13F | Stableford Capital Ii Llc | 9,124 | 0.00 | 497 | 8.28 | ||||
| 2025-08-12 | 13F | Atlas Capital Advisors Llc | 34,041 | -10.87 | 1,791 | -7.97 | ||||
| 2025-04-01 | 13F | Modus Advisors, LLC | 0 | -100.00 | 0 | |||||
| 2025-08-05 | 13F | Smith Shellnut Wilson Llc /adv | 24,210 | 2.85 | 1,273 | 6.17 | ||||
| 2025-08-14 | 13F | Stifel Financial Corp | 23,591 | -0.86 | 1,241 | 2.31 | ||||
| 2025-08-14 | 13F | Fmr Llc | 31,466 | -18.04 | 1,655 | -15.39 | ||||
| 2025-07-18 | 13F | Rogco, Lp | 3,495 | 0.00 | 184 | 2.81 | ||||
| 2025-08-12 | 13F | Tableaux Llc | 20,638 | 1,287 | ||||||
| 2025-04-29 | 13F | Callan Capital, LLC | 8,974 | 0.00 | 457 | 4.58 | ||||
| 2025-08-14 | 13F/A | Rockefeller Capital Management L.P. | 20,804 | 26.23 | 1,094 | 30.39 | ||||
| 2025-08-05 | 13F | Sigma Planning Corp | 30,925 | -8.63 | 1,627 | -5.68 | ||||
| 2025-08-14 | 13F | Sunbelt Securities, Inc. | 13,328 | 1.99 | 650 | -2.26 | ||||
| 2025-07-15 | 13F | Fifth Third Bancorp | 290 | 249.40 | 15 | 275.00 | ||||
| 2025-07-24 | 13F | Galvin, Gaustad & Stein, LLC | 7,000 | -4.11 | 368 | -0.81 | ||||
| 2025-05-14 | 13F | Eqis Capital Management, Inc. | 0 | -100.00 | 0 | -100.00 | ||||
| 2025-08-11 | 13F | Estate Counselors, LLC | 268,885 | 177.96 | 14,143 | 186.99 | ||||
| 2025-08-06 | 13F | Aspetuck Financial Management LLC | 4,485 | 236 | ||||||
| 2025-08-08 | 13F | Gts Securities Llc | 0 | -100.00 | 0 | |||||
| 2025-04-29 | 13F | Element Wealth, LLC | 0 | -100.00 | 0 | |||||
| 2025-07-29 | 13F | Signature Estate & Investment Advisors Llc | 13,175 | 8.24 | 693 | 11.61 | ||||
| 2025-07-14 | 13F | AdvisorNet Financial, Inc | 238 | 0.42 | 13 | 0.00 | ||||
| 2025-05-15 | 13F/A | Orion Portfolio Solutions, LLC | 33,276 | -0.52 | 1,695 | 3.92 | ||||
| 2025-07-22 | 13F | Yoder Wealth Management, Inc. | 41,617 | 5.23 | 2,189 | 8.64 | ||||
| 2025-08-11 | 13F | Hexagon Capital Partners LLC | 0 | -100.00 | 0 | |||||
| 2025-08-18 | 13F | Geneos Wealth Management Inc. | 4,297 | 3.29 | 226 | 7.11 | ||||
| 2025-08-08 | 13F | Pnc Financial Services Group, Inc. | 7,984 | -0.42 | 420 | 2.70 | ||||
| 2025-08-12 | 13F | Jpmorgan Chase & Co | 566 | -49.96 | 30 | -49.12 | ||||
| 2025-08-12 | 13F | Steward Partners Investment Advisory, Llc | 65,486 | 1,086.56 | 3,445 | 1,125.62 | ||||
| 2025-08-12 | 13F | BlackRock, Inc. | 105 | 6 | ||||||
| 2025-08-07 | 13F | Investment Management Corp /va/ /adv | 22,974 | 0.10 | 1,208 | 3.34 | ||||
| 2025-07-16 | 13F | Southern Capital Advisors, Llc | 50,344 | 0.97 | 2,648 | 4.25 | ||||
| 2025-07-30 | 13F | Brookstone Capital Management | 12,235 | -85.17 | 644 | -84.71 | ||||
| 2025-08-04 | 13F | Simon Quick Advisors, Llc | 50,219 | 2,642 | ||||||
| 2025-07-23 | 13F | Fortis Advisors, LLC | 4,943 | 0.26 | 260 | 3.19 | ||||
| 2025-07-16 | 13F | Signature Resources Capital Management, LLC | 182 | 10 | ||||||
| 2025-07-31 | 13F | Cambridge Investment Research Advisors, Inc. | 304,328 | 9.26 | 16 | 14.29 | ||||
| 2025-08-13 | 13F | Everstar Asset Management, LLC | 6,100 | 0.00 | 321 | 3.23 | ||||
| 2025-08-13 | 13F | KDK Private Wealth Management, LLC | 5,777 | -4.05 | 304 | -0.98 | ||||
| 2025-08-04 | 13F | Flagship Harbor Advisors, Llc | 10,831 | 126.02 | 570 | 133.20 | ||||
| 2025-07-08 | 13F | Ballew Advisors, Inc | 6,562 | -8.24 | 346 | -1.98 | ||||
| 2025-08-01 | 13F | Penobscot Wealth Management | 4,382 | 0.85 | 231 | 4.07 | ||||
| 2025-08-14 | 13F | Raymond James Financial Inc | 90,158 | -1.77 | 4,742 | 1.41 | ||||
| 2025-07-30 | 13F | Whittier Trust Co Of Nevada Inc | 414 | -8.20 | 22 | -4.55 | ||||
| 2025-08-12 | 13F | Centric Wealth Management | 0 | -100.00 | 0 | |||||
| 2025-07-29 | 13F | FLC Capital Advisors | 8,128 | 0.00 | 428 | 3.14 | ||||
| 2025-08-08 | 13F | Cetera Investment Advisers | 45,142 | 14.02 | 2,374 | 17.70 | ||||
| 2025-08-19 | 13F | Advisory Services Network, LLC | 5,235 | -93.81 | 289 | -93.29 | ||||
| 2025-08-07 | 13F | PFG Advisors | 0 | -100.00 | 0 | |||||
| 2025-08-06 | 13F | Agf Management Ltd | 94,719 | 9.10 | 4,982 | 12.64 | ||||
| 2025-07-30 | 13F | Whittier Trust Co | 785 | 0.00 | 41 | 5.13 | ||||
| 2025-03-21 | 13F | Prostatis Group LLC | 0 | -100.00 | 0 | |||||
| 2025-08-12 | 13F | O'shaughnessy Asset Management, Llc | 1,079 | 31.75 | 57 | 36.59 | ||||
| 2025-08-14 | 13F | Clarity Asset Management, Inc. | 390 | 0.78 | 20 | 5.26 | ||||
| 2025-05-02 | 13F | Capital A Wealth Management, LLC | 100 | 400.00 | 5 | |||||
| 2025-04-23 | 13F | Golden State Wealth Management, LLC | 0 | -100.00 | 0 | |||||
| 2025-07-17 | 13F | Raleigh Capital Management Inc. | 3 | 50.00 | 0 | |||||
| 2025-08-14 | 13F | MidWestOne Financial Group, Inc. | 5,500 | 0.00 | 289 | 3.21 | ||||
| 2025-07-14 | 13F | Conrad Siegel Investment Advisors, Inc. | 74,306 | -2.19 | 3,908 | 0.98 | ||||
| 2025-08-13 | 13F | Colonial Trust Advisors | 200 | 0.00 | 11 | 0.00 | ||||
| 2025-08-21 | 13F | Pathway Financial Advisers, LLC | 4,898 | 3.79 | 258 | 7.08 | ||||
| 2025-08-07 | 13F | Allworth Financial LP | 55 | 0.00 | 3 | 0.00 | ||||
| 2025-07-25 | 13F | Apollon Wealth Management, LLC | 118,415 | 6.34 | 6,229 | 9.78 | ||||
| 2025-08-13 | 13F | Jones Financial Companies Lllp | 6,110 | 111.42 | 320 | 120.69 | ||||
| 2025-08-15 | 13F | Tower Research Capital LLC (TRC) | 16,031 | 843 | ||||||
| 2025-07-30 | 13F | Axecap Investments, LLC | 16,868 | 22.92 | 887 | 26.90 | ||||
| 2025-08-12 | 13F | Proequities, Inc. | 0 | 0 | ||||||
| 2025-08-11 | 13F | Elite Financial, Inc. | 16,634 | -6.79 | 1 | |||||
| 2025-08-08 | 13F | Crossmark Global Holdings, Inc. | 17,277 | 0.00 | 909 | 3.30 | ||||
| 2025-08-08 | 13F | Smithfield Trust Co | 37 | 0 | ||||||
| 2025-07-30 | NP | ENDW - Cambria Endowment Style ETF | 65 | 3 | ||||||
| 2025-08-14 | 13F | Susquehanna International Group, Llp | 41,908 | 164.91 | 2,204 | 173.45 | ||||
| 2025-07-30 | 13F | Wbh Advisory Inc | 6,884 | 0.85 | 362 | 4.32 | ||||
| 2025-07-11 | 13F | Grove Bank & Trust | 93 | 5 | ||||||
| 2025-08-14 | 13F | UBS Group AG | 86,534 | 26.31 | 4,552 | 30.40 | ||||
| 2025-08-12 | 13F | AlphaCore Capital LLC | 9,235 | 486 | ||||||
| 2025-08-08 | 13F | Kingsview Wealth Management, LLC | 5,540 | 1.60 | 291 | 5.05 | ||||
| 2025-08-04 | 13F | Creekmur Asset Management LLC | 3 | -25.00 | 0 | |||||
| 2025-05-14 | 13F | 1620 Investment Advisors, Inc. | 0 | -100.00 | 0 | |||||
| 2025-07-14 | 13F | Farmers & Merchants Investments Inc | 81 | 0.00 | 4 | 0.00 | ||||
| 2025-08-14 | 13F | Hrt Financial Lp | 3,854 | 0 | ||||||
| 2025-08-01 | 13F | Logan Capital Management Inc | 22 | 0.00 | 1 | 0.00 | ||||
| 2025-07-29 | 13F | Activest Wealth Management | 38 | 0.00 | 2 | 100.00 | ||||
| 2025-08-07 | 13F | Montag A & Associates Inc | 48 | 3 | ||||||
| 2025-04-21 | 13F | Nelson, Van Denburg & Campbell Wealth Management Group, LLC | 0 | -100.00 | 0 | |||||
| 2025-08-11 | 13F | Advisor Resource Council | 5,660 | 298 | ||||||
| 2025-08-05 | 13F | Key FInancial Inc | 124 | 69.86 | 7 | 100.00 | ||||
| 2025-08-14 | 13F | Wells Fargo & Company/mn | 45,610 | 12.50 | 2,399 | 16.17 | ||||
| 2025-08-11 | 13F | Independent Advisor Alliance | 11,279 | 593 | ||||||
| 2025-05-09 | 13F | Generation Capital Management LLC | 0 | -100.00 | 0 | |||||
| 2025-07-16 | 13F | ORG Partners LLC | 600 | 32 | ||||||
| 2025-07-24 | 13F | IFP Advisors, Inc | 1,171 | 0.00 | 62 | 3.39 | ||||
| 2025-08-14 | 13F | CoreCap Advisors, LLC | 3,225 | 37.82 | 170 | 42.02 | ||||
| 2025-08-07 | 13F | Parkside Financial Bank & Trust | 12 | 0.00 | 1 | |||||
| 2025-08-13 | 13F | Quadrature Capital Ltd | 0 | -100.00 | 0 | |||||
| 2025-05-15 | 13F | Proquility Private Wealth Partners, LLC | 48,717 | 34.97 | 2,482 | 41.02 | ||||
| 2025-05-13 | 13F | Bank Of Montreal /can/ | 0 | -100.00 | 0 | |||||
| 2025-07-29 | 13F | BKM Wealth Management, LLC | 4,960 | 0.00 | 261 | 3.17 | ||||
| 2025-07-25 | 13F | Concord Wealth Partners | 29 | 0.00 | 2 | 0.00 | ||||
| 2025-07-08 | 13F | Nbc Securities, Inc. | 375 | 0.00 | 0 | |||||
| 2025-08-14 | 13F | Kovitz Investment Group Partners, LLC | 200,752 | 305.49 | 10,560 | 318.68 | ||||
| 2025-07-30 | 13F | D.a. Davidson & Co. | 4,308 | 9.17 | 227 | 12.44 | ||||
| 2025-08-14 | 13F | Citadel Advisors Llc | 4,992 | -60.87 | 263 | -59.69 | ||||
| 2025-07-30 | 13F | Strategic Blueprint, LLC | 8,934 | 470 | ||||||
| 2025-08-14 | 13F | Federation des caisses Desjardins du Quebec | 1,593 | 84 | ||||||
| 2025-07-25 | 13F | Ellis Investment Partners, LLC | 7,112 | 0.58 | 374 | 3.89 | ||||
| 2025-08-14 | 13F | Two Sigma Investments, Lp | 0 | -100.00 | 0 | |||||
| 2025-07-21 | 13F | Hilltop National Bank | 495 | 0.00 | 26 | 8.33 | ||||
| 2025-07-28 | 13F | BRYN MAWR TRUST Co | 13,623 | 36.67 | 717 | 41.22 | ||||
| 2025-08-04 | 13F | IFG Advisory, LLC | 149,700 | 1.25 | 7,874 | 4.53 | ||||
| 2025-08-14 | 13F | Mercer Global Advisors Inc /adv | 12,259 | -19.83 | 645 | -17.33 | ||||
| 2025-07-31 | 13F | Briaud Financial Planning, Inc | 582 | 0 | ||||||
| 2025-07-22 | 13F | D.B. Root & Company, LLC | 4,377 | 0.00 | 230 | 3.14 | ||||
| 2025-08-04 | 13F | Spire Wealth Management | 330 | 0.61 | 17 | 6.25 | ||||
| 2025-04-29 | 13F | Lee Danner & Bass Inc | 0 | -100.00 | 0 | -100.00 | ||||
| 2025-07-25 | 13F | Atria Wealth Solutions, Inc. | 18,234 | -4.21 | 961 | -0.93 | ||||
| 2025-07-22 | 13F | Accel Wealth Management | 7,583 | 0.53 | 399 | 3.65 | ||||
| 2025-07-09 | 13F | Tounjian Advisory Partners, Llc | 11,576 | -3.15 | 590 | -3.12 | ||||
| 2025-08-14 | 13F | Mml Investors Services, Llc | 35,431 | 1.74 | 2 | 0.00 | ||||
| 2025-08-11 | 13F | Aptus Capital Advisors, LLC | 17 | 0.00 | 1 | |||||
| 2025-07-24 | 13F | Blair William & Co/il | 6,222 | -4.07 | 327 | -0.91 | ||||
| 2025-07-28 | 13F | Harbour Investments, Inc. | 18,565 | 2.13 | 977 | 5.40 | ||||
| 2025-08-06 | 13F | AE Wealth Management LLC | 873,184 | 0.22 | 45,930 | 3.47 | ||||
| 2025-08-08 | 13F | Avantax Advisory Services, Inc. | 32,785 | -12.24 | 1,724 | -9.41 | ||||
| 2025-08-12 | 13F | Global Retirement Partners, LLC | 1,377 | -50.27 | 72 | -46.67 | ||||
| 2025-07-23 | 13F | Heck Capital Advisors, LLC | 27,940 | 0.88 | 1,470 | 4.11 | ||||
| 2025-08-12 | 13F | SRS Capital Advisors, Inc. | 152 | 8 | ||||||
| 2025-07-18 | 13F | Vicus Capital | 8,869 | 10.85 | 466 | 14.50 | ||||
| 2025-07-24 | 13F | Eastern Bank | 1,330 | 70 | ||||||
| 2025-08-13 | 13F | Quadrant Capital Group Llc | 0 | -100.00 | 0 | |||||
| 2025-08-13 | 13F | Renaissance Technologies Llc | 11,000 | 579 | ||||||
| 2025-07-07 | 13F | Nova Wealth Management, Inc. | 1,743 | 2,000.00 | 92 | 2,175.00 | ||||
| 2025-08-05 | 13F | Simplex Trading, Llc | 0 | -100.00 | 0 | |||||
| 2025-07-11 | 13F | Farther Finance Advisors, LLC | 485 | 0.00 | 26 | 4.17 | ||||
| 2025-04-01 | NP | MSMR - McElhenny Sheffield Managed Risk ETF | 0 | -100.00 | 0 | -100.00 | ||||
| 2025-08-27 | 13F/A | Brinker Capital Investments, LLC | 35,625 | 7.06 | 1,874 | 10.50 | ||||
| 2025-07-09 | 13F | Reyes Financial Architecture, Inc. | 0 | -100.00 | 0 | |||||
| 2025-07-31 | 13F | Sage Mountain Advisors LLC | 392 | 0.00 | 21 | 5.26 | ||||
| 2025-08-12 | 13F | Jaffetilchin Investment Partners, LLC | 23,959 | -0.27 | 1,260 | 2.94 | ||||
| 2025-08-13 | 13F | Summit Financial, LLC | 4,397 | -10.01 | 231 | -6.85 | ||||
| 2025-08-12 | 13F | Nemes Rush Group LLC | 110 | 6 | ||||||
| 2025-05-01 | 13F | Grant/GrossMendelsohn, LLC | 61,444 | 3,124 | ||||||
| 2025-07-24 | 13F | Ronald Blue Trust, Inc. | 156 | -4.29 | 8 | 0.00 | ||||
| 2025-07-24 | 13F | Us Bancorp \de\ | 203 | 11 | ||||||
| 2025-08-05 | 13F | EPG Wealth Management LLC | 931 | 0.65 | 49 | 2.13 | ||||
| 2025-08-11 | 13F | HighTower Advisors, LLC | 162,385 | -35.32 | 8,541 | -33.23 | ||||
| 2025-08-12 | 13F | MAI Capital Management | 586 | 2.45 | 31 | 3.45 | ||||
| 2025-04-23 | 13F | PMV Capital Advisers, LLC | 0 | -100.00 | 0 | |||||
| 2025-08-11 | 13F | Private Advisor Group, LLC | 12,400 | -44.06 | 652 | -42.25 | ||||
| 2025-08-12 | 13F | J.w. Cole Advisors, Inc. | 23,984 | 44.67 | 1,262 | 49.41 | ||||
| 2025-09-04 | 13F/A | Advisor Group Holdings, Inc. | 745,001 | 28.68 | 39,209 | 32.84 | ||||
| 2025-08-01 | 13F | SYM FINANCIAL Corp | 61 | 3 | ||||||
| 2025-07-15 | 13F | Lynch & Associates/in | 13,605 | 1.96 | 716 | 5.30 | ||||
| 2025-08-14 | 13F | Modern Wealth Management, LLC | 65,200 | 0.64 | 3,430 | 3.91 | ||||
| 2025-07-28 | 13F | Duncker Streett & Co Inc | 12 | 0.00 | 1 | |||||
| 2025-07-15 | 13F | GSB Wealth Management, LLC | 54,636 | 0.62 | 2,874 | 3.87 | ||||
| 2025-07-16 | 13F | Essex Financial Services, Inc. | 8,824 | 464 | ||||||
| 2025-08-05 | 13F | Centennial Bank/AR/ | 48 | -27.27 | 3 | -33.33 | ||||
| 2025-08-14 | 13F | Bank Of America Corp /de/ | 8,795,631 | 1.99 | 462,650 | 5.29 | ||||
| 2025-08-05 | 13F | Trail Ridge Investment Advisors, LLC | 7,958 | -4.45 | 440 | 3.54 | ||||
| 2025-04-21 | 13F | PSI Advisors, LLC | 0 | -100.00 | 0 | |||||
| 2025-08-08 | 13F | Independence Financial Advisors, LLC | 7,076 | 0.01 | 372 | 3.33 | ||||
| 2025-07-09 | 13F | Archer Investment Management, LLC | 35,559 | 3.12 | 1,870 | 6.49 | ||||
| 2025-08-14 | 13F | Glen Eagle Advisors, LLC | 1,517 | 0.00 | 80 | 2.60 | ||||
| 2025-08-05 | 13F | GHP Investment Advisors, Inc. | 1,300 | 0.00 | 68 | 3.03 | ||||
| 2025-07-17 | 13F | Hanson & Doremus Investment Management | 613 | 0.00 | 0 | |||||
| 2025-07-30 | 13F | Demars Financial Group, LLC | 11,284 | -98.04 | 594 | 5,290.91 | ||||
| 2025-07-15 | 13F | Northside Capital Management, LLC | 3,990 | 210 | ||||||
| 2025-08-06 | 13F | Rialto Wealth Management, LLC | 753 | 0.00 | 40 | 2.63 | ||||
| 2025-08-05 | 13F | Lifeworks Advisors, LLC | 33,187 | -1.09 | 1,746 | 2.11 | ||||
| 2025-08-14 | 13F | D. E. Shaw & Co., Inc. | 15,728 | -49.92 | 827 | -48.31 | ||||
| 2025-05-08 | 13F | Mesirow Financial Investment Management, Inc. | 0 | -100.00 | 0 | |||||
| 2025-08-04 | 13F | Arkadios Wealth Advisors | 14,648 | -82.43 | 770 | -81.87 | ||||
| 2025-08-12 | 13F | Franklin Resources Inc | 0 | -100.00 | 0 | |||||
| 2025-08-08 | 13F | Larson Financial Group LLC | 395 | 0.77 | 21 | 5.26 | ||||
| 2025-07-10 | 13F | Wealth Enhancement Advisory Services, Llc | 7,905 | 0.89 | 417 | 4.26 | ||||
| 2025-08-15 | 13F | CI Private Wealth, LLC | 3,951 | 208 | ||||||
| 2025-08-12 | 13F | Change Path, LLC | 15,060 | 26.23 | 792 | 30.48 | ||||
| 2025-05-15 | 13F | Newbridge Financial Services Group, Inc. | 0 | -100.00 | 0 | |||||
| 2025-07-14 | 13F | GAMMA Investing LLC | 190 | 0.00 | 10 | 0.00 | ||||
| 2025-07-17 | 13F | Emerald Advisors, LLC | 13,915 | 732 | ||||||
| 2025-07-07 | 13F | Roxbury Financial LLC | 1,394 | 0.65 | 73 | 4.29 | ||||
| 2025-08-26 | 13F | Claris Financial LLC | 7,893 | 0.00 | 415 | 8.07 | ||||
| 2025-08-14 | 13F | Warren Averett Asset Management, LLC | 61,900 | 1.94 | 3,256 | 5.24 | ||||
| 2025-07-16 | 13F | American National Bank | 11,134 | 10.63 | 586 | 14.26 | ||||
| 2025-05-09 | 13F | GeoWealth Management, LLC | 0 | -100.00 | 0 | |||||
| 2025-08-14 | 13F | Mariner, LLC | 353,039 | 1,909.33 | 18,570 | 1,974.75 | ||||
| 2025-08-13 | 13F | Northwestern Mutual Wealth Management Co | 8,205 | -89.16 | 432 | -88.82 | ||||
| 2025-07-21 | 13F | HighMark Wealth Management LLC | 250 | 0.00 | 13 | 8.33 | ||||
| 2025-07-29 | 13F | Primoris Wealth Advisors, Llc | 46,425 | 110.31 | 2,442 | 117.17 | ||||
| 2025-07-23 | 13F | Traphagen Investment Advisors Llc | 66,763 | -3.26 | 3,512 | -0.14 | ||||
| 2025-08-14 | 13F | Goldman Sachs Group Inc | 22,547 | 109.33 | 1,186 | 116.24 | ||||
| 2025-08-14 | 13F | Comerica Bank | 4,052 | 23.16 | 213 | 27.54 | ||||
| 2025-07-16 | 13F | Signaturefd, Llc | 0 | -100.00 | 0 | |||||
| 2025-08-05 | 13F | Huntington National Bank | 105 | -1.87 | ||||||
| 2025-08-01 | 13F | Schmidt P J Investment Management Inc | 6,077 | -2.03 | 320 | 0.95 | ||||
| 2025-08-13 | 13F | Lido Advisors, LLC | 574,513 | 11.98 | 30,219 | 15.61 | ||||
| 2025-08-05 | 13F | Carolinas Wealth Consulting Llc | 0 | -100.00 | 0 | |||||
| 2025-08-14 | 13F | Royal Bank Of Canada | 21,511 | 45.47 | 1,132 | 50.13 | ||||
| 2025-05-15 | 13F | Gibson Wealth Advisors LLC | 0 | -100.00 | 0 | |||||
| 2025-08-13 | 13F | Capital Analysts, Inc. | 0 | -100.00 | 0 | |||||
| 2025-08-14 | 13F | LifePlan Investment Advisors, Inc. | 58,687 | -0.93 | 3,087 | 2.25 | ||||
| 2025-08-06 | 13F | Stone House Investment Management, LLC | 4,815 | 253 | ||||||
| 2025-07-16 | 13F/A | CX Institutional | 7,143 | 93.21 | 0 | |||||
| 2025-07-30 | 13F | Gimbal Financial | 168,867 | 8,882 | ||||||
| 2025-07-30 | 13F | IMG Wealth Management, Inc. | 639 | 34 | ||||||
| 2025-08-15 | 13F | Morgan Stanley | 346,248 | 15.53 | 18,213 | 19.27 | ||||
| 2025-07-21 | 13F | Exchange Capital Management, Inc. | 9,242 | -2.73 | 486 | 0.41 | ||||
| 2025-08-14 | 13F | Qube Research & Technologies Ltd | 2,791 | 147 | ||||||
| 2025-09-03 | 13F | Q3 Asset Management | 0 | -100.00 | 0 | |||||
| 2025-07-28 | 13F | RFG Advisory, LLC | 19,319 | 37.00 | 1,016 | 41.50 | ||||
| 2025-08-13 | 13F | Congress Wealth Management LLC / DE / | 13,380 | 704 | ||||||
| 2025-07-23 | 13F | Kingswood Wealth Advisors, Llc | 41,304 | 2.08 | 2,173 | 5.39 | ||||
| 2025-07-02 | 13F | Marotta Asset Management | 4,132 | 217 | ||||||
| 2025-07-15 | 13F | Elevated Capital Advisors, LLC | 13,881 | 0.00 | 707 | 0.00 | ||||
| 2025-07-10 | 13F | Sovran Advisors, LLC | 6,247 | 10.63 | 327 | 14.79 | ||||
| 2025-08-12 | 13F | OneAscent Financial Services LLC | 16,745 | 1 | ||||||
| 2025-07-17 | 13F | Smith, Salley & Associates | 13,599 | 0.48 | 715 | 3.77 | ||||
| 2025-08-13 | 13F | Russell Investments Group, Ltd. | 14 | 0.00 | 1 | |||||
| 2025-08-12 | 13F | Founders Financial Alliance, LLC | 38 | 0.00 | 2 | 0.00 | ||||
| 2025-08-06 | 13F | Maltin Wealth Management, Inc. | 46,378 | 4.01 | 2,440 | 7.40 | ||||
| 2025-07-23 | 13F | Valmark Advisers, Inc. | 90,030 | -0.95 | 4,736 | 2.25 | ||||
| 2025-08-12 | 13F | Coston, McIsaac & Partners | 616 | 0.65 | 0 | |||||
| 2025-07-09 | 13F | Dynamic Advisor Solutions LLC | 43,413 | -1.23 | 2,284 | 1.97 | ||||
| 2025-07-25 | 13F | Cwm, Llc | 800 | 0.63 | 0 | |||||
| 2025-07-30 | 13F | VCI Wealth Management LLC | 7,494 | 7.64 | 394 | 11.30 | ||||
| 2025-07-07 | 13F | Versant Capital Management, Inc | 524 | 0.00 | 28 | 3.85 | ||||
| 2025-08-04 | 13F | Prairie Wealth Advisors, Inc. | 16,711 | 1.87 | 879 | 5.15 | ||||
| 2025-07-21 | 13F | Barrett & Company, Inc. | 11 | 0.00 | 1 | |||||
| 2025-05-14 | 13F | Jane Street Group, Llc | 0 | -100.00 | 0 | |||||
| 2025-07-30 | 13F | Cullen/frost Bankers, Inc. | 23 | 4.55 | 1 | 0.00 | ||||
| 2025-07-17 | 13F | Robbins Farley Llc | 26 | -3.70 | 1 | 0.00 | ||||
| 2025-07-16 | 13F | Beaumont Financial Advisors, LLC | 58,017 | -1.21 | 3,052 | 1.97 | ||||
| 2025-08-11 | 13F | Citigroup Inc | 7,305 | 56.76 | 384 | 62.03 | ||||
| 2025-08-12 | 13F | LPL Financial LLC | 606,961 | 12.34 | 31,926 | 15.98 | ||||
| 2025-07-10 | 13F | Global Financial Private Client, LLC | 10,326 | 37.83 | 543 | 42.52 | ||||
| 2025-08-11 | 13F | Principal Securities, Inc. | 2,724 | 59.86 | 143 | 72.29 | ||||
| 2025-07-17 | 13F | Centennial Wealth Advisory LLC | 6,636 | -6.64 | 351 | -3.31 | ||||
| 2025-08-05 | 13F | BEAM Asset Management, LLC | 15,880 | -0.38 | 835 | 2.83 | ||||
| 2025-07-17 | 13F | Sound Income Strategies, LLC | 552 | 0.00 | 29 | 3.57 | ||||
| 2025-07-31 | 13F | Glass Jacobson Investment Advisors llc | 13,247 | 4.81 | 697 | 12.99 | ||||
| 2025-08-12 | 13F | Bokf, Na | 0 | -100.00 | 0 | |||||
| 2025-05-14 | 13F | CIBC Private Wealth Group, LLC | 0 | -100.00 | 0 | -100.00 | ||||
| 2025-07-29 | 13F | Tradewinds Capital Management, LLC | 75 | 0.00 | 4 | 0.00 | ||||
| 2025-08-01 | 13F | Rossby Financial, LCC | 5,388 | 283 | ||||||
| 2025-04-09 | 13F | HBW Advisory Services LLC | 0 | -100.00 | 0 | -100.00 | ||||
| 2025-08-14 | 13F | Ameriprise Financial Inc | 77,542 | 4.53 | 4,079 | 7.94 | ||||
| 2025-08-06 | 13F | Commonwealth Equity Services, Llc | 383,892 | 3.53 | 20 | 11.11 | ||||
| 2025-07-22 | 13F | Mascoma Wealth Management LLC | 11,565 | -13.67 | 608 | -10.85 | ||||
| 2025-08-11 | 13F | Brown Brothers Harriman & Co | 27 | -72.16 | 1 | -75.00 | ||||
| 2025-08-13 | 13F | Colonial Trust Co / SC | 828 | 0.00 | 44 | 2.38 |