Mga Batayang Estadistika
| Pemilik Institusional | 142 total, 141 long only, 1 short only, 0 long/short - change of -9.49% MRQ |
| Alokasi Portofolio Rata-rata | 0.0143 % - change of -56.30% MRQ |
| Saham Institusional (Jangka Panjang) | 4,978,755 (ex 13D/G) - change of 0.02MM shares 0.41% MRQ |
| Nilai Institusional (Jangka Panjang) | $ 318,634 USD ($1000) |
Kepemilikan Institusional dan Pemegang Saham
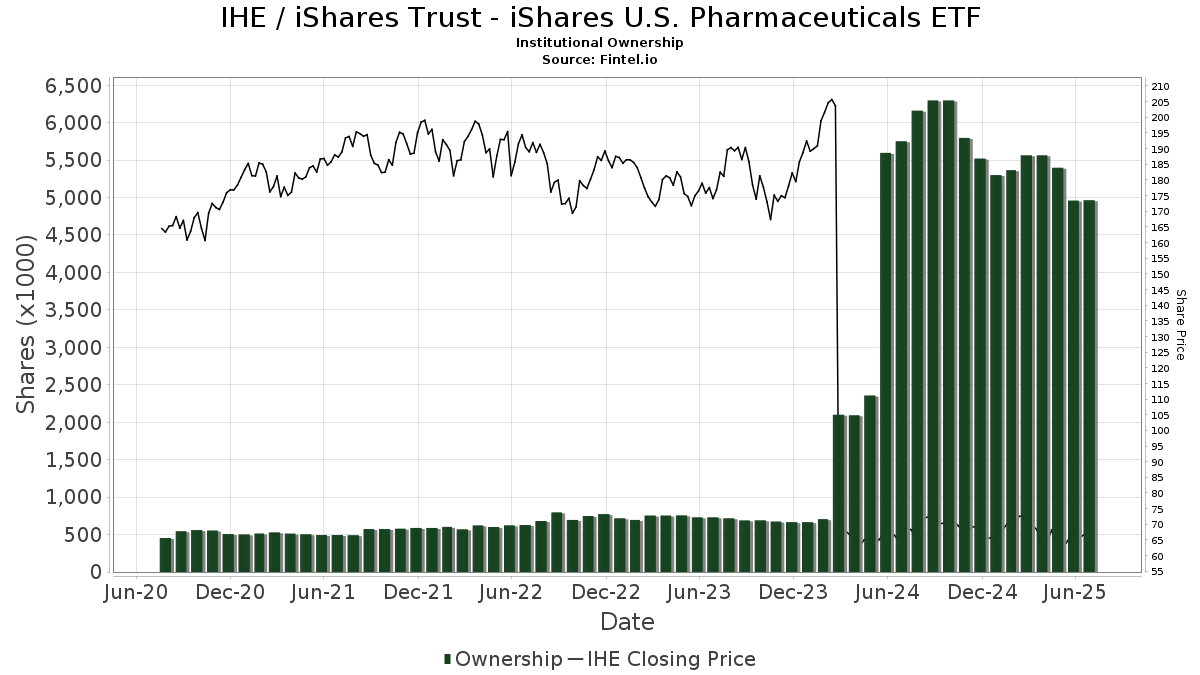
iShares Trust - iShares U.S. Pharmaceuticals ETF (US:IHE) memiliki 142 pemilik institusional dan pemegang saham yang telah mengajukan formulir 13D/G atau 13F kepada Komisi Bursa Efek (Securities Exchange Commission/SEC). Lembaga-lembaga ini memegang total 5,031,815 saham. Pemegang saham terbesar meliputi Fisher Asset Management, LLC, Bnp Paribas Arbitrage, Sa, Morgan Stanley, Goldman Sachs Group Inc, Bank Of America Corp /de/, LPL Financial LLC, Royal Bank Of Canada, Jpmorgan Chase & Co, Brown Advisory Inc, and Raymond James Financial Inc .
Struktur kepemilikan institusional iShares Trust - iShares U.S. Pharmaceuticals ETF (ARCA:IHE) menunjukkan posisi terkini di perusahaan oleh institusi dan dana, serta perubahan terbaru dalam ukuran posisi. Pemegang saham utama dapat mencakup investor individu, reksa dana, dana lindung nilai, atau institusi. Jadwal 13D menunjukkan bahwa investor memegang (atau pernah memegang) lebih dari 5% saham perusahaan dan bermaksud (atau pernah bermaksud) untuk secara aktif mengejar perubahan strategi bisnis. Jadwal 13G menunjukkan investasi pasif lebih dari 5%.
The share price as of September 11, 2025 is 71.74 / share. Previously, on September 12, 2024, the share price was 71.28 / share. This represents an increase of 0.65% over that period.
Skor Sentimen Dana
Skor Sentimen Dana (sebelumnya dikenal sebagai Skor Akumulasi Kepemilikan) menemukan saham-saham yang paling banyak dibeli oleh dana. Ini adalah hasil dari model kuantitatif multi-faktor yang canggih yang mengidentifikasi perusahaan dengan tingkat akumulasi institusional tertinggi. Model penilaian menggunakan kombinasi dari total peningkatan pemilik yang diungkapkan, perubahan dalam alokasi portofolio pada pemilik tersebut, dan metrik lainnya. Angka berkisar dari 0 hingga 100, dengan angka yang lebih tinggi menunjukkan tingkat akumulasi yang lebih tinggi dibandingkan dengan perusahaan sejenisnya, dan 50 adalah rata-ratanya.
Frekuensi Pembaruan: Setiap Hari
Lihat Ownership Explorer, yang menyediakan daftar perusahaan dengan peringkat tertinggi.
Rasio Put/Call Institusional
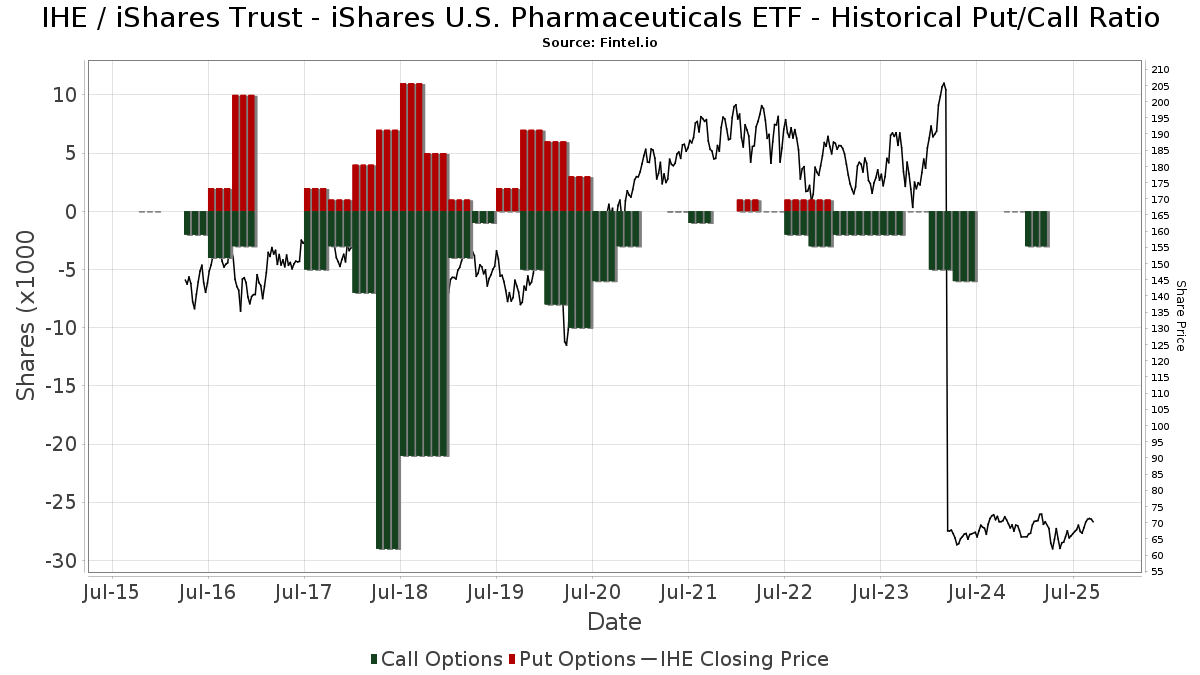
Selain melaporkan isu ekuitas dan utang standar, institusi dengan aset di bawah manajemen lebih dari 100 juta dolar AS juga harus mengungkapkan kepemilikan opsi put dan call mereka. Karena opsi put umumnya menunjukkan sentimen negatif, dan opsi call menunjukkan sentimen positif, kita dapat mengetahui sentimen institusional secara keseluruhan dengan memplot rasio put terhadap call. Grafik di sebelah kanan memplot rasio put/call historis untuk instrumen ini.
Menggunakan Rasio Put/Call sebagai indikator sentimen investor mengatasi salah satu kekurangan utama dari penggunaan total kepemilikan institusional, yaitu sejumlah besar aset yang dikelola diinvestasikan secara pasif untuk melacak indeks. Dana yang dikelola secara pasif biasanya tidak membeli opsi, sehingga indikator rasio put/call lebih akurat dalam melacak sentimen dana yang dikelola secara aktif.
Pengajuan 13F dan NPORT
Detail pada pengajuan 13F tersedia gratis. Detail pada pengajuan NP memerlukan keanggotaan premium. Baris berwarna hijau menunjukkan posisi baru. Baris berwarna merah menunjukkan posisi yang sudah ditutup. Klik tautan ini ikon untuk melihat riwayat transaksi selengkapnya.
Tingkatkan
untuk membuka data premium dan mengekspor ke Excel ![]() .
.
| Tanggal File | Sumber | Investor | Ketik | Presyo ng Avg (Silangan) |
Saham | Δ Saham (%) |
Dilaporkan Nilai ($1000) |
Nilai Δ (%) |
Alokasi Port (%) |
|
|---|---|---|---|---|---|---|---|---|---|---|
| 2025-08-07 | 13F | Atala Financial Inc | 0 | -100.00 | 0 | |||||
| 2025-08-01 | 13F | Envestnet Asset Management Inc | 8,633 | 2.84 | 566 | -4.56 | ||||
| 2025-08-06 | 13F | Texas Yale Capital Corp. | 12,675 | -1.97 | 831 | -8.99 | ||||
| 2025-08-13 | 13F | Quadrature Capital Ltd | 0 | -100.00 | 0 | |||||
| 2025-07-24 | 13F | IFP Advisors, Inc | 704 | -25.42 | 46 | -30.30 | ||||
| 2025-08-14 | 13F | Peapack Gladstone Financial Corp | 32,835 | -3.69 | 2 | 0.00 | ||||
| 2025-07-30 | 13F | IMG Wealth Management, Inc. | 56 | 0.00 | 4 | 0.00 | ||||
| 2025-08-14 | 13F | Mercer Global Advisors Inc /adv | 3,865 | -3.04 | 253 | -9.96 | ||||
| 2025-04-30 | 13F | Stonebrook Private Inc. | 0 | -100.00 | 0 | |||||
| 2025-07-08 | 13F | Arlington Trust Co LLC | 450 | 0.00 | 29 | -6.45 | ||||
| 2025-08-14 | 13F | Raymond James Financial Inc | 63,564 | 3.17 | 4,166 | -4.16 | ||||
| 2025-04-22 | 13F/A | NorthRock Partners, LLC | 0 | -100.00 | 0 | -100.00 | ||||
| 2025-07-28 | 13F | Axxcess Wealth Management, Llc | 7,063 | 0.47 | 463 | -6.85 | ||||
| 2025-08-04 | 13F | Assetmark, Inc | 306 | -29.17 | 20 | -33.33 | ||||
| 2025-08-13 | 13F | Brown Advisory Inc | 75,432 | -17.17 | 4,944 | -23.07 | ||||
| 2025-08-14 | 13F | Fwl Investment Management, Llc | 84 | -53.33 | 6 | -58.33 | ||||
| 2025-08-08 | 13F | Creative Planning | 6,127 | -3.19 | 402 | -10.09 | ||||
| 2025-08-14 | 13F | Bank Of America Corp /de/ | 121,669 | -13.61 | 7,974 | -19.75 | ||||
| 2025-07-08 | 13F | Nbc Securities, Inc. | 430 | 0.70 | 0 | |||||
| 2025-08-15 | 13F | Provenance Wealth Advisors, LLC | 0 | -100.00 | 0 | -100.00 | ||||
| 2025-07-21 | 13F | Ameriflex Group, Inc. | 291 | 0.00 | 19 | -5.00 | ||||
| 2025-07-09 | 13F | Bruce G. Allen Investments, LLC | 1,404 | 0.50 | 92 | -7.14 | ||||
| 2025-07-25 | 13F | Sequoia Financial Advisors, LLC | 3,433 | 0.00 | 225 | -7.44 | ||||
| 2025-08-04 | 13F | Spinnaker Trust | 18,154 | 0.00 | 1,190 | -7.11 | ||||
| 2025-08-07 | 13F | Cahill Financial Advisors Inc | 20,220 | 0.16 | 1,325 | -6.95 | ||||
| 2025-07-15 | 13F | North Star Investment Management Corp. | 11 | 0.00 | 1 | |||||
| 2025-08-14 | 13F | Sunbelt Securities, Inc. | 3,702 | 243 | ||||||
| 2025-05-15 | 13F | Integrated Wealth Concepts LLC | 0 | -100.00 | 0 | -100.00 | ||||
| 2025-08-08 | 13F | Family Firm, Inc. | 0 | -100.00 | 0 | |||||
| 2025-08-11 | 13F | Y.D. More Investments Ltd | 2,700 | 0.00 | 177 | -7.37 | ||||
| 2025-08-18 | 13F | V2 Financial group LLC | 3,300 | 0.00 | 216 | -6.90 | ||||
| 2025-08-15 | 13F | Kestra Advisory Services, LLC | 4,790 | -9.00 | 314 | -15.63 | ||||
| 2025-07-22 | 13F | Gsa Capital Partners Llp | 0 | -100.00 | 0 | |||||
| 2025-08-11 | 13F | Private Advisor Group, LLC | 4,310 | -7.39 | 282 | -14.02 | ||||
| 2025-08-14 | 13F | Susquehanna International Group, Llp | Call | 0 | -100.00 | 0 | ||||
| 2025-08-12 | 13F | Steward Partners Investment Advisory, Llc | 315 | 21 | ||||||
| 2025-08-15 | 13F | Morgan Stanley | 183,115 | -13.62 | 12,001 | -19.76 | ||||
| 2025-07-28 | 13F | Private Wealth Asset Management, LLC | 150 | 0.00 | 10 | -10.00 | ||||
| 2025-08-14 | 13F | Stifel Financial Corp | 9,600 | -5.04 | 629 | -11.78 | ||||
| 2025-07-28 | 13F | Duncker Streett & Co Inc | 300 | 0.00 | 20 | -9.52 | ||||
| 2025-08-13 | 13F | Jones Financial Companies Lllp | 27,741 | -6.63 | 1,818 | -10.80 | ||||
| 2025-08-12 | 13F | Clearbridge Investments, LLC | 0 | -100.00 | 0 | |||||
| 2025-08-11 | 13F | One Capital Management, LLC | 19,866 | -13.41 | 1,302 | -19.53 | ||||
| 2025-07-14 | 13F | U.S. Capital Wealth Advisors, LLC | 6,668 | 24.13 | 437 | 15.30 | ||||
| 2025-07-31 | 13F | Oppenheimer & Co Inc | 6,786 | 0.00 | 445 | -7.11 | ||||
| 2025-07-16 | 13F | Arkansas Financial Group, Inc. | 7,185 | 7.03 | 477 | 16.63 | ||||
| 2025-08-01 | 13F | Liberty Wealth Management Llc | 0 | -100.00 | 0 | -100.00 | ||||
| 2025-08-14 | 13F | Colony Group, LLC | 3,117 | 0.58 | 204 | -6.42 | ||||
| 2025-08-14 | 13F | GWM Advisors LLC | 1,212 | -43.97 | 79 | -48.03 | ||||
| 2025-04-01 | 13F | Modus Advisors, LLC | 0 | -100.00 | 0 | |||||
| 2025-07-31 | 13F | Jackson Hole Capital Partners, LLC | 750 | 0.00 | 49 | -5.77 | ||||
| 2025-09-04 | 13F/A | Advisor Group Holdings, Inc. | 9,894 | 19.71 | 650 | 11.32 | ||||
| 2025-08-12 | 13F | AlphaCore Capital LLC | 0 | -100.00 | 0 | |||||
| 2025-08-05 | 13F | Bank Of Montreal /can/ | 6,686 | -13.86 | 438 | -19.93 | ||||
| 2025-08-14 | 13F | Private Capital Management, LLC | 3,425 | 0.00 | 224 | -7.05 | ||||
| 2025-08-12 | 13F | Jpmorgan Chase & Co | 110,936 | 781.56 | 7,271 | 719.62 | ||||
| 2025-08-11 | 13F | TD Waterhouse Canada Inc. | 645 | 0.00 | 43 | -2.33 | ||||
| 2025-08-12 | 13F | LPL Financial LLC | 117,808 | -1.72 | 7,721 | -8.70 | ||||
| 2025-08-14 | 13F | Goldman Sachs Group Inc | 138,478 | 32.12 | 9,076 | 22.72 | ||||
| 2025-08-12 | 13F | Manchester Capital Management LLC | 3,000 | 0.00 | 197 | -7.11 | ||||
| 2025-05-15 | 13F | Two Sigma Investments, Lp | 0 | -100.00 | 0 | |||||
| 2025-08-13 | 13F | Russell Investments Group, Ltd. | 318 | 41.33 | 21 | 33.33 | ||||
| 2025-08-13 | 13F | Cary Street Partners Financial Llc | 3,327 | 0.00 | 218 | -6.84 | ||||
| 2025-08-08 | 13F | Cetera Investment Advisers | 13,220 | 12.85 | 866 | 4.84 | ||||
| 2025-08-14 | 13F | Guardian Wealth Advisors, Llc / Nc | 87 | 1.16 | 6 | -16.67 | ||||
| 2025-07-23 | 13F | Massachusetts Wealth Management | 15,720 | 2.11 | 1,030 | -5.16 | ||||
| 2025-07-29 | 13F | Harbor Asset Planning, Inc. | 412 | 27 | ||||||
| 2025-08-08 | 13F | Islay Capital Management, Llc | 630 | 0.00 | 41 | -6.82 | ||||
| 2025-08-14 | 13F | Warren Averett Asset Management, LLC | 3,910 | 0.00 | 256 | -6.91 | ||||
| 2025-08-15 | 13F | Equitable Holdings, Inc. | 0 | -100.00 | 0 | |||||
| 2025-07-18 | 13F | Union Bancaire Privee, UBP SA | 660 | 0.00 | 37 | -12.20 | ||||
| 2025-08-14 | 13F | Murphy & Mullick Capital Management Corp | 0 | -100.00 | 0 | |||||
| 2025-07-17 | 13F | Raleigh Capital Management Inc. | 1 | 0.00 | 0 | |||||
| 2025-07-22 | 13F | Wealthcare Advisory Partners LLC | 4,898 | 4.28 | 321 | -3.02 | ||||
| 2025-08-14 | 13F | Wiley Bros.-aintree Capital, Llc | 0 | -100.00 | 0 | |||||
| 2025-05-15 | 13F | D. E. Shaw & Co., Inc. | 0 | -100.00 | 0 | |||||
| 2025-08-13 | 13F | Raab & Moskowitz Asset Management LLC | 4,693 | -2.29 | 308 | -9.17 | ||||
| 2025-08-04 | 13F | Spire Wealth Management | 4,055 | -11.17 | 266 | -17.70 | ||||
| 2025-07-25 | 13F | Cwm, Llc | 264 | -19.27 | 0 | |||||
| 2025-05-09 | 13F | Commonwealth Retirement Investments LLC | 0 | -100.00 | 0 | |||||
| 2025-08-12 | 13F | Wayfinding Financial, LLC | 0 | -100.00 | 0 | |||||
| 2025-07-31 | 13F | Guardian Asset Advisors, LLC | 0 | -100.00 | 0 | |||||
| 2025-08-11 | 13F | Rothschild Investment Llc | 390 | 0.00 | 26 | -7.41 | ||||
| 2025-08-11 | 13F | HighTower Advisors, LLC | 14,066 | 5.15 | 922 | -2.33 | ||||
| 2025-08-14 | 13F | Mariner, LLC | 26,469 | -2.98 | 1,735 | -9.92 | ||||
| 2025-04-21 | 13F | Ronald Blue Trust, Inc. | 0 | -100.00 | 0 | |||||
| 2025-05-09 | 13F | Scotia Capital Inc. | 0 | -100.00 | 0 | |||||
| 2025-07-31 | 13F | Boothe Investment Group, Inc. | 9,189 | 602 | ||||||
| 2025-07-28 | 13F | Patten & Patten Inc/tn | 26,383 | -1.01 | 1,729 | -8.03 | ||||
| 2025-08-13 | 13F | Northwestern Mutual Wealth Management Co | 1,899 | -15.30 | 124 | -21.52 | ||||
| 2025-08-12 | 13F | Global Retirement Partners, LLC | 293 | -2.66 | 19 | 0.00 | ||||
| 2025-08-26 | 13F/A | Thrivent Financial For Lutherans | 37,636 | 4.73 | 2 | 0.00 | ||||
| 2025-07-22 | 13F | Grimes & Company, Inc. | 22,396 | 1,468 | ||||||
| 2025-07-16 | 13F/A | CX Institutional | 29 | -30.95 | 0 | |||||
| 2025-08-08 | 13F | Pnc Financial Services Group, Inc. | 1,281 | 0.00 | 84 | -7.78 | ||||
| 2025-08-11 | 13F | Principal Securities, Inc. | 324 | -85.64 | 21 | -85.81 | ||||
| 2025-07-10 | 13F | Piscataqua Savings Bank | 498 | 0.00 | 33 | -8.57 | ||||
| 2025-04-23 | 13F | Sabal Trust CO | 0 | -100.00 | 0 | |||||
| 2025-08-11 | 13F | HHM Wealth Advisors, LLC | 450 | 0.00 | 29 | -6.45 | ||||
| 2025-08-06 | 13F | Hallmark Capital Management Inc | 900 | 0.00 | 59 | -7.94 | ||||
| 2025-08-14 | 13F | Wells Fargo & Company/mn | 44,470 | -31.61 | 2,915 | -36.49 | ||||
| 2025-08-19 | 13F | Advisory Services Network, LLC | 4,178 | -2.75 | 275 | -9.57 | ||||
| 2025-05-14 | 13F | CIBC World Markets Inc. | 0 | -100.00 | 0 | |||||
| 2025-08-25 | NP | YLDE - ClearBridge Dividend Strategy ESG ETF This fund is a listed as child fund of Clearbridge, Llc and if that institution has disclosed ownership in this security, then these positions will not be double counted when calculating total shares and total value | 0 | -100.00 | 0 | -100.00 | ||||
| 2025-07-18 | 13F | Institute for Wealth Management, LLC. | 11,198 | -0.75 | 734 | -7.91 | ||||
| 2025-08-15 | 13F | Captrust Financial Advisors | 4,810 | -5.39 | 315 | -12.01 | ||||
| 2025-07-18 | 13F | Bartlett & Co. Wealth Management Llc | 90 | 0.00 | 6 | -16.67 | ||||
| 2025-07-15 | 13F | Mather Group, Llc. | 0 | -100.00 | 0 | |||||
| 2025-07-17 | 13F | Janney Montgomery Scott LLC | 6,829 | -5.82 | 0 | |||||
| 2025-08-14 | 13F | Royal Bank Of Canada | 116,187 | 13.93 | 7,615 | 5.81 | ||||
| 2025-08-05 | 13F | Simplex Trading, Llc | 24 | 0 | ||||||
| 2025-08-12 | 13F | Running Point Capital Advisors, LLC | 135 | 0.00 | 9 | -11.11 | ||||
| 2025-07-24 | 13F | Us Bancorp \de\ | 384 | 0.00 | 25 | -7.41 | ||||
| 2025-08-12 | 13F | O'shaughnessy Asset Management, Llc | 199 | -3.40 | 13 | -7.14 | ||||
| 2025-07-25 | 13F | SPC Financial, Inc. | 3,090 | 0.00 | 203 | -7.34 | ||||
| 2025-07-10 | 13F | Wealth Enhancement Advisory Services, Llc | 3,967 | 264 | ||||||
| 2025-08-18 | 13F/A | National Bank Of Canada /fi/ | 410 | 0.00 | 27 | -7.14 | ||||
| 2025-07-11 | 13F | Matthew Goff Investment Advisor, LLC | 3,615 | 0.00 | 237 | -7.45 | ||||
| 2025-07-22 | 13F | Woodmont Investment Counsel Llc | 5,574 | 0.00 | 365 | -7.12 | ||||
| 2025-08-12 | 13F | Proequities, Inc. | 0 | 0 | ||||||
| 2025-08-07 | 13F | Allworth Financial LP | 1,538 | 7.55 | 101 | 6.38 | ||||
| 2025-08-12 | 13F | Asset Management Group, Inc. | 12,769 | 0.48 | 837 | -6.70 | ||||
| 2025-08-14 | 13F | Federation des caisses Desjardins du Quebec | 4,375 | 4.79 | 287 | -2.72 | ||||
| 2025-07-22 | 13F | Coastal Investment Advisors, Inc. | 900 | 0.00 | 59 | -7.94 | ||||
| 2025-08-14 | 13F | CoreCap Advisors, LLC | 100 | 7 | ||||||
| 2025-08-04 | 13F | Creative Financial Designs Inc /adv | 262 | 0.38 | 17 | -5.56 | ||||
| 2025-08-06 | 13F | Commonwealth Equity Services, Llc | 32,565 | -11.61 | 2 | 0.00 | ||||
| 2025-08-18 | 13F | N.E.W. Advisory Services LLC | 0 | -100.00 | 0 | |||||
| 2025-07-31 | 13F | Oak Harbor Wealth Partners, Llc | 210 | 0.00 | 14 | -7.14 | ||||
| 2025-07-23 | NP | FAAAX - Franklin K2 Alternative Strategies Fund Class A | Short | -53,060 | 32.06 | -3,454 | 18.29 | |||
| 2025-05-15 | 13F | Bank Of America Corp /de/ | Call | 0 | -100.00 | 0 | -100.00 | |||
| 2025-07-18 | 13F | Truist Financial Corp | 9,104 | 2.85 | 593 | -5.13 | ||||
| 2025-08-14 | 13F | Strive Asset Management, LLC | 0 | -100.00 | 0 | |||||
| 2025-08-12 | 13F | Franklin Resources Inc | 198 | 0.00 | 13 | -7.69 | ||||
| 2025-04-08 | 13F | Welch Group, LLC | 0 | -100.00 | 0 | |||||
| 2025-04-14 | 13F | Pallas Capital Advisors LLC | 0 | -100.00 | 0 | |||||
| 2025-08-14 | 13F | Aft, Forsyth & Company, Inc. | 3,440 | 0.29 | 225 | -7.02 | ||||
| 2025-08-14 | 13F | Susquehanna International Group, Llp | 42,566 | -11.47 | 2,790 | -17.78 | ||||
| 2025-08-05 | 13F | Huntington National Bank | 14 | -6.67 | ||||||
| 2025-08-15 | 13F | Northeast Financial Consultants Inc | 4,140 | 0.00 | 271 | -7.19 | ||||
| 2025-07-21 | 13F | Ameritas Advisory Services, LLC | 2,574 | 169 | ||||||
| 2025-08-13 | 13F | Twin Peaks Wealth Advisors, LLC | 84 | 6 | ||||||
| 2025-07-08 | 13F | Parallel Advisors, LLC | 0 | -100.00 | 0 | |||||
| 2025-08-13 | 13F | Continuum Advisory, LLC | 0 | -100.00 | 0 | |||||
| 2025-08-12 | 13F | YANKCOM Partnership | 81 | 0.00 | 5 | 0.00 | ||||
| 2025-04-14 | 13F | Farther Finance Advisors, LLC | 0 | -100.00 | 0 | |||||
| 2025-07-22 | 13F | Merit Financial Group, LLC | 31,323 | 0.42 | 2,053 | -6.73 | ||||
| 2025-08-13 | 13F | Beacon Pointe Advisors, LLC | 19,985 | 0.50 | 1,310 | -6.70 | ||||
| 2025-07-16 | 13F | Brown, Lisle/cummings, Inc. | 2,376 | 5.74 | 156 | -1.90 | ||||
| 2025-07-29 | 13F | Kraft, Davis & Associates, LLC | 0 | -100.00 | 0 | |||||
| 2025-08-12 | 13F | Fairscale Capital, LLC | 303 | 20 | ||||||
| 2025-07-17 | 13F/A | Capital Investment Advisors, LLC | 7,124 | 28.68 | 467 | 19.49 | ||||
| 2025-08-18 | 13F | Geneos Wealth Management Inc. | 798 | 0.00 | 52 | -7.14 | ||||
| 2025-08-13 | 13F | Fisher Asset Management, LLC | 2,976,691 | -5.29 | 195,092 | -12.03 | ||||
| 2025-08-14 | 13F | Bnp Paribas Arbitrage, Sa | 200,000 | 13,108 | ||||||
| 2025-08-12 | 13F | MAI Capital Management | 860 | 0.12 | 56 | -6.67 | ||||
| 2025-08-13 | 13F | Capital Analysts, Inc. | 932 | 0.00 | 0 | |||||
| 2025-07-03 | 13F | Garde Capital, Inc. | 0 | -100.00 | 0 | |||||
| 2025-08-14 | 13F | Fmr Llc | 11,897 | -1.70 | 780 | -8.68 | ||||
| 2025-08-07 | 13F | Runnymede Capital Advisors, Inc. | 0 | -100.00 | 0 | |||||
| 2025-07-23 | 13F | Kingswood Wealth Advisors, Llc | 3,100 | 203 | ||||||
| 2025-07-18 | 13F | SOA Wealth Advisors, LLC. | 84 | 0.00 | 6 | 0.00 | ||||
| 2025-08-14 | 13F | Comerica Bank | 2,122 | -10.08 | 139 | -16.27 | ||||
| 2025-07-22 | 13F | Apexium Financial, Lp | 3,484 | 0.20 | 228 | -6.94 | ||||
| 2025-05-14 | 13F | REAP Financial Group, LLC | 0 | -100.00 | 0 | |||||
| 2025-08-14 | 13F | Two Sigma Securities, Llc | 0 | -100.00 | 0 | |||||
| 2025-08-14 | 13F | Ameriprise Financial Inc | 23,658 | 491.89 | 1,550 | 449.29 | ||||
| 2025-07-15 | 13F | Fifth Third Bancorp | 1,167 | -7.45 | 76 | -13.64 | ||||
| 2025-08-15 | 13F | Tower Research Capital LLC (TRC) | 18,116 | 25.91 | 1,187 | 16.95 | ||||
| 2025-07-28 | 13F | Harbour Investments, Inc. | 499 | 13.93 | 33 | 6.67 | ||||
| 2025-08-14 | 13F | Citadel Advisors Llc | 38,321 | 71.08 | 2,512 | 58.92 | ||||
| 2025-08-14 | 13F | BTG Pactual Asset Management US LLC | 87 | 0.00 | 6 | -16.67 | ||||
| 2025-08-06 | 13F | AE Wealth Management LLC | 156 | 67.74 | 10 | 66.67 | ||||
| 2025-08-01 | 13F | First Command Advisory Services, Inc. | 54 | 0.00 | 4 | 0.00 | ||||
| 2025-07-02 | 13F | First Financial Bank - Trust Division | 6,396 | 0.00 | 419 | -7.10 | ||||
| 2025-08-14 | 13F | UBS Group AG | 41,406 | 12.93 | 2,714 | 4.87 | ||||
| 2025-08-27 | NP | FFOX - FundX Future Fund Opportunities ETF | 135 | 9 | ||||||
| 2025-04-28 | 13F | Strategic Financial Concepts, LLC | 0 | -100.00 | 0 | -100.00 | ||||
| 2025-07-18 | 13F | Trust Co Of Vermont | 609 | 0.00 | 40 | -7.14 | ||||
| 2025-08-11 | 13F | Aptus Capital Advisors, LLC | 87 | 1.16 | 6 | -16.67 | ||||
| 2025-08-14 | 13F | Mml Investors Services, Llc | 4,615 | 40.40 | 0 | |||||
| 2025-07-29 | 13F | Stratos Wealth Advisors, LLC | 0 | -100.00 | 0 | |||||
| 2025-08-05 | 13F | EPG Wealth Management LLC | 106 | 0.95 | 7 | -14.29 | ||||
| 2025-05-14 | 13F | Orion Portfolio Solutions, LLC | 10,465 | 0.00 | 688 | 0.00 | ||||
| 2025-08-01 | 13F | Brinker Capital Investments, LLC | 0 | -100.00 | 0 | -100.00 | ||||
| 2025-08-14 | 13F | Qube Research & Technologies Ltd | 0 | -100.00 | 0 | |||||
| 2025-07-14 | 13F | Farmers & Merchants Investments Inc | 150 | 0.00 | 10 | -10.00 | ||||
| 2025-08-08 | 13F | Gts Securities Llc | 0 | -100.00 | 0 | |||||
| 2025-07-11 | 13F | Essex Savings Bank | 3,300 | 0.00 | 216 | -6.90 | ||||
| 2025-07-30 | 13F | Cookson Peirce & Co Inc | 0 | -100.00 | 0 |