Mga Batayang Estadistika
| Pemilik Institusional | 121 total, 121 long only, 0 short only, 0 long/short - change of -6.15% MRQ |
| Alokasi Portofolio Rata-rata | 0.2328 % - change of 6.09% MRQ |
| Saham Institusional (Jangka Panjang) | 2,606,226 (ex 13D/G) - change of -0.18MM shares -6.38% MRQ |
| Nilai Institusional (Jangka Panjang) | $ 354,857 USD ($1000) |
Kepemilikan Institusional dan Pemegang Saham
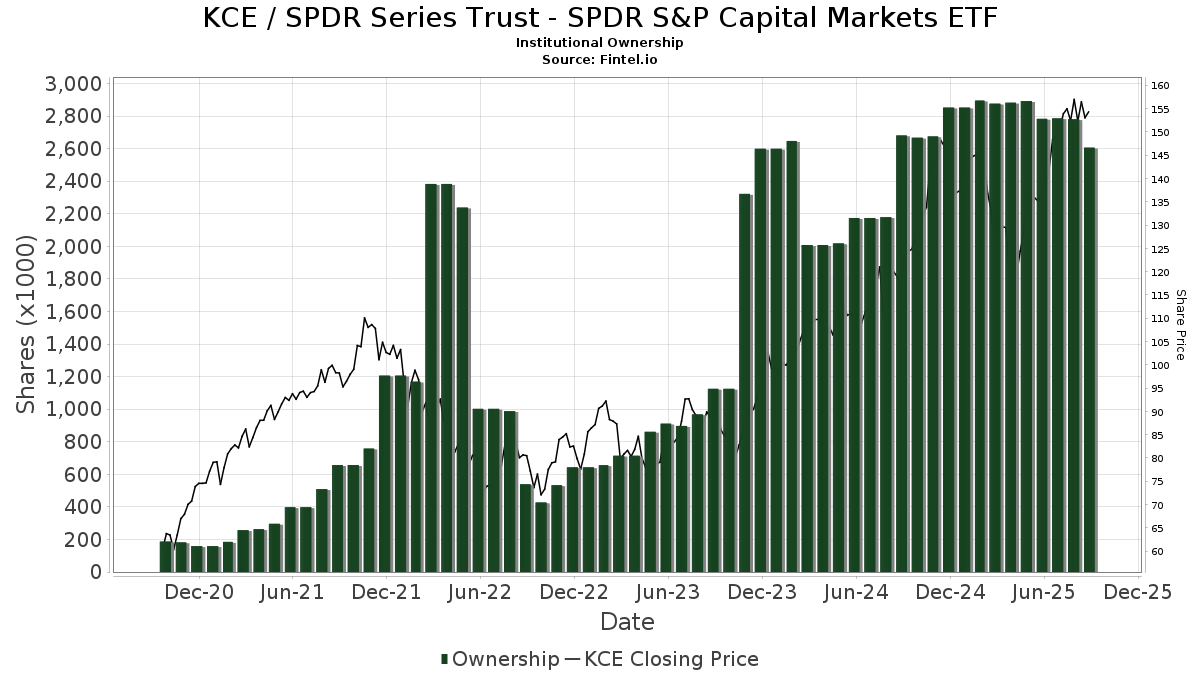
SPDR Series Trust - SPDR S&P Capital Markets ETF (US:KCE) memiliki 121 pemilik institusional dan pemegang saham yang telah mengajukan formulir 13D/G atau 13F kepada Komisi Bursa Efek (Securities Exchange Commission/SEC). Lembaga-lembaga ini memegang total 2,606,226 saham. Pemegang saham terbesar meliputi Bank Of America Corp /de/, Meitav Dash Investments Ltd, Morgan Stanley, Kranot Hishtalmut Le Morim Ve Gananot Havera Menahelet LTD, LPL Financial LLC, 360 Financial, Inc., UBS Group AG, Thrivent Financial For Lutherans, Grimes & Company, Inc., and Fisher Asset Management, LLC .
Struktur kepemilikan institusional SPDR Series Trust - SPDR S&P Capital Markets ETF (ARCA:KCE) menunjukkan posisi terkini di perusahaan oleh institusi dan dana, serta perubahan terbaru dalam ukuran posisi. Pemegang saham utama dapat mencakup investor individu, reksa dana, dana lindung nilai, atau institusi. Jadwal 13D menunjukkan bahwa investor memegang (atau pernah memegang) lebih dari 5% saham perusahaan dan bermaksud (atau pernah bermaksud) untuk secara aktif mengejar perubahan strategi bisnis. Jadwal 13G menunjukkan investasi pasif lebih dari 5%.
The share price as of September 5, 2025 is 152.66 / share. Previously, on September 6, 2024, the share price was 116.40 / share. This represents an increase of 31.15% over that period.
Skor Sentimen Dana
Skor Sentimen Dana (sebelumnya dikenal sebagai Skor Akumulasi Kepemilikan) menemukan saham-saham yang paling banyak dibeli oleh dana. Ini adalah hasil dari model kuantitatif multi-faktor yang canggih yang mengidentifikasi perusahaan dengan tingkat akumulasi institusional tertinggi. Model penilaian menggunakan kombinasi dari total peningkatan pemilik yang diungkapkan, perubahan dalam alokasi portofolio pada pemilik tersebut, dan metrik lainnya. Angka berkisar dari 0 hingga 100, dengan angka yang lebih tinggi menunjukkan tingkat akumulasi yang lebih tinggi dibandingkan dengan perusahaan sejenisnya, dan 50 adalah rata-ratanya.
Frekuensi Pembaruan: Setiap Hari
Lihat Ownership Explorer, yang menyediakan daftar perusahaan dengan peringkat tertinggi.
Rasio Put/Call Institusional
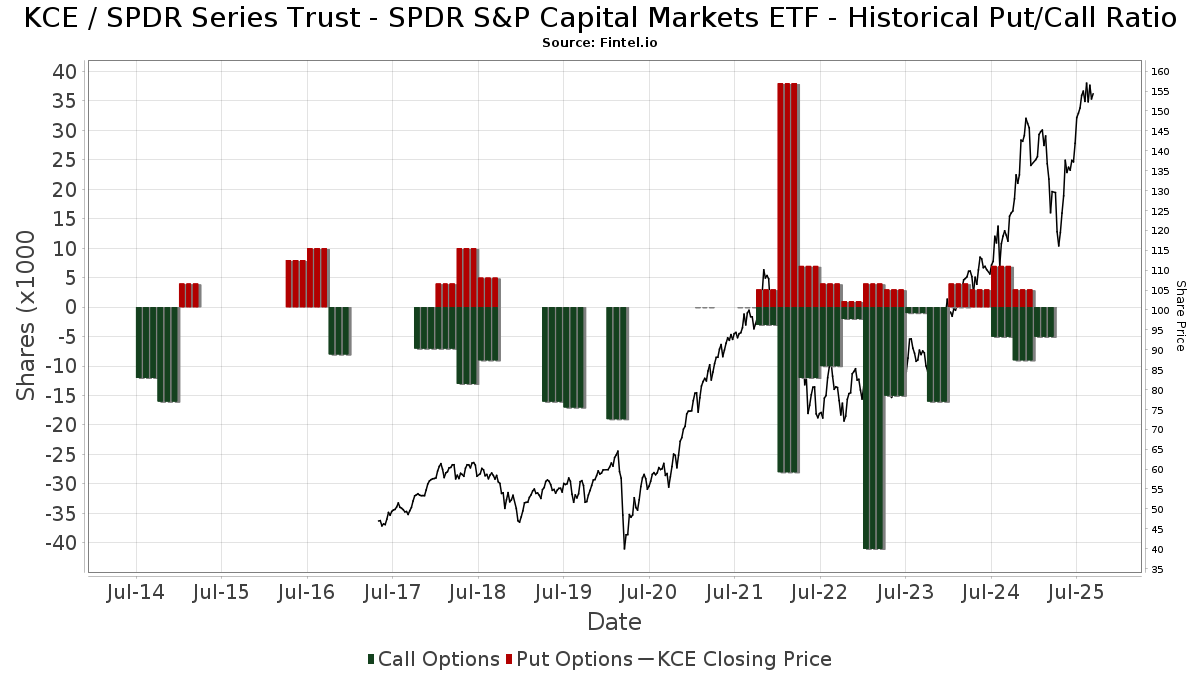
Selain melaporkan isu ekuitas dan utang standar, institusi dengan aset di bawah manajemen lebih dari 100 juta dolar AS juga harus mengungkapkan kepemilikan opsi put dan call mereka. Karena opsi put umumnya menunjukkan sentimen negatif, dan opsi call menunjukkan sentimen positif, kita dapat mengetahui sentimen institusional secara keseluruhan dengan memplot rasio put terhadap call. Grafik di sebelah kanan memplot rasio put/call historis untuk instrumen ini.
Menggunakan Rasio Put/Call sebagai indikator sentimen investor mengatasi salah satu kekurangan utama dari penggunaan total kepemilikan institusional, yaitu sejumlah besar aset yang dikelola diinvestasikan secara pasif untuk melacak indeks. Dana yang dikelola secara pasif biasanya tidak membeli opsi, sehingga indikator rasio put/call lebih akurat dalam melacak sentimen dana yang dikelola secara aktif.
Pengajuan 13F dan NPORT
Detail pada pengajuan 13F tersedia gratis. Detail pada pengajuan NP memerlukan keanggotaan premium. Baris berwarna hijau menunjukkan posisi baru. Baris berwarna merah menunjukkan posisi yang sudah ditutup. Klik tautan ini ikon untuk melihat riwayat transaksi selengkapnya.
Tingkatkan
untuk membuka data premium dan mengekspor ke Excel ![]() .
.
| Tanggal File | Sumber | Investor | Ketik | Presyo ng Avg (Silangan) |
Saham | Δ Saham (%) |
Dilaporkan Nilai ($1000) |
Nilai Δ (%) |
Alokasi Port (%) |
|
|---|---|---|---|---|---|---|---|---|---|---|
| 2025-05-12 | 13F | Independent Advisor Alliance | 0 | -100.00 | 0 | |||||
| 2025-08-14 | 13F | Mariner, LLC | 17,127 | -20.61 | 2,482 | -8.78 | ||||
| 2025-05-12 | 13F | Jpmorgan Chase & Co | 0 | -100.00 | 0 | |||||
| 2025-07-16 | 13F | TigerOak Management, L.L.C. | 28,340 | -1.31 | 4,107 | 13.39 | ||||
| 2025-08-12 | 13F | CIBC Private Wealth Group, LLC | 1,754 | 0.34 | 254 | 34.39 | ||||
| 2025-08-14 | 13F | Susquehanna International Group, Llp | Call | 0 | -100.00 | 0 | ||||
| 2025-08-07 | 13F | Blackston Financial Advisory Group, LLC | 1,688 | -7.51 | 245 | 6.09 | ||||
| 2025-07-02 | 13F | Central Pacific Bank - Trust Division | 18 | 0.00 | 3 | 0.00 | ||||
| 2025-07-22 | 13F | IMC-Chicago, LLC | 21,878 | -57.51 | 3,171 | -51.20 | ||||
| 2025-07-25 | 13F | Lion Street Advisors, LLC | 1,494 | 217 | ||||||
| 2025-08-12 | 13F | Steward Partners Investment Advisory, Llc | 2,832 | -46.31 | 410 | -38.35 | ||||
| 2025-07-02 | 13F | HBW Advisory Services LLC | 3,189 | -2.18 | 462 | 12.41 | ||||
| 2025-07-30 | 13F | Cavalier Investments, LLC | 26,328 | 0.00 | 3,816 | 14.88 | ||||
| 2025-08-19 | 13F | Asset Dedication, LLC | 85 | 0.00 | 12 | 20.00 | ||||
| 2025-08-19 | 13F | Advisory Services Network, LLC | 0 | -100.00 | 0 | |||||
| 2025-08-12 | 13F | Park Square Financial Group, LLC | 48 | 0.00 | 7 | 0.00 | ||||
| 2025-08-14 | 13F | UBS Group AG | 99,817 | -2.68 | 14,466 | 11.79 | ||||
| 2025-07-24 | 13F | Blair William & Co/il | 399 | -5.90 | 58 | 7.55 | ||||
| 2025-07-22 | 13F | Merit Financial Group, LLC | 16,436 | -63.75 | 2,382 | -58.35 | ||||
| 2025-08-18 | 13F | Hollencrest Capital Management | 5 | 0.00 | 1 | |||||
| 2025-07-30 | NP | ENDW - Cambria Endowment Style ETF | 17 | 2 | ||||||
| 2025-08-14 | 13F | Qube Research & Technologies Ltd | 349 | 226.17 | 51 | 284.62 | ||||
| 2025-08-01 | 13F | Envestnet Asset Management Inc | 19,813 | -0.53 | 2,871 | 14.25 | ||||
| 2025-08-14 | 13F | CoreCap Advisors, LLC | 13 | 0.00 | 2 | 0.00 | ||||
| 2025-08-06 | 13F | Commonwealth Equity Services, Llc | 3,557 | -36.85 | 1 | |||||
| 2025-08-08 | 13F | Good Life Advisors, LLC | 0 | -100.00 | 0 | |||||
| 2025-08-13 | 13F | Walleye Capital LLC | 0 | -100.00 | 0 | |||||
| 2025-08-07 | 13F | Aspen Wealth Strategies, LLC | 14,026 | 12.78 | 2,033 | 29.51 | ||||
| 2025-04-09 | 13F | Kaizen Financial Strategies | 0 | -100.00 | 0 | |||||
| 2025-08-14 | 13F | Jane Street Group, Llc | 8,609 | -44.74 | 1,248 | -36.54 | ||||
| 2025-05-12 | 13F | Founders Financial Securities Llc | 0 | -100.00 | 0 | |||||
| 2025-08-13 | 13F | Royal Fund Management, LLC | 49,817 | 2.59 | 7,235 | 17.41 | ||||
| 2025-09-04 | 13F/A | Advisor Group Holdings, Inc. | 8,806 | -2.60 | 1,265 | 10.87 | ||||
| 2025-07-31 | 13F | Kranot Hishtalmut Le Morim Tichoniim Havera Menahelet LTD | 47,687 | 0.00 | 6,915 | 15.00 | ||||
| 2025-08-14 | 13F | Stifel Financial Corp | 11,824 | 6.85 | 1,714 | 22.71 | ||||
| 2025-08-12 | 13F | Gladstone Institutional Advisory LLC | 5,897 | -1.01 | 855 | 13.72 | ||||
| 2025-08-14 | 13F | Susquehanna International Group, Llp | 12,765 | 19.17 | 1,850 | 36.94 | ||||
| 2025-07-18 | 13F | Vicus Capital | 25,039 | 8.90 | 3,629 | 25.06 | ||||
| 2025-08-14 | 13F | Wells Fargo & Company/mn | 0 | -100.00 | 0 | -100.00 | ||||
| 2025-08-15 | 13F | Provenance Wealth Advisors, LLC | 225 | 0.00 | 33 | 14.29 | ||||
| 2025-08-11 | 13F | Tidemark, LLC | 1,521 | -0.52 | 220 | 14.58 | ||||
| 2025-08-11 | 13F | Principal Securities, Inc. | 210 | 180.00 | 30 | 200.00 | ||||
| 2025-07-17 | 13F | Janney Montgomery Scott LLC | 5,654 | -13.45 | 1 | |||||
| 2025-08-12 | 13F | Proequities, Inc. | 0 | 0 | ||||||
| 2025-08-11 | 13F | HighTower Advisors, LLC | 24,583 | 0.02 | 3,563 | 14.90 | ||||
| 2025-08-26 | 13F/A | Thrivent Financial For Lutherans | 99,019 | 14 | ||||||
| 2025-07-21 | 13F | Ameritas Advisory Services, LLC | 11 | 2 | ||||||
| 2025-08-14 | 13F | Fort Point Capital Partners LLC | 9,359 | 1.99 | 1,356 | 17.20 | ||||
| 2025-08-15 | 13F | Equitable Holdings, Inc. | 1,400 | -53.83 | 203 | -47.12 | ||||
| 2025-08-05 | 13F | Simplex Trading, Llc | 0 | -100.00 | 0 | |||||
| 2025-08-26 | NP | LCR - Leuthold Core ETF | 4,103 | 2.42 | 595 | 17.62 | ||||
| 2025-08-08 | 13F | Avantax Advisory Services, Inc. | 4,614 | 669 | ||||||
| 2025-07-31 | 13F | Orion Capital Management LLC | 76 | 1.33 | 11 | 11.11 | ||||
| 2025-08-04 | 13F | Arkadios Wealth Advisors | 5,115 | 0.00 | 741 | 14.88 | ||||
| 2025-08-11 | 13F | Brown Brothers Harriman & Co | 488 | 0.00 | 71 | 14.75 | ||||
| 2025-08-14 | 13F | D. E. Shaw & Co., Inc. | 3,311 | 0.00 | 480 | 14.87 | ||||
| 2025-05-15 | 13F | Federation des caisses Desjardins du Quebec | 0 | -100.00 | 0 | |||||
| 2025-08-14 | 13F | Bank Of America Corp /de/ | 604,363 | -15.61 | 87,590 | -3.06 | ||||
| 2025-04-17 | 13F | Highline Wealth Partners Llc | 0 | -100.00 | 0 | -100.00 | ||||
| 2025-08-12 | 13F | Global Retirement Partners, LLC | 16 | 6.67 | 2 | 0.00 | ||||
| 2025-07-28 | NP | AGOX - Adaptive Growth Opportunities ETF | 26,328 | 0.00 | 3,556 | -2.50 | ||||
| 2025-08-12 | 13F | BlackRock, Inc. | 11 | 2 | ||||||
| 2025-05-30 | NP | ERNZ - TrueShares Active Yield ETF | 1,347 | 170 | ||||||
| 2025-08-04 | 13F | Whalen Wealth Management Inc. | 0 | -100.00 | 0 | |||||
| 2025-08-14 | 13F | Comerica Bank | 250 | 25.00 | 36 | 44.00 | ||||
| 2025-08-05 | 13F | Advisors Preferred, LLC | 0 | -100.00 | 0 | |||||
| 2025-08-06 | 13F | AE Wealth Management LLC | 572 | -0.17 | 83 | 13.89 | ||||
| 2025-08-13 | 13F | Leuthold Group, Llc | 4,402 | 2.42 | 638 | 17.53 | ||||
| 2025-05-01 | 13F | Coastal Investment Advisors, Inc. | 0 | -100.00 | 0 | |||||
| 2025-08-14 | 13F | DHK Financial Advisors, Inc. | 10,093 | 0.42 | 1,463 | 15.30 | ||||
| 2025-07-23 | 13F | Meitav Dash Investments Ltd | 262,315 | 0.01 | 38,017 | 14.88 | ||||
| 2025-07-29 | 13F | Stephens Inc /ar/ | 5,538 | -0.23 | 803 | 14.57 | ||||
| 2025-08-14 | 13F | Goldman Sachs Group Inc | 4,237 | 103.02 | 614 | 133.46 | ||||
| 2025-07-10 | 13F | Global Financial Private Client, LLC | 8,126 | -0.05 | 1,178 | 14.83 | ||||
| 2025-07-17 | 13F | City Holding Co | 45 | 0.00 | 7 | 20.00 | ||||
| 2025-07-28 | 13F | Harbour Investments, Inc. | 51 | 0.00 | 7 | 16.67 | ||||
| 2025-08-15 | 13F | Kestra Advisory Services, LLC | 7,182 | 0.79 | 1,041 | 15.68 | ||||
| 2025-08-08 | 13F | Pnc Financial Services Group, Inc. | 3,004 | -4.85 | 435 | 9.30 | ||||
| 2025-08-13 | 13F | Baker Avenue Asset Management, LP | 29,859 | 4.21 | 4,327 | 19.70 | ||||
| 2025-04-11 | 13F | IAM Advisory, LLC | 0 | -100.00 | 0 | -100.00 | ||||
| 2025-07-10 | 13F | HF Advisory Group, LLC | 2,706 | 0.89 | 392 | 15.98 | ||||
| 2025-05-01 | 13F | Fulcrum Equity Management | 0 | -100.00 | 0 | |||||
| 2025-08-13 | 13F | Flow Traders U.s. Llc | 0 | -100.00 | 0 | |||||
| 2025-08-15 | 13F | Tower Research Capital LLC (TRC) | 4,673 | -63.82 | 677 | -58.44 | ||||
| 2025-08-14 | 13F | Royal Bank Of Canada | 11,366 | 200.21 | 1,648 | 245.49 | ||||
| 2025-08-04 | 13F | Assetmark, Inc | 769 | -68.21 | 111 | -63.61 | ||||
| 2025-08-14 | 13F | Citadel Advisors Llc | Call | 0 | -100.00 | 0 | ||||
| 2025-08-14 | 13F | Citadel Advisors Llc | Put | 0 | -100.00 | 0 | ||||
| 2025-08-01 | 13F | Ferguson Shapiro LLC | 4,855 | -13.38 | 704 | -0.57 | ||||
| 2025-07-30 | 13F | Nottingham Advisors, Inc. | 44,118 | 0.42 | 6,394 | 15.33 | ||||
| 2025-04-30 | 13F | Stratos Wealth Advisors, LLC | 0 | -100.00 | 0 | -100.00 | ||||
| 2025-08-12 | 13F | Franklin Resources Inc | 112 | 16 | ||||||
| 2025-05-15 | 13F | Two Sigma Investments, Lp | 0 | -100.00 | 0 | |||||
| 2025-08-14 | 13F | Money Concepts Capital Corp | 9,421 | -4.04 | 1,365 | 10.26 | ||||
| 2025-05-08 | NP | QALTX - Quantified Alternative Investment Fund Investor Class Shares | 417 | -68.39 | 53 | -71.27 | ||||
| 2025-04-14 | 13F | Courier Capital Llc | 0 | -100.00 | 0 | |||||
| 2025-05-12 | 13F | AMJ Financial Wealth Management | 0 | -100.00 | 0 | |||||
| 2025-08-04 | 13F | IFG Advisory, LLC | 0 | -100.00 | 0 | |||||
| 2025-07-25 | 13F | Community Bank, N.A. | 20,638 | 5.62 | 2,991 | 21.34 | ||||
| 2025-07-07 | 13F | Nova Wealth Management, Inc. | 1,595 | 13.60 | 231 | 30.51 | ||||
| 2025-08-12 | 13F | O'shaughnessy Asset Management, Llc | 28 | -37.78 | 4 | -20.00 | ||||
| 2025-07-10 | 13F | Peoples Bank/KS | 0 | -100.00 | 0 | |||||
| 2025-07-14 | 13F | Masso Torrence Wealth Management Inc. | 24,442 | -4.62 | 3,542 | 9.56 | ||||
| 2025-08-13 | 13F | Colonial Trust Co / SC | 41 | 0.00 | 6 | 0.00 | ||||
| 2025-07-23 | 13F | Fluent Financial, LLC | 20,292 | 2,941 | ||||||
| 2025-05-08 | 13F | Geneos Wealth Management Inc. | 0 | -100.00 | 0 | |||||
| 2025-08-06 | 13F | Legacy Wealth Managment, LLC/ID | 77 | 0.00 | 11 | 22.22 | ||||
| 2025-07-30 | 13F | WESPAC Advisors SoCal, LLC | 11,910 | -1.72 | 1,726 | 12.88 | ||||
| 2025-08-05 | 13F | Provident Co of the Employees of the Hebrew University LTD | 27,651 | 0.00 | 4,010 | 15.00 | ||||
| 2025-07-21 | 13F | Mirae Asset Global Investments Co., Ltd. | 1,000 | 145 | ||||||
| 2025-08-06 | 13F | 360 Financial, Inc. | 102,569 | 4.27 | 14,865 | 19.77 | ||||
| 2025-07-11 | 13F | Spence Asset Management | 16,901 | 2.65 | 2 | 0.00 | ||||
| 2025-08-06 | 13F | Legacy Investment Solutions, LLC | 77 | 0.00 | 11 | 0.00 | ||||
| 2025-07-25 | 13F | Atria Wealth Solutions, Inc. | 0 | -100.00 | 0 | |||||
| 2025-07-28 | 13F | Rosenberg Matthew Hamilton | 0 | -100.00 | 0 | |||||
| 2025-08-14 | 13F | GWM Advisors LLC | 2,099 | -4.24 | 304 | 10.14 | ||||
| 2025-08-01 | 13F | Delta Investment Management, LLC | 2,052 | -17.29 | 297 | -5.11 | ||||
| 2025-08-06 | 13F/A | Headland Capital, LLC | 2,616 | -8.31 | 379 | 5.57 | ||||
| 2025-08-14 | 13F | Fmr Llc | 1,516 | 5.72 | 220 | 21.67 | ||||
| 2025-07-22 | 13F | Accel Wealth Management | 13,408 | 10.86 | 1,943 | 27.41 | ||||
| 2025-07-22 | 13F | Miracle Mile Advisors, LLC | 0 | -100.00 | 0 | |||||
| 2025-07-31 | 13F | Cambridge Investment Research Advisors, Inc. | 7,321 | -18.05 | 1 | 0.00 | ||||
| 2025-08-06 | 13F | Csenge Advisory Group | 9,783 | 2.69 | 1,321 | 18.58 | ||||
| 2025-08-13 | 13F | Northwestern Mutual Wealth Management Co | 1,704 | 6.70 | 247 | 22.89 | ||||
| 2025-07-08 | 13F | Parallel Advisors, LLC | 174 | -7.45 | 25 | 8.70 | ||||
| 2025-07-29 | 13F | Private Trust Co Na | 850 | -20.41 | 123 | -8.21 | ||||
| 2025-07-17 | 13F | Global Trust Asset Management, LLC | 0 | -100.00 | 0 | |||||
| 2025-05-15 | 13F | Hrt Financial Lp | 0 | -100.00 | 0 | |||||
| 2025-08-05 | 13F | Bank Of Montreal /can/ | 615 | 0.00 | 89 | 15.58 | ||||
| 2025-07-23 | 13F | Foresight Capital Management Advisors, Inc. | 0 | -100.00 | 0 | |||||
| 2025-08-15 | 13F | Morgan Stanley | 225,991 | -23.21 | 32,753 | -11.80 | ||||
| 2025-08-05 | 13F | Tsfg, Llc | 45 | 0.00 | 0 | |||||
| 2025-08-14 | 13F | EP Wealth Advisors, Inc. | 1,191 | 0.00 | 173 | 14.67 | ||||
| 2025-05-02 | 13F | Fortis Group Advisors, LLC | 0 | -100.00 | 0 | |||||
| 2025-03-17 | 13F/A | Wealth Enhancement Advisory Services, Llc | 0 | -100.00 | 0 | |||||
| 2025-08-11 | 13F | Private Advisor Group, LLC | 4,924 | -5.58 | 714 | 8.36 | ||||
| 2025-04-21 | 13F | Trivant Custom Portfolio Group, LLC | 0 | -100.00 | 0 | |||||
| 2025-05-06 | 13F | Proficio Capital Partners LLC | 0 | -100.00 | 0 | -100.00 | ||||
| 2025-07-15 | 13F | Main Street Group, LTD | 145 | 0.00 | 21 | 16.67 | ||||
| 2025-07-17 | 13F | Independence Bank of Kentucky | 25 | 0.00 | 4 | 0.00 | ||||
| 2025-08-04 | 13F | Spire Wealth Management | 0 | -100.00 | 0 | |||||
| 2025-08-14 | 13F | Citadel Advisors Llc | 7,731 | 29.43 | 1,120 | 48.74 | ||||
| 2025-08-26 | 13F | Claris Financial LLC | 0 | -100.00 | 0 | |||||
| 2025-08-14 | 13F | Mml Investors Services, Llc | 22,478 | -2.22 | 3 | 50.00 | ||||
| 2025-04-29 | 13F | Quattro Financial Advisors Llc | 0 | -100.00 | 0 | |||||
| 2025-08-14 | 13F | MGB Wealth Management, LLC | 1,097 | 0.00 | 159 | 14.49 | ||||
| 2025-07-08 | 13F | Nbc Securities, Inc. | 0 | -100.00 | 0 | |||||
| 2025-08-14 | 13F | Sunbelt Securities, Inc. | 53 | 0.00 | 7 | 16.67 | ||||
| 2025-07-11 | 13F | Farther Finance Advisors, LLC | 22 | -53.19 | 3 | -40.00 | ||||
| 2025-07-15 | 13F | MCF Advisors LLC | 173 | 0.00 | 25 | 19.05 | ||||
| 2025-08-13 | 13F | Custom Index Systems, Llc | 2,016 | -55.38 | 292 | -48.77 | ||||
| 2025-08-12 | 13F | Coldstream Capital Management Inc | 0 | -100.00 | 0 | |||||
| 2025-08-14 | 13F | Raymond James Financial Inc | 23,258 | -12.88 | 3,371 | 0.06 | ||||
| 2025-07-31 | 13F | Oppenheimer & Co Inc | 11,507 | 3.73 | 1,668 | 19.16 | ||||
| 2025-07-15 | 13F | Cranbrook Wealth Management, LLC | 20 | 0.00 | 3 | 0.00 | ||||
| 2025-07-31 | 13F | Kranot Hishtalmut Le Morim Ve Gananot Havera Menahelet LTD | 138,163 | 0.00 | 20,036 | 15.00 | ||||
| 2025-07-31 | 13F | Wealthfront Advisers Llc | 4,203 | 2.54 | 609 | 17.79 | ||||
| 2025-08-08 | 13F | Larson Financial Group LLC | 358 | -3.76 | 52 | 10.87 | ||||
| 2025-08-08 | 13F | Gts Securities Llc | 14,397 | 2,087 | ||||||
| 2025-08-14 | 13F | Barometer Capital Management Inc. | 900 | 130 | ||||||
| 2025-08-12 | 13F | LPL Financial LLC | 131,811 | -12.79 | 19,103 | 0.18 | ||||
| 2025-08-08 | 13F | Cetera Investment Advisers | 5,593 | -2.59 | 811 | 11.88 | ||||
| 2025-07-22 | 13F | Grimes & Company, Inc. | 53,775 | 7,794 | ||||||
| 2025-07-15 | 13F | Financial Management Professionals, Inc. | 0 | -100.00 | 0 | |||||
| 2025-08-13 | 13F | Fisher Asset Management, LLC | 51,469 | -21.61 | 7,459 | -9.96 |