Mga Batayang Estadistika
| Pemilik Institusional | 123 total, 117 long only, 1 short only, 5 long/short - change of -0.81% MRQ |
| Alokasi Portofolio Rata-rata | 0.3258 % - change of -13.65% MRQ |
| Saham Institusional (Jangka Panjang) | 274,935,796 (ex 13D/G) - change of 1.67MM shares 0.61% MRQ |
| Nilai Institusional (Jangka Panjang) | $ 563,981 USD ($1000) |
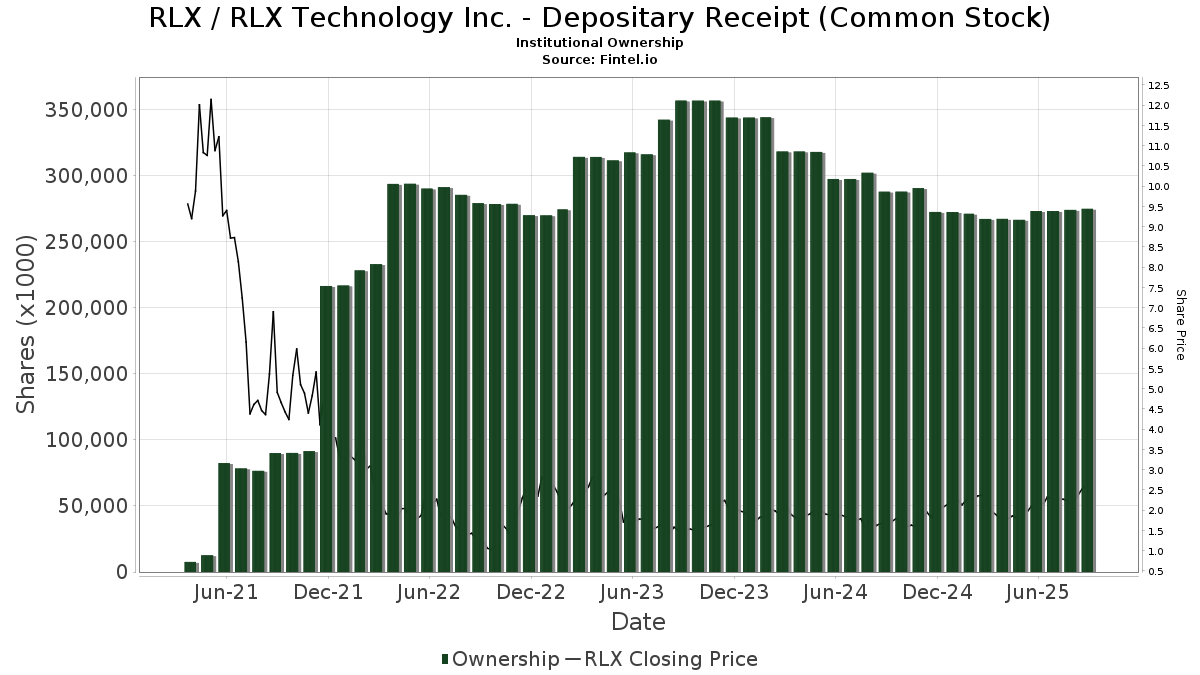
Kepemilikan Institusional dan Pemegang Saham
RLX Technology Inc. - Depositary Receipt (Common Stock) (US:RLX) memiliki 123 pemilik institusional dan pemegang saham yang telah mengajukan formulir 13D/G atau 13F kepada Komisi Bursa Efek (Securities Exchange Commission/SEC). Lembaga-lembaga ini memegang total 274,963,174 saham. Pemegang saham terbesar meliputi First Beijing Investment Ltd, IDG China Venture Capital Fund V Associates L.P., Vanguard Group Inc, Wildcat Capital Management, LLC, Aspex Management (HK) Ltd, Jane Street Group, Llc, VGTSX - Vanguard Total International Stock Index Fund Investor Shares, VEIEX - Vanguard Emerging Markets Stock Index Fund Investor Shares, BlackRock, Inc., and Goldman Sachs Group Inc .
Struktur kepemilikan institusional RLX Technology Inc. - Depositary Receipt (Common Stock) (NYSE:RLX) menunjukkan posisi terkini di perusahaan oleh institusi dan dana, serta perubahan terbaru dalam ukuran posisi. Pemegang saham utama dapat mencakup investor individu, reksa dana, dana lindung nilai, atau institusi. Jadwal 13D menunjukkan bahwa investor memegang (atau pernah memegang) lebih dari 5% saham perusahaan dan bermaksud (atau pernah bermaksud) untuk secara aktif mengejar perubahan strategi bisnis. Jadwal 13G menunjukkan investasi pasif lebih dari 5%.
The share price as of September 5, 2025 is 2.61 / share. Previously, on September 6, 2024, the share price was 1.69 / share. This represents an increase of 54.44% over that period.
Skor Sentimen Dana
Skor Sentimen Dana (sebelumnya dikenal sebagai Skor Akumulasi Kepemilikan) menemukan saham-saham yang paling banyak dibeli oleh dana. Ini adalah hasil dari model kuantitatif multi-faktor yang canggih yang mengidentifikasi perusahaan dengan tingkat akumulasi institusional tertinggi. Model penilaian menggunakan kombinasi dari total peningkatan pemilik yang diungkapkan, perubahan dalam alokasi portofolio pada pemilik tersebut, dan metrik lainnya. Angka berkisar dari 0 hingga 100, dengan angka yang lebih tinggi menunjukkan tingkat akumulasi yang lebih tinggi dibandingkan dengan perusahaan sejenisnya, dan 50 adalah rata-ratanya.
Frekuensi Pembaruan: Setiap Hari
Lihat Ownership Explorer, yang menyediakan daftar perusahaan dengan peringkat tertinggi.
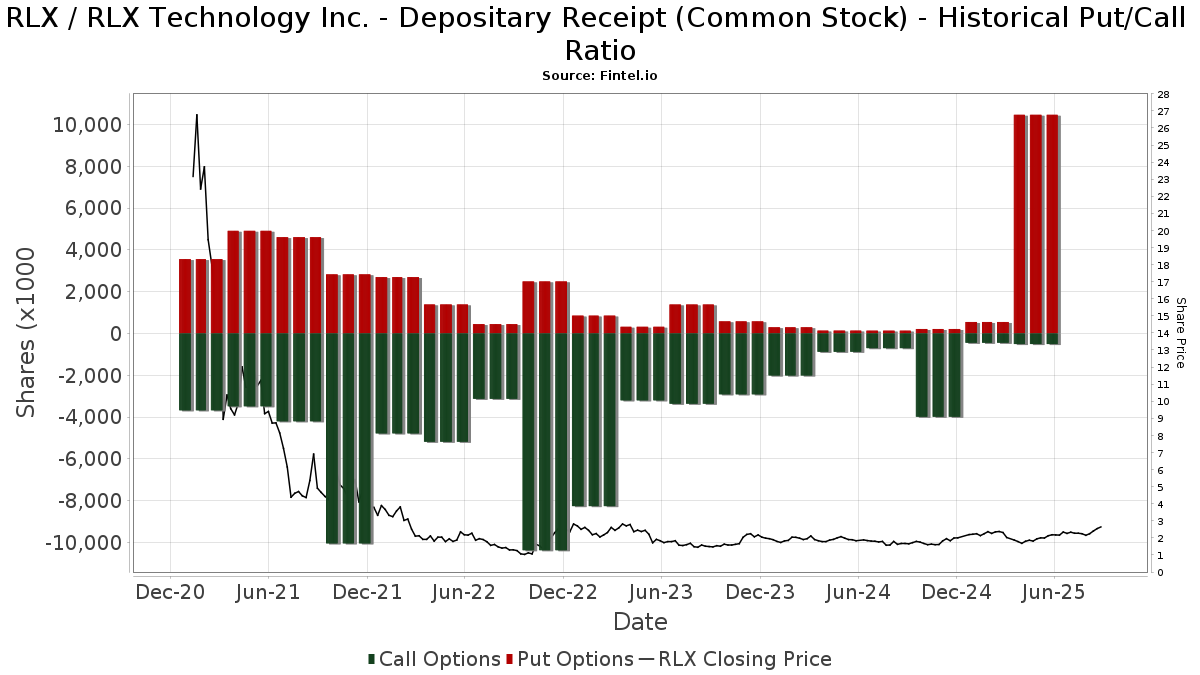
Rasio Put/Call Institusional
Selain melaporkan isu ekuitas dan utang standar, institusi dengan aset di bawah manajemen lebih dari 100 juta dolar AS juga harus mengungkapkan kepemilikan opsi put dan call mereka. Karena opsi put umumnya menunjukkan sentimen negatif, dan opsi call menunjukkan sentimen positif, kita dapat mengetahui sentimen institusional secara keseluruhan dengan memplot rasio put terhadap call. Grafik di sebelah kanan memplot rasio put/call historis untuk instrumen ini.
Menggunakan Rasio Put/Call sebagai indikator sentimen investor mengatasi salah satu kekurangan utama dari penggunaan total kepemilikan institusional, yaitu sejumlah besar aset yang dikelola diinvestasikan secara pasif untuk melacak indeks. Dana yang dikelola secara pasif biasanya tidak membeli opsi, sehingga indikator rasio put/call lebih akurat dalam melacak sentimen dana yang dikelola secara aktif.
Pengajuan 13F dan NPORT
Detail pada pengajuan 13F tersedia gratis. Detail pada pengajuan NP memerlukan keanggotaan premium. Baris berwarna hijau menunjukkan posisi baru. Baris berwarna merah menunjukkan posisi yang sudah ditutup. Klik tautan ini ikon untuk melihat riwayat transaksi selengkapnya.
Tingkatkan
untuk membuka data premium dan mengekspor ke Excel ![]() .
.
| Tanggal File | Sumber | Investor | Ketik | Presyo ng Avg (Silangan) |
Saham | Δ Saham (%) |
Dilaporkan Nilai ($1000) |
Nilai Δ (%) |
Alokasi Port (%) |
|
|---|---|---|---|---|---|---|---|---|---|---|
| 2025-08-13 | 13F | Invesco Ltd. | 555,756 | -5.84 | 1,228 | 10.73 | ||||
| 2025-06-27 | NP | PGJ - Invesco Golden Dragon China ETF This fund is a listed as child fund of Invesco Ltd. and if that institution has disclosed ownership in this security, then these positions will not be double counted when calculating total shares and total value | 586,875 | 9.88 | 1,092 | -7.93 | ||||
| 2025-08-27 | NP | TIFF INVESTMENT PROGRAM - TIFF Multi-Asset Fund | Short | -27,378 | 1.05 | -61 | 20.00 | |||
| 2025-08-05 | 13F | Simplex Trading, Llc | Put | 6,000 | -93.40 | 0 | ||||
| 2025-08-14 | 13F | Fmr Llc | 732 | -13.88 | 2 | 0.00 | ||||
| 2025-08-14 | 13F | Point72 Hong Kong Ltd | 0 | -100.00 | 0 | |||||
| 2025-05-15 | 13F | Bayesian Capital Management, LP | 0 | -100.00 | 0 | |||||
| 2025-08-26 | NP | AZBAX - AllianzGI Small-Cap Fund Class A | 43,796 | 97 | ||||||
| 2025-08-14 | 13F | Royal Bank Of Canada | 12,197 | 21.97 | 27 | 42.11 | ||||
| 2025-08-07 | 13F | Allworth Financial LP | 3,057 | 0.00 | 7 | 20.00 | ||||
| 2025-08-05 | 13F | Simplex Trading, Llc | 238,373 | 119.33 | 1 | |||||
| 2025-08-08 | 13F | Creative Planning | 72,419 | -6.17 | 160 | 10.34 | ||||
| 2025-05-15 | 13F | Caption Management, LLC | Call | 0 | -100.00 | 0 | -100.00 | |||
| 2025-08-05 | 13F | Simplex Trading, Llc | Call | 10,600 | -33.75 | 0 | ||||
| 2025-04-17 | 13F | Vista Wealth Management Group, LLC | 2,061,263 | 0.00 | 3,875 | -12.96 | ||||
| 2025-08-08 | 13F | Police & Firemen's Retirement System of New Jersey | 130,114 | 0.00 | 288 | 17.62 | ||||
| 2025-08-12 | 13F | XTX Topco Ltd | 333,267 | 242.08 | 737 | 302.19 | ||||
| 2025-08-14 | 13F | Jain Global LLC | 22,900 | 51 | ||||||
| 2025-08-14 | 13F | Susquehanna Fundamental Investments, Llc | 0 | -100.00 | 0 | |||||
| 2025-06-26 | NP | FTIHX - Fidelity Total International Index Fund This fund is a listed as child fund of Fmr Llc and if that institution has disclosed ownership in this security, then these positions will not be double counted when calculating total shares and total value | 176,446 | -9.73 | 328 | -24.25 | ||||
| 2025-08-13 | 13F | EverSource Wealth Advisors, LLC | 3,143 | 7 | ||||||
| 2025-08-14 | 13F | Point72 Asset Management, L.P. | 0 | -100.00 | 0 | |||||
| 2025-07-21 | 13F | Mirae Asset Global Investments Co., Ltd. | 22,087 | 7.29 | 49 | 23.08 | ||||
| 2025-04-23 | 13F | Continuum Advisory, LLC | 0 | -100.00 | 0 | |||||
| 2025-08-14 | 13F | Oasis Management Co Ltd. | 6,037,031 | 5.49 | 13,342 | 24.01 | ||||
| 2025-05-15 | 13F | Lazard Asset Management Llc | 0 | -100.00 | 0 | |||||
| 2025-07-25 | 13F | JustInvest LLC | 40,168 | 73.83 | 89 | 104.65 | ||||
| 2025-08-12 | 13F | Proequities, Inc. | Put | 0 | 0 | |||||
| 2025-05-14 | 13F | Walleye Trading LLC | Call | 0 | -100.00 | 0 | ||||
| 2025-08-12 | 13F | Proequities, Inc. | Call | 0 | 0 | |||||
| 2025-08-18 | 13F | Wolverine Trading, Llc | Call | 27,500 | -17.91 | 61 | -3.17 | |||
| 2025-05-15 | 13F | Boothbay Fund Management, Llc | 0 | -100.00 | 0 | |||||
| 2025-08-12 | 13F | Proequities, Inc. | 0 | 0 | ||||||
| 2025-08-14 | 13F | Point72 Asia (Singapore) Pte. Ltd. | 0 | -100.00 | 0 | |||||
| 2025-05-12 | 13F | Pinpoint Asset Management Ltd | 49,850 | -71.99 | 94 | -75.78 | ||||
| 2025-08-28 | NP | GXC - SPDR(R) S&P(R) CHINA ETF | 112,832 | -10.17 | 249 | 5.51 | ||||
| 2025-08-14 | 13F | Susquehanna International Group, Llp | Put | 48,300 | 20.45 | 107 | 41.33 | |||
| 2025-08-12 | 13F | IDG China Venture Capital Fund V Associates L.P. | 60,068,870 | 0.00 | 132,752 | 17.55 | ||||
| 2025-08-14 | 13F | Susquehanna International Group, Llp | 603,723 | 5,794.01 | 1,334 | 6,921.05 | ||||
| 2025-08-14 | 13F | Ubs Asset Management Americas Inc | 624,467 | -6.39 | 1,380 | 10.05 | ||||
| 2025-07-31 | 13F | Ground Swell Capital, LLC | 0 | -100.00 | 0 | -100.00 | ||||
| 2025-08-14 | 13F | Susquehanna International Group, Llp | Call | 81,600 | -59.32 | 180 | -52.25 | |||
| 2025-07-31 | 13F | Caitong International Asset Management Co., Ltd | 1,255 | 1,083.96 | 3 | |||||
| 2025-08-13 | 13F | Quadrant Capital Group Llc | 50,078 | -35.31 | 111 | -24.14 | ||||
| 2025-08-28 | NP | SPGM - SPDR(R) Portfolio MSCI Global Stock Market ETF | 37,407 | 2.96 | 83 | 20.59 | ||||
| 2025-08-12 | 13F | Clear Street Markets Llc | 19,288 | 156.49 | 43 | 200.00 | ||||
| 2025-08-28 | NP | QCSTRX - Stock Account Class R1 | 275,300 | -13.29 | 608 | 2.01 | ||||
| 2025-07-25 | 13F | Apollon Wealth Management, LLC | 13,000 | 0.00 | 29 | 16.67 | ||||
| 2025-04-15 | 13F | Ameliora Wealth Management Ltd. | 0 | -100.00 | 0 | |||||
| 2025-07-16 | 13F | Signaturefd, Llc | 58,136 | -6.61 | 128 | 9.40 | ||||
| 2025-07-14 | 13F | Ridgewood Investments LLC | 16,000 | 0.00 | 35 | 16.67 | ||||
| 2025-08-11 | 13F | Citigroup Inc | 5,870 | 13 | ||||||
| 2025-08-11 | 13F | Vanguard Group Inc | 27,035,683 | -3.22 | 59,749 | 13.77 | ||||
| 2025-08-01 | 13F | Y-Intercept (Hong Kong) Ltd | 44,757 | 99 | ||||||
| 2025-08-14 | 13F | Headlands Technologies LLC | 1,225 | -95.25 | 3 | -95.83 | ||||
| 2025-05-09 | 13F | Pnc Financial Services Group, Inc. | 0 | -100.00 | 0 | |||||
| 2025-08-14 | 13F | Optiver Holding B.V. | 1 | -100.00 | 0 | -100.00 | ||||
| 2025-07-25 | NP | ECNS - iShares MSCI China Small-Cap ETF | 155,216 | -6.19 | 320 | -22.38 | ||||
| 2025-08-15 | 13F | Tower Research Capital LLC (TRC) | 54,064 | 308.18 | 119 | 395.83 | ||||
| 2025-08-12 | 13F | Rhumbline Advisers | 9,185 | 0.00 | 20 | 17.65 | ||||
| 2025-08-28 | NP | SSGVX - State Street Global Equity ex-U.S. Index Portfolio State Street Global All Cap Equity ex-U.S. Index Portfolio This fund is a listed as child fund of State Street Corp and if that institution has disclosed ownership in this security, then these positions will not be double counted when calculating total shares and total value | 89,100 | -66.12 | 197 | -60.32 | ||||
| 2025-07-25 | NP | SCHE - Schwab Emerging Markets Equity ETF This fund is a listed as child fund of Charles Schwab Investment Management Inc and if that institution has disclosed ownership in this security, then these positions will not be double counted when calculating total shares and total value | 866,827 | 0.00 | 1,786 | -17.28 | ||||
| 2025-06-23 | NP | UGPIX - UltraChina ProFund Investor Class | 27,007 | -30.41 | 50 | -41.86 | ||||
| 2025-08-13 | 13F | Pictet Asset Management Holding SA | 198,067 | -24.07 | 438 | -10.82 | ||||
| 2025-08-14 | 13F | Barometer Capital Management Inc. | 0 | -100.00 | 0 | |||||
| 2025-08-13 | 13F | West Family Investments, Inc. | 41,577 | 0.00 | 92 | 16.67 | ||||
| 2025-08-13 | 13F | Russell Investments Group, Ltd. | 150,038 | 0.00 | 332 | 17.38 | ||||
| 2025-08-07 | 13F | Connor, Clark & Lunn Investment Management Ltd. | 1,603,605 | 15.30 | 3,544 | 35.54 | ||||
| 2025-08-26 | NP | FLAX - Franklin FTSE Asia ex Japan ETF | 2,466 | -11.80 | 5 | 0.00 | ||||
| 2025-08-14 | 13F | Cache Advisors, LLC | 71,777 | 0.00 | 159 | 17.91 | ||||
| 2025-08-15 | 13F | Morgan Stanley | 4,111,174 | -26.78 | 9,086 | -13.94 | ||||
| 2025-04-22 | NP | APIE - ActivePassive International Equity ETF | 0 | -100.00 | 0 | -100.00 | ||||
| 2025-05-15 | 13F | Parallax Volatility Advisers, L.P. | Call | 0 | -100.00 | 0 | ||||
| 2025-08-13 | 13F | Quadrature Capital Ltd | 88,297 | 229.00 | 195 | 290.00 | ||||
| 2025-08-14 | 13F | Orland Properties Ltd | 4,612,138 | -17.82 | 10,193 | -3.39 | ||||
| 2025-07-15 | 13F | Public Employees Retirement System Of Ohio | 323,016 | 9.22 | 714 | 28.24 | ||||
| 2025-08-14 | 13F | Aqr Capital Management Llc | 0 | -100.00 | 0 | |||||
| 2025-08-14 | 13F | Mariner, LLC | 21,770 | -15.45 | 48 | 0.00 | ||||
| 2025-08-14 | 13F | State Street Corp | 3,477,238 | -4.10 | 7,685 | 12.73 | ||||
| 2025-05-13 | 13F | Quantbot Technologies LP | 0 | -100.00 | 0 | -100.00 | ||||
| 2025-08-04 | 13F | Assetmark, Inc | 147 | 0 | ||||||
| 2025-07-29 | NP | RBB FUND, INC. - Aquarius International Fund | 23,295 | 0.00 | 48 | -18.97 | ||||
| 2025-07-11 | 13F | Assenagon Asset Management S.A. | 580,015 | 1,282 | ||||||
| 2025-08-07 | 13F | Profund Advisors Llc | 33,299 | -12.42 | 74 | 2.82 | ||||
| 2025-08-14 | 13F | Susquehanna Portfolio Strategies, LLC | 301,058 | 665 | ||||||
| 2025-06-30 | NP | VEU - Vanguard FTSE All-World ex-US Index Fund ETF Shares | 1,498,147 | 3.99 | 2,787 | -12.88 | ||||
| 2025-08-08 | 13F | Geode Capital Management, Llc | 183,824 | -5.65 | 406 | 10.93 | ||||
| 2025-08-14 | 13F | GWM Advisors LLC | 1,000 | 0.00 | 2 | 100.00 | ||||
| 2025-08-05 | 13F | NewSquare Capital LLC | 150 | 0 | ||||||
| 2025-08-14 | 13F | Polymer Capital Management (HK) LTD | 859,867 | 1,900 | ||||||
| 2025-07-25 | NP | EEMS - iShares MSCI Emerging Markets Small-Cap ETF | 91,509 | 3.51 | 189 | -14.55 | ||||
| 2025-08-14 | 13F | Colony Group, LLC | 1,946,802 | 4,302 | ||||||
| 2025-08-14 | 13F | Wetherby Asset Management Inc | 49,890 | -4.33 | 110 | -1.79 | ||||
| 2025-05-19 | 13F/A | Jane Street Group, Llc | Call | 0 | -100.00 | 0 | -100.00 | |||
| 2025-05-09 | 13F | GeoWealth Management, LLC | 0 | -100.00 | 0 | |||||
| 2025-07-24 | 13F | Us Bancorp \de\ | 13,823 | -48.13 | 31 | -40.00 | ||||
| 2025-08-13 | 13F | Northern Trust Corp | 679,951 | -7.04 | 1,503 | 9.24 | ||||
| 2025-08-15 | 13F | First Beijing Investment Ltd | 62,864,424 | 53.19 | 138,930 | 80.08 | ||||
| 2025-08-14 | 13F | Boston Private Wealth Llc | 0 | -100.00 | 0 | |||||
| 2025-07-15 | 13F | Ballentine Partners, LLC | 14,745 | 0.00 | 33 | 18.52 | ||||
| 2025-06-30 | NP | VT - Vanguard Total World Stock Index Fund ETF Shares | 467,145 | 0.00 | 869 | -16.30 | ||||
| 2025-08-07 | 13F | Hosking Partners LLP | 2,025,895 | -3.24 | 4,477 | 13.74 | ||||
| 2025-05-12 | 13F | Virtu Financial LLC | 0 | -100.00 | 0 | |||||
| 2025-08-08 | 13F | SG Americas Securities, LLC | 263,907 | -1.67 | 1 | |||||
| 2025-06-30 | NP | VGTSX - Vanguard Total International Stock Index Fund Investor Shares | 10,137,501 | -0.61 | 18,856 | -16.73 | ||||
| 2025-08-27 | 13F | Abn Amro Investment Solutions | 0 | -100.00 | 0 | -100.00 | ||||
| 2025-08-27 | 13F/A | Squarepoint Ops LLC | Call | 0 | -100.00 | 0 | -100.00 | |||
| 2025-08-13 | 13F | Pinpoint Asset Management (Singapore) Pte. Ltd. | 49,850 | 110 | ||||||
| 2025-08-14 | 13F | Bank Of America Corp /de/ | 1,131,096 | -43.21 | 2,500 | -33.25 | ||||
| 2025-07-28 | 13F | BRYN MAWR TRUST Co | 720 | 0.00 | 2 | 0.00 | ||||
| 2025-08-12 | 13F | MAI Capital Management | 9,379 | 21 | ||||||
| 2025-08-14 | 13F | Canada Pension Plan Investment Board | 3,804,284 | 53.72 | 8,407 | 80.72 | ||||
| 2025-08-14 | 13F | Two Sigma Investments, Lp | 0 | -100.00 | 0 | |||||
| 2025-05-14 | 13F | Smartleaf Asset Management LLC | 0 | -100.00 | 0 | |||||
| 2025-08-14 | 13F/A | Barclays Plc | 6,155,466 | -2.99 | 14 | 18.18 | ||||
| 2025-08-14 | 13F | Hrt Financial Lp | 32,084 | -56.44 | 0 | |||||
| 2025-08-14 | 13F | D. E. Shaw & Co., Inc. | 6,017,137 | 35.22 | 13,298 | 58.96 | ||||
| 2025-08-12 | 13F | Nuveen, LLC | 208,700 | -34.27 | 461 | -22.65 | ||||
| 2025-05-15 | 13F | Cubist Systematic Strategies, LLC | 0 | -100.00 | 0 | |||||
| 2025-08-13 | 13F | Hsbc Holdings Plc | 201,947 | 2.18 | 446 | 20.22 | ||||
| 2025-08-14 | 13F | Alliancebernstein L.p. | 128,240 | 0.00 | 283 | 17.43 | ||||
| 2025-07-18 | 13F | Wildcat Capital Management, LLC | 18,046,195 | 0.00 | 39,882 | 17.56 | ||||
| 2025-05-05 | 13F | Lindbrook Capital, Llc | 3,149 | -18.82 | 6 | -37.50 | ||||
| 2025-05-12 | 13F | FIL Ltd | 0 | -100.00 | 0 | |||||
| 2025-07-08 | 13F | Parallel Advisors, LLC | 17,193 | -15.18 | 38 | -2.63 | ||||
| 2025-08-14 | 13F | Group One Trading, L.p. | 4,276 | 9 | ||||||
| 2025-07-22 | 13F | Gsa Capital Partners Llp | 181,488 | 0 | ||||||
| 2025-08-14 | 13F | Group One Trading, L.p. | Put | 142,300 | -10.39 | 314 | 5.37 | |||
| 2025-08-14 | 13F | Goldman Sachs Group Inc | 8,479,968 | 0.83 | 18,741 | 18.53 | ||||
| 2025-08-14 | 13F | Group One Trading, L.p. | Call | 365,600 | 127.36 | 808 | 167.22 | |||
| 2025-06-26 | NP | IXUS - iShares Core MSCI Total International Stock ETF | 729,181 | 0.83 | 1,356 | -15.51 | ||||
| 2025-08-08 | 13F | SBI Securities Co., Ltd. | 4,786 | -0.27 | 11 | 11.11 | ||||
| 2025-08-13 | 13F | Wealthquest Corp | 0 | -100.00 | 0 | -100.00 | ||||
| 2025-08-13 | 13F | Aspex Management (HK) Ltd | 12,123,409 | 0.00 | 27 | 18.18 | ||||
| 2025-08-14 | 13F | Two Sigma Advisers, Lp | 18,100 | -51.34 | 40 | -42.03 | ||||
| 2025-08-14 | 13F | Jane Street Group, Llc | 4,286,183 | 186.92 | 9,472 | 237.32 | ||||
| 2025-07-23 | 13F | Shell Asset Management Co | 28,411 | 0.00 | 0 | |||||
| 2025-08-12 | 13F | BlackRock, Inc. | 8,893,303 | -5.86 | 19,654 | 10.66 | ||||
| 2025-08-26 | NP | FLCH - Franklin FTSE China ETF | 46,736 | 1.23 | 103 | 19.77 | ||||
| 2025-04-21 | 13F | Catalina Capital Group, LLC | 0 | -100.00 | 0 | |||||
| 2025-08-27 | 13F/A | Squarepoint Ops LLC | Put | 0 | -100.00 | 0 | -100.00 | |||
| 2025-08-14 | 13F | Citadel Advisors Llc | Put | 49,000 | 2.73 | 108 | 21.35 | |||
| 2025-08-14 | 13F | Perseverance Asset Management International | 6,643,226 | -24.04 | 14,682 | -10.71 | ||||
| 2025-08-14 | 13F | Citadel Advisors Llc | 2,359,964 | -12.44 | 5,216 | 2.94 | ||||
| 2025-08-14 | 13F | Man Group plc | 0 | -100.00 | 0 | |||||
| 2025-08-14 | 13F | Citadel Advisors Llc | Call | 20,800 | -42.22 | 46 | -32.84 | |||
| 2025-06-24 | NP | TLTE - FlexShares Morningstar Emerging Markets Factor Tilt Index Fund | 14,168 | 684.06 | 26 | 550.00 | ||||
| 2025-06-30 | NP | VEIEX - Vanguard Emerging Markets Stock Index Fund Investor Shares | 9,134,015 | 0.77 | 16,989 | -15.57 | ||||
| 2025-08-28 | NP | SPEM - SPDR(R) Portfolio Emerging Markets ETF | 1,054,403 | 9.52 | 2,330 | 28.80 | ||||
| 2025-08-12 | 13F | Charles Schwab Investment Management Inc | 866,827 | 0.00 | 1,916 | 17.56 | ||||
| 2025-07-17 | 13F | Janney Montgomery Scott LLC | 10,000 | 0.00 | 0 | |||||
| 2025-07-24 | 13F | Ronald Blue Trust, Inc. | 122 | 0.00 | 0 | |||||
| 2025-08-12 | 13F | Legal & General Group Plc | 761,154 | -1.90 | 1,684 | 15.27 | ||||
| 2025-08-14 | 13F | Jane Street Group, Llc | Put | 10,216,500 | 4,687.49 | 22,578 | 5,530.42 | |||
| 2025-08-13 | 13F | Renaissance Technologies Llc | 886,100 | -0.02 | 1,958 | 17.53 | ||||
| 2025-08-14 | 13F | Engineers Gate Manager LP | 0 | -100.00 | 0 | |||||
| 2025-08-14 | 13F | Vident Advisory, LLC | 53,831 | -5.44 | 119 | 10.28 | ||||
| 2025-08-14 | 13F | LMR Partners LLP | 29,358 | 0.00 | 65 | 16.36 | ||||
| 2025-08-14 | 13F | Point72 (DIFC) Ltd | 0 | -100.00 | 0 | |||||
| 2025-08-13 | 13F | BRIGHT VALLEY CAPITAL Ltd | 0 | -100.00 | 0 | |||||
| 2025-08-14 | 13F | Millennium Management Llc | 894,411 | -70.00 | 1,977 | -64.74 | ||||
| 2025-08-18 | 13F/A | Nomura Holdings Inc | 2,590,622 | -53.37 | 5,725 | -45.18 | ||||
| 2025-08-27 | 13F/A | Squarepoint Ops LLC | 112,078 | -45.05 | 248 | -35.51 | ||||
| 2025-08-13 | 13F | Marshall Wace, Llp | 1,133,093 | 29.35 | 2,504 | 52.13 | ||||
| 2025-08-14 | 13F | UBS Group AG | 526,467 | -57.09 | 1,163 | -49.57 | ||||
| 2025-07-25 | NP | IEMG - iShares Core MSCI Emerging Markets ETF | 3,663,205 | 1.30 | 7,546 | -16.19 | ||||
| 2025-08-12 | 13F | Franklin Resources Inc | 472,256 | -4.06 | 1,044 | 12.76 | ||||
| 2025-08-12 | 13F | Jpmorgan Chase & Co | 7,225 | -99.73 | 16 | -99.70 | ||||
| 2025-08-07 | 13F | Sierra Ocean, Llc | 534 | 0.00 | 1 | 0.00 | ||||
| 2025-08-28 | NP | GMF - SPDR(R) S&P(R) EMERGING ASIA PACIFIC ETF | 37,602 | -6.51 | 83 | 10.67 |
Other Listings
| DE:3CM | € 2.20 |