Mga Batayang Estadistika
| Pemilik Institusional | 213 total, 213 long only, 0 short only, 0 long/short - change of -0.93% MRQ |
| Alokasi Portofolio Rata-rata | 0.0969 % - change of -28.48% MRQ |
| Saham Institusional (Jangka Panjang) | 5,208,541 (ex 13D/G) - change of -1.53MM shares -22.67% MRQ |
| Nilai Institusional (Jangka Panjang) | $ 296,887 USD ($1000) |
Kepemilikan Institusional dan Pemegang Saham
Exchange Traded Concepts Trust - ROBO Global Robotics and Automation Index ETF (US:ROBO) memiliki 213 pemilik institusional dan pemegang saham yang telah mengajukan formulir 13D/G atau 13F kepada Komisi Bursa Efek (Securities Exchange Commission/SEC). Lembaga-lembaga ini memegang total 5,208,541 saham. Pemegang saham terbesar meliputi UBS Group AG, Morgan Stanley, LPL Financial LLC, Fountainhead AM, LLC, Gray Foundation, Raymond James Financial Inc, Biltmore Family Office, LLC, CI Private Wealth, LLC, Royal Bank Of Canada, and Ameriprise Financial Inc .
Struktur kepemilikan institusional Exchange Traded Concepts Trust - ROBO Global Robotics and Automation Index ETF (ARCA:ROBO) menunjukkan posisi terkini di perusahaan oleh institusi dan dana, serta perubahan terbaru dalam ukuran posisi. Pemegang saham utama dapat mencakup investor individu, reksa dana, dana lindung nilai, atau institusi. Jadwal 13D menunjukkan bahwa investor memegang (atau pernah memegang) lebih dari 5% saham perusahaan dan bermaksud (atau pernah bermaksud) untuk secara aktif mengejar perubahan strategi bisnis. Jadwal 13G menunjukkan investasi pasif lebih dari 5%.
The share price as of September 5, 2025 is 63.97 / share. Previously, on September 6, 2024, the share price was 51.69 / share. This represents an increase of 23.76% over that period.

Skor Sentimen Dana
Skor Sentimen Dana (sebelumnya dikenal sebagai Skor Akumulasi Kepemilikan) menemukan saham-saham yang paling banyak dibeli oleh dana. Ini adalah hasil dari model kuantitatif multi-faktor yang canggih yang mengidentifikasi perusahaan dengan tingkat akumulasi institusional tertinggi. Model penilaian menggunakan kombinasi dari total peningkatan pemilik yang diungkapkan, perubahan dalam alokasi portofolio pada pemilik tersebut, dan metrik lainnya. Angka berkisar dari 0 hingga 100, dengan angka yang lebih tinggi menunjukkan tingkat akumulasi yang lebih tinggi dibandingkan dengan perusahaan sejenisnya, dan 50 adalah rata-ratanya.
Frekuensi Pembaruan: Setiap Hari
Lihat Ownership Explorer, yang menyediakan daftar perusahaan dengan peringkat tertinggi.
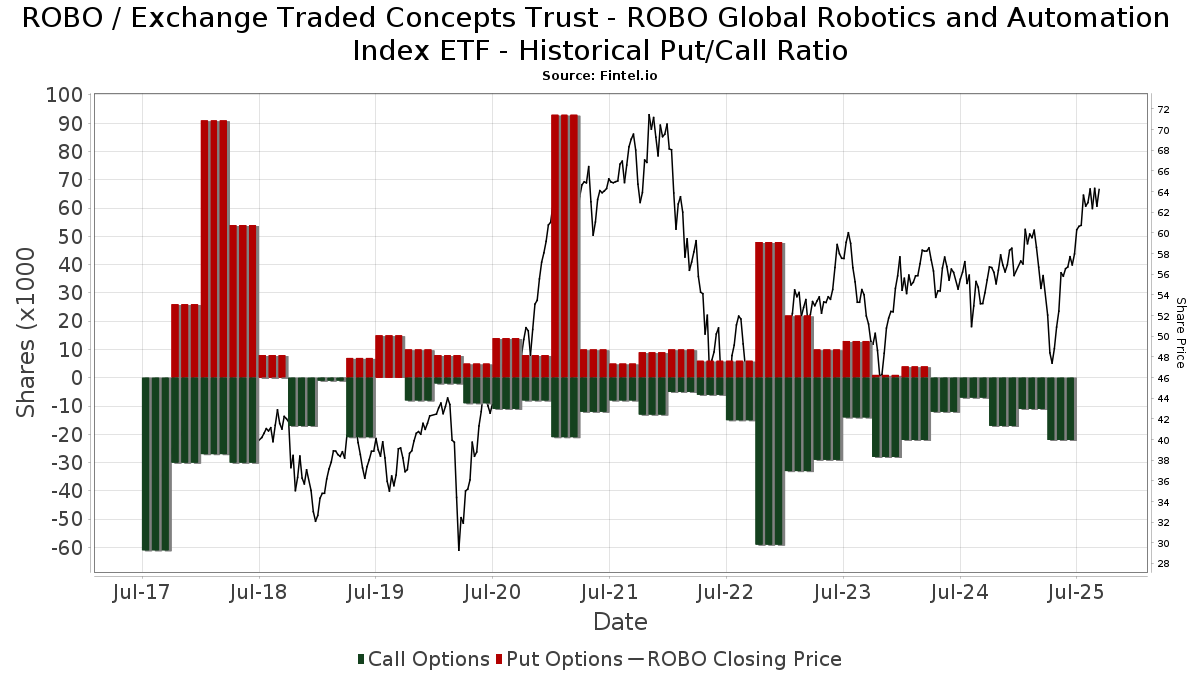
Rasio Put/Call Institusional
Selain melaporkan isu ekuitas dan utang standar, institusi dengan aset di bawah manajemen lebih dari 100 juta dolar AS juga harus mengungkapkan kepemilikan opsi put dan call mereka. Karena opsi put umumnya menunjukkan sentimen negatif, dan opsi call menunjukkan sentimen positif, kita dapat mengetahui sentimen institusional secara keseluruhan dengan memplot rasio put terhadap call. Grafik di sebelah kanan memplot rasio put/call historis untuk instrumen ini.
Menggunakan Rasio Put/Call sebagai indikator sentimen investor mengatasi salah satu kekurangan utama dari penggunaan total kepemilikan institusional, yaitu sejumlah besar aset yang dikelola diinvestasikan secara pasif untuk melacak indeks. Dana yang dikelola secara pasif biasanya tidak membeli opsi, sehingga indikator rasio put/call lebih akurat dalam melacak sentimen dana yang dikelola secara aktif.
Pengajuan 13F dan NPORT
Detail pada pengajuan 13F tersedia gratis. Detail pada pengajuan NP memerlukan keanggotaan premium. Baris berwarna hijau menunjukkan posisi baru. Baris berwarna merah menunjukkan posisi yang sudah ditutup. Klik tautan ini ikon untuk melihat riwayat transaksi selengkapnya.
Tingkatkan
untuk membuka data premium dan mengekspor ke Excel ![]() .
.
| Tanggal File | Sumber | Investor | Ketik | Presyo ng Avg (Silangan) |
Saham | Δ Saham (%) |
Dilaporkan Nilai ($1000) |
Nilai Δ (%) |
Alokasi Port (%) |
|
|---|---|---|---|---|---|---|---|---|---|---|
| 2025-08-12 | 13F | Kimelman & Baird, LLC | 401 | 0.00 | 24 | 15.00 | ||||
| 2025-08-14 | 13F | Jane Street Group, Llc | 45,652 | 250.87 | 2,729 | 307.31 | ||||
| 2025-04-23 | 13F | Spirepoint Private Client, Llc | 0 | -100.00 | 0 | |||||
| 2025-05-09 | 13F | Sfmg, Llc | 0 | -100.00 | 0 | |||||
| 2025-08-14 | 13F | First Foundation Advisors | 5,211 | 0.00 | 312 | 16.04 | ||||
| 2025-08-04 | 13F | Creative Financial Designs Inc /adv | 5 | 0.00 | 0 | |||||
| 2025-04-15 | 13F | Noble Wealth Management PBC | 680 | 106.06 | 35 | 94.44 | ||||
| 2025-08-14 | 13F | Wells Fargo & Company/mn | 5,133 | -14.68 | 307 | -0.97 | ||||
| 2025-08-05 | 13F | Crestwood Advisors Group LLC | 59,037 | -4.40 | 3,529 | 10.97 | ||||
| 2025-05-05 | 13F | Migdal Insurance & Financial Holdings Ltd. | 0 | -100.00 | 0 | |||||
| 2025-08-14 | 13F | Stifel Financial Corp | 29,691 | 17.58 | 1,775 | 36.46 | ||||
| 2025-08-12 | 13F | Park Square Financial Group, LLC | 270 | -15.36 | 16 | 0.00 | ||||
| 2025-08-13 | 13F | Cresset Asset Management, LLC | 4,382 | 5.18 | 262 | 22.43 | ||||
| 2025-08-11 | 13F | Western Wealth Management, LLC | 3,363 | 201 | ||||||
| 2025-04-01 | 13F | Modus Advisors, LLC | 0 | -100.00 | 0 | |||||
| 2025-08-08 | 13F | Pnc Financial Services Group, Inc. | 2,500 | -26.32 | 149 | -14.37 | ||||
| 2025-08-14 | 13F | Royal Bank Of Canada | 155,563 | 0.23 | 9,299 | 16.34 | ||||
| 2025-07-14 | 13F | CHICAGO TRUST Co NA | 5,300 | 0.00 | 317 | 16.18 | ||||
| 2025-08-14 | 13F | Raymond James Financial Inc | 203,455 | -3.25 | 12,163 | 12.31 | ||||
| 2025-07-21 | 13F | Ntv Asset Management Llc | 89,160 | -1.92 | 5,330 | 13.84 | ||||
| 2025-07-31 | 13F/A | Avion Wealth | 169 | 0 | ||||||
| 2025-08-26 | 13F/A | Thrivent Financial For Lutherans | 0 | -100.00 | 0 | |||||
| 2025-08-18 | 13F | Geneos Wealth Management Inc. | 21,225 | 0.00 | 1,269 | 16.01 | ||||
| 2025-08-12 | 13F | Steward Partners Investment Advisory, Llc | 2,628 | 0.00 | 157 | 16.30 | ||||
| 2025-08-08 | 13F | SBI Securities Co., Ltd. | 776 | 4.86 | 46 | 21.05 | ||||
| 2025-05-07 | 13F | Hallmark Capital Management Inc | 0 | -100.00 | 0 | -100.00 | ||||
| 2025-07-16 | 13F | Brown, Lisle/cummings, Inc. | 117 | 0.00 | 7 | 0.00 | ||||
| 2025-08-14 | 13F | Bnp Paribas Arbitrage, Sa | 0 | -100.00 | 0 | |||||
| 2025-08-11 | 13F | Synergy Investment Management, LLC | 0 | -100.00 | 0 | |||||
| 2025-07-08 | 13F | Quintet Private Bank (Europe) S.A. | 600 | 0.00 | 36 | 16.67 | ||||
| 2025-08-12 | 13F | Aspiring Ventures, LLC | 7,500 | 0.00 | 448 | 13.99 | ||||
| 2025-07-23 | 13F | Joel Isaacson & Co., LLC | 9,401 | 0.00 | 562 | 15.91 | ||||
| 2025-07-30 | 13F | Evermay Wealth Management Llc | 1,010 | 0.00 | 60 | 15.38 | ||||
| 2025-07-31 | 13F | Oppenheimer & Co Inc | 10,556 | 3.48 | 631 | 20.19 | ||||
| 2025-07-25 | 13F | Atria Wealth Solutions, Inc. | 0 | -100.00 | 0 | |||||
| 2025-07-31 | 13F | Cambridge Investment Research Advisors, Inc. | 49,990 | -34.13 | 3 | -33.33 | ||||
| 2025-05-12 | 13F | Sandy Spring Bank | 123 | 0.00 | 6 | 0.00 | ||||
| 2025-08-13 | 13F | Kilter Group LLC | 76 | 5 | ||||||
| 2025-08-14 | 13F | UBS Group AG | 727,984 | -12.96 | 43,519 | 1.04 | ||||
| 2025-08-14 | 13F | Citadel Advisors Llc | Call | 4,500 | -31.82 | 269 | -20.65 | |||
| 2025-08-14 | 13F | Citadel Advisors Llc | 29,627 | -25.58 | 1,771 | -13.61 | ||||
| 2025-07-17 | 13F | Wolff Wiese Magana Llc | 125 | 0.00 | 7 | 16.67 | ||||
| 2025-07-14 | 13F | Toth Financial Advisory Corp | 360 | 0.00 | 22 | 16.67 | ||||
| 2025-07-28 | 13F | Mutual Advisors, LLC | 13,350 | 146.04 | 847 | 208.76 | ||||
| 2025-08-08 | 13F | Cetera Investment Advisers | 53,412 | -9.47 | 3,193 | 5.07 | ||||
| 2025-08-14 | 13F | Old Mission Capital Llc | 42,128 | 424.63 | 2,518 | 509.69 | ||||
| 2025-08-07 | 13F | Winch Advisory Services, LLC | 3,438 | 0.00 | 206 | 15.82 | ||||
| 2025-07-14 | 13F | AdvisorNet Financial, Inc | 780 | -66.82 | 47 | -61.98 | ||||
| 2025-07-17 | 13F | Nelson, Van Denburg & Campbell Wealth Management Group, LLC | 0 | -100.00 | 0 | |||||
| 2025-08-05 | 13F | Bank of New York Mellon Corp | 13,038 | -0.03 | 779 | 16.10 | ||||
| 2025-08-14 | 13F | Fmr Llc | 7,267 | -8.04 | 434 | 6.90 | ||||
| 2025-08-14 | 13F | McIlrath & Eck, LLC | 960 | 0.00 | 57 | 16.33 | ||||
| 2025-08-13 | 13F | Financial Freedom, LLC | 6,996 | -0.01 | 418 | 16.11 | ||||
| 2025-07-25 | 13F | Johnson Investment Counsel Inc | 4,596 | 0.00 | 275 | 16.10 | ||||
| 2025-07-21 | 13F | Matauro, Llc | 4,110 | 0.00 | 246 | 16.11 | ||||
| 2025-07-29 | 13F | Koshinski Asset Management, Inc. | 4,290 | 256 | ||||||
| 2025-07-30 | 13F | St. Johns Investment Management Company, LLC | 0 | -100.00 | 0 | |||||
| 2025-08-07 | 13F | Allworth Financial LP | 649 | 56.39 | 39 | 90.00 | ||||
| 2025-07-23 | 13F | Objectivity Squared, LLC | 9,674 | 0.00 | 578 | 25.93 | ||||
| 2025-08-08 | 13F | Glassman Wealth Services | 30 | 0.00 | 2 | 0.00 | ||||
| 2025-07-08 | 13F | Zrc Wealth Management, Llc | 0 | -100.00 | 0 | |||||
| 2025-09-04 | 13F/A | Advisor Group Holdings, Inc. | 46,922 | -20.70 | 2,806 | -7.94 | ||||
| 2025-07-25 | 13F | Cwm, Llc | 3,609 | 0.00 | 0 | |||||
| 2025-04-24 | 13F | Wingate Wealth Advisors, Inc. | 0 | -100.00 | 0 | |||||
| 2025-08-14 | 13F | CIBC World Markets Inc. | 8,628 | 516 | ||||||
| 2025-04-17 | 13F | Dynamic Advisor Solutions LLC | 0 | -100.00 | 0 | |||||
| 2025-08-13 | 13F | Scotia Capital Inc. | 9,909 | 5.71 | 592 | 22.82 | ||||
| 2025-05-14 | 13F | TD Capital Management LLC | 0 | -100.00 | 0 | |||||
| 2025-07-22 | 13F | Comprehensive Financial Consultants Institutional, Inc. | 4,506 | 0.00 | 269 | 15.95 | ||||
| 2025-08-12 | 13F | CIBC Private Wealth Group, LLC | 247 | 0.00 | 15 | 40.00 | ||||
| 2025-07-16 | 13F | PFS Partners, LLC | 600 | 0.00 | 36 | 16.67 | ||||
| 2025-07-22 | 13F | SOL Capital Management CO | 9,610 | -0.52 | 1 | |||||
| 2025-08-07 | 13F | Cahill Financial Advisors Inc | 5,078 | 0.00 | 304 | 16.09 | ||||
| 2025-07-24 | 13F | Ronald Blue Trust, Inc. | 2,988 | 0.00 | 179 | 16.34 | ||||
| 2025-08-14 | 13F | Peapack Gladstone Financial Corp | 5,600 | 1.82 | 0 | |||||
| 2025-08-14 | 13F | Susquehanna International Group, Llp | 0 | -100.00 | 0 | |||||
| 2025-08-14 | 13F | Hancock Prospecting Pty Ltd | 21,793 | 0.00 | 1,303 | 16.04 | ||||
| 2025-08-04 | 13F | Gray Foundation | 205,000 | 0.00 | 12,255 | 16.07 | ||||
| 2025-08-07 | 13F | Summit Asset Management, LLC | 3,900 | 0.00 | 233 | 16.50 | ||||
| 2025-07-22 | 13F | Powell Investment Advisors, LLC | 251 | 15 | ||||||
| 2025-08-12 | 13F | Financial Advocates Investment Management | 3,636 | -15.17 | 217 | -1.36 | ||||
| 2025-05-12 | 13F | Independent Advisor Alliance | 0 | -100.00 | 0 | |||||
| 2025-08-12 | 13F | Coldstream Capital Management Inc | 0 | -100.00 | 0 | |||||
| 2025-05-15 | 13F | CAPROCK Group, Inc. | 11,586 | -1.81 | 597 | -10.11 | ||||
| 2025-08-14 | 13F | Group One Trading, L.p. | 163 | 0.00 | 10 | 12.50 | ||||
| 2025-07-15 | 13F | Main Street Group, LTD | 2 | 0.00 | 0 | |||||
| 2025-07-23 | 13F | Vontobel Holding Ltd. | 6,485 | 0.00 | 388 | 16.22 | ||||
| 2025-07-10 | 13F | Wedmont Private Capital | 6,400 | 0.00 | 388 | 27.30 | ||||
| 2025-07-25 | 13F | M3 Advisory Group, LLC | 3,552 | 212 | ||||||
| 2025-08-13 | 13F | Vermillion & White Wealth Management Group, LLC | 34 | 0.00 | 2 | 100.00 | ||||
| 2025-07-31 | 13F | Washington Trust Advisors, Inc. | 136 | 0.00 | 8 | 14.29 | ||||
| 2025-08-12 | 13F | Manchester Capital Management LLC | 2,600 | 0.00 | 155 | 16.54 | ||||
| 2025-08-12 | 13F | Mustico Financial Group, Inc. | 5,437 | 340 | ||||||
| 2025-07-08 | 13F | Nbc Securities, Inc. | 37 | 0.00 | 0 | |||||
| 2025-07-18 | 13F | Bartlett & Co. Wealth Management Llc | 800 | 0.00 | 48 | 14.63 | ||||
| 2025-07-29 | 13F | Stratos Wealth Partners, LTD. | 59,002 | -3.34 | 3,527 | 12.22 | ||||
| 2025-08-13 | 13F | Capital Analysts, Inc. | 200 | 0.00 | 0 | |||||
| 2025-08-12 | 13F | Coston, McIsaac & Partners | 5 | 0 | ||||||
| 2025-07-24 | 13F | IFP Advisors, Inc | 336 | -64.10 | 20 | -58.33 | ||||
| 2025-05-15 | 13F | Tower Research Capital LLC (TRC) | 0 | -100.00 | 0 | |||||
| 2025-05-29 | 13F/A | Nova Wealth Management, Inc. | 50 | -45.65 | 3 | -60.00 | ||||
| 2025-08-12 | 13F | RPG Investment Advisory, LLC | 23,764 | -51.14 | 1,421 | -43.29 | ||||
| 2025-08-13 | 13F | Summit Financial, LLC | 30,577 | 1,828 | ||||||
| 2025-08-05 | 13F | Simplex Trading, Llc | 0 | -100.00 | 0 | |||||
| 2025-08-13 | 13F | Cerity Partners LLC | 4,961 | 0.00 | 297 | 16.08 | ||||
| 2025-07-28 | 13F | Smart Portfolios, LLC | 3,680 | 220 | ||||||
| 2025-08-12 | 13F | Clearwater Capital Advisors, LLC | 3,818 | 228 | ||||||
| 2025-07-17 | 13F | Clay Northam Wealth Management, LLC | 14,388 | -4.32 | 860 | 11.11 | ||||
| 2025-08-08 | 13F | Hartland & Co., LLC | 622 | 1,843.75 | 37 | 3,600.00 | ||||
| 2025-08-14 | 13F | Great Valley Advisor Group, Inc. | 3,389 | -19.54 | 203 | -6.48 | ||||
| 2025-08-14 | 13F | Camden Capital, LLC | 9,302 | 0.00 | 556 | 16.08 | ||||
| 2025-07-18 | 13F | Vigilare Wealth Management | 3,667 | 219 | ||||||
| 2025-08-14 | 13F | CoreCap Advisors, LLC | 60 | 0.00 | 4 | 0.00 | ||||
| 2025-07-30 | 13F | Pacific Sun Financial Corp | 38,095 | -1.04 | 2,277 | 14.88 | ||||
| 2025-08-11 | 13F | Blue Bell Private Wealth Management, Llc | 15 | 0.00 | 1 | |||||
| 2025-08-04 | 13F | Creekmur Asset Management LLC | 1,456 | -5.64 | 87 | 10.13 | ||||
| 2025-08-14 | 13F/A | Barclays Plc | 3,500 | -24.11 | 0 | |||||
| 2025-07-21 | 13F | Crews Bank & Trust | 100 | 0.00 | 6 | 0.00 | ||||
| 2025-07-18 | 13F | Truist Financial Corp | 6,329 | 60.35 | 378 | 86.21 | ||||
| 2025-04-16 | 13F | New Century Financial Group, LLC | 0 | -100.00 | 0 | |||||
| 2025-08-13 | 13F | Flow Traders U.s. Llc | 34,674 | -66.47 | 2 | -60.00 | ||||
| 2025-08-08 | 13F | WASHINGTON TRUST Co | 0 | -100.00 | 0 | |||||
| 2025-08-08 | 13F | Gts Securities Llc | 4,883 | 292 | ||||||
| 2025-08-14 | 13F | Bank Of America Corp /de/ | 8,052 | 4.99 | 481 | 22.08 | ||||
| 2025-08-13 | 13F | Wealthquest Corp | 0 | -100.00 | 0 | -100.00 | ||||
| 2025-07-28 | 13F | Harbour Investments, Inc. | 2,945 | -32.76 | 176 | -21.78 | ||||
| 2025-08-14 | 13F | Millennium Management Llc | 17,711 | 38.87 | 1,059 | 61.28 | ||||
| 2025-08-14 | 13F/A | Rockefeller Capital Management L.P. | 14,574 | 6.47 | 871 | 23.72 | ||||
| 2025-07-24 | 13F | Blair William & Co/il | 3,574 | -39.40 | 214 | -29.70 | ||||
| 2025-07-21 | 13F | Hilltop National Bank | 0 | -100.00 | 0 | |||||
| 2025-04-28 | 13F | Mainstream Capital Management LLC | 0 | -100.00 | 0 | |||||
| 2025-08-14 | 13F | Mercer Global Advisors Inc /adv | 81,857 | -1.22 | 4,893 | 14.67 | ||||
| 2025-08-04 | 13F | Spire Wealth Management | 9,277 | -2.66 | 555 | 13.06 | ||||
| 2025-08-19 | 13F | Newbridge Financial Services Group, Inc. | 151 | 0.00 | 9 | 28.57 | ||||
| 2025-07-22 | 13F | Valley National Advisers Inc | 210 | 0.00 | 0 | |||||
| 2025-08-07 | 13F | LFA - Lugano Financial Advisors SA | 0 | -100.00 | 0 | |||||
| 2025-04-25 | 13F | New Wave Wealth Advisors Llc | 0 | -100.00 | 0 | |||||
| 2025-07-15 | 13F | Cranbrook Wealth Management, LLC | 323 | 0.00 | 19 | 18.75 | ||||
| 2025-07-22 | 13F | Cedar Mountain Advisors, LLC | 211 | 0.00 | 13 | 20.00 | ||||
| 2025-08-14 | 13F | Banque Transatlantique SA | 1,576 | -38.87 | 93 | -23.77 | ||||
| 2025-07-10 | 13F | Tompkins Financial Corp | 0 | -100.00 | 0 | |||||
| 2025-08-04 | 13F | Assetmark, Inc | 74 | 4 | ||||||
| 2025-07-16 | 13F | TOWER TRUST & INVESTMENT Co | 325 | 0.00 | 19 | 18.75 | ||||
| 2025-07-31 | 13F | Ssa Swiss Advisors Ag | 1,500 | -53.56 | 95 | -42.77 | ||||
| 2025-07-24 | 13F | Costello Asset Management, INC | 325 | 0.00 | 19 | 18.75 | ||||
| 2025-07-15 | 13F | James J. Burns & Company, LLC | 9,478 | -10.35 | 567 | 4.04 | ||||
| 2025-07-29 | 13F | Primoris Wealth Advisors, Llc | 0 | -100.00 | 0 | |||||
| 2025-08-01 | 13F | Solstein Capital, LLC | 1,175 | 0.00 | 70 | 16.67 | ||||
| 2025-08-13 | 13F | Russell Investments Group, Ltd. | 96 | 0.00 | 6 | 25.00 | ||||
| 2025-08-07 | 13F | LOM Asset Management Ltd | 550 | 0 | ||||||
| 2025-07-25 | 13F | SPC Financial, Inc. | 15,274 | -1.99 | 913 | 13.84 | ||||
| 2025-08-13 | 13F | Continuum Advisory, LLC | 0 | -100.00 | 0 | |||||
| 2025-07-28 | 13F | BRYN MAWR TRUST Co | 3,406 | 0.00 | 204 | 16.00 | ||||
| 2025-08-14 | 13F | Colony Group, LLC | 36,687 | -0.56 | 2,193 | 15.42 | ||||
| 2025-08-08 | 13F | Larson Financial Group LLC | 300 | 0.00 | 18 | 13.33 | ||||
| 2025-07-09 | 13F | Bank of New Hampshire | 305 | -10.29 | 18 | 5.88 | ||||
| 2025-07-23 | 13F | Prime Capital Investment Advisors, LLC | 0 | -100.00 | 0 | |||||
| 2025-08-05 | 13F | Westside Investment Management, Inc. | 100 | 0.00 | 6 | 0.00 | ||||
| 2025-08-12 | 13F | Atlas Capital Advisors Llc | 0 | -100.00 | 0 | |||||
| 2025-07-18 | 13F | Union Bancaire Privee, UBP SA | 0 | -100.00 | 0 | |||||
| 2025-08-11 | 13F | Strategic Wealth Partners, Ltd. | 600 | 36 | ||||||
| 2025-08-15 | 13F | Equitable Holdings, Inc. | 13,223 | 4.52 | 790 | 21.35 | ||||
| 2025-07-24 | 13F | Us Bancorp \de\ | 1,514 | -35.24 | 91 | -25.00 | ||||
| 2025-08-11 | 13F | Advisor Resource Council | 0 | -100.00 | 0 | |||||
| 2025-07-25 | 13F | Ellis Investment Partners, LLC | 4,540 | 0.00 | 271 | 16.31 | ||||
| 2025-08-06 | 13F | New Millennium Group LLC | 100 | 6 | ||||||
| 2025-08-15 | 13F | Captrust Financial Advisors | 22,778 | 6.38 | 1,362 | 23.50 | ||||
| 2025-08-12 | 13F | Bank OZK | 23,979 | -1.25 | 1,433 | 14.64 | ||||
| 2025-08-14 | 13F | Glen Eagle Advisors, LLC | 60 | 0.00 | 4 | 0.00 | ||||
| 2025-08-08 | 13F | Wiser Advisor Group LLC | 0 | -100.00 | 0 | |||||
| 2025-04-24 | 13F | Crescent Grove Advisors, LLC | 0 | -100.00 | 0 | |||||
| 2025-08-01 | 13F | Brookwood Investment Group LLC | 18,850 | 23.49 | 1,127 | 43.26 | ||||
| 2025-08-14 | 13F | D. E. Shaw & Co., Inc. | 7,358 | 0.00 | 440 | 16.14 | ||||
| 2025-08-06 | 13F | Ethos Financial Group, LLC | 4,237 | 0.00 | 253 | 16.06 | ||||
| 2025-08-14 | 13F | EP Wealth Advisors, Inc. | 6,077 | 363 | ||||||
| 2025-08-15 | 13F | Morgan Stanley | 487,383 | -6.28 | 29,136 | 8.79 | ||||
| 2025-07-28 | 13F | Duncker Streett & Co Inc | 340 | 20 | ||||||
| 2025-08-11 | 13F | TD Waterhouse Canada Inc. | 2,620 | 0.00 | 156 | 16.42 | ||||
| 2025-08-05 | 13F | Carmel Capital Management L.L.C. | 97,890 | -0.08 | 5,852 | 15.98 | ||||
| 2025-04-11 | 13F | Insight Advisors, LLC/ PA | 0 | -100.00 | 0 | |||||
| 2025-08-05 | 13F | Prosperity Consulting Group, LLC | 8,513 | -0.53 | 509 | 15.45 | ||||
| 2025-08-14 | 13F | Citadel Advisors Llc | Put | 0 | -100.00 | 0 | ||||
| 2025-07-09 | 13F | Key Client Fiduciary Advisors, LLC | 5,370 | 0.00 | 321 | 16.30 | ||||
| 2025-08-15 | 13F | CI Private Wealth, LLC | 189,915 | -1.95 | 11,353 | 13.83 | ||||
| 2025-07-15 | 13F | North Star Investment Management Corp. | 4,350 | 0.00 | 260 | 16.07 | ||||
| 2025-08-07 | 13F | Resources Investment Advisors, LLC. | 45,994 | -4.42 | 2,750 | 10.94 | ||||
| 2025-08-05 | 13F | Huntington National Bank | 31 | |||||||
| 2025-08-13 | 13F | Beacon Pointe Advisors, LLC | 40,036 | -6.32 | 2,393 | 8.77 | ||||
| 2025-07-16 | 13F | Rainier Family Wealth Inc | 23,229 | 1,389 | ||||||
| 2025-05-14 | 13F | Oarsman Capital, Inc. | 0 | -100.00 | 0 | |||||
| 2025-08-08 | 13F | Creative Planning | 14,240 | 7.29 | 851 | 24.60 | ||||
| 2025-08-11 | 13F | HighTower Advisors, LLC | 15,443 | -1.83 | 923 | 13.95 | ||||
| 2025-07-30 | 13F | Pittenger & Anderson Inc | 875 | 0.00 | 52 | 15.56 | ||||
| 2025-08-11 | 13F | Private Advisor Group, LLC | 18,980 | 11.22 | 1,135 | 29.16 | ||||
| 2025-07-31 | 13F | Burke & Herbert Bank & Trust Co | 17,831 | -1.36 | 1,066 | 14.52 | ||||
| 2025-08-12 | 13F | SRS Capital Advisors, Inc. | 380 | 0.00 | 23 | 15.79 | ||||
| 2025-08-12 | 13F | MAI Capital Management | 1,290 | 0.00 | 77 | 16.67 | ||||
| 2025-08-14 | 13F | Federation des caisses Desjardins du Quebec | 1,915 | 0.00 | 114 | 16.33 | ||||
| 2025-08-14 | 13F | Mml Investors Services, Llc | 11,127 | -18.19 | 1 | |||||
| 2025-08-05 | 13F | GPS Wealth Strategies Group, LLC | 102 | 0.00 | 6 | 20.00 | ||||
| 2025-07-16 | 13F | Signaturefd, Llc | 222 | 62.04 | 13 | 85.71 | ||||
| 2025-08-15 | 13F | Kestra Advisory Services, LLC | 13,448 | 19.44 | 804 | 38.69 | ||||
| 2025-08-01 | 13F | GoalVest Advisory LLC | 491 | 0.00 | 29 | 16.00 | ||||
| 2025-08-14 | 13F | Main Street Financial Solutions, LLC | 22,073 | 0.56 | 1,320 | 16.73 | ||||
| 2025-05-14 | 13F | Smartleaf Asset Management LLC | 0 | -100.00 | 0 | |||||
| 2025-08-05 | 13F | American Institute for Advanced Investment Management, LLP | 0 | -100.00 | 0 | |||||
| 2025-07-11 | 13F | Farther Finance Advisors, LLC | 3,878 | 2.35 | 232 | 18.46 | ||||
| 2025-08-01 | 13F | Bessemer Group Inc | 12,940 | 0.00 | 1 | |||||
| 2025-08-14 | 13F | GWM Advisors LLC | 1,491 | -76.85 | 89 | -73.11 | ||||
| 2025-04-21 | 13F | Means Investment Co., Inc. | 0 | -100.00 | 0 | |||||
| 2025-08-11 | 13F | Principal Securities, Inc. | 62,435 | -37.92 | 3,732 | -34.03 | ||||
| 2025-04-22 | 13F | Castleview Partners, Llc | 0 | -100.00 | 0 | |||||
| 2025-08-11 | 13F | Anfield Capital Management, LLC | 133 | 0.00 | 8 | 16.67 | ||||
| 2025-07-07 | 13F | Wilson & Boucher Capital Management, LLC | 3,775 | 226 | ||||||
| 2025-08-11 | 13F | FSA Wealth Management LLC | 224 | 409.09 | 13 | 550.00 | ||||
| 2025-08-14 | 13F | Manufacturers Life Insurance Company, The | 0 | -100.00 | 0 | |||||
| 2025-07-17 | 13F | Sound Income Strategies, LLC | 39 | -61.00 | 2 | -60.00 | ||||
| 2025-08-13 | 13F | Fort Sheridan Advisors Llc | 5,222 | 0.00 | 312 | 16.42 | ||||
| 2025-08-08 | 13F | Citizens Financial Group Inc/ri | 5,102 | 0.00 | 305 | 16.03 | ||||
| 2025-08-12 | 13F | Prudential Plc | 28,440 | 17.81 | 1,700 | 36.77 | ||||
| 2025-07-17 | 13F | BFI Infinity Ltd. | 0 | -100.00 | 0 | |||||
| 2025-08-29 | 13F | Total Investment Management Inc | 1,100 | 66 | ||||||
| 2025-08-05 | 13F | Fourth Dimension Wealth, LLC | 64 | 0.00 | 4 | 0.00 | ||||
| 2025-08-14 | 13F | Hrt Financial Lp | 0 | -100.00 | 0 | |||||
| 2025-08-12 | 13F | LPL Financial LLC | 300,655 | 4.09 | 17,973 | 20.83 | ||||
| 2025-08-11 | 13F | Citigroup Inc | 40,120 | -5.70 | 2,398 | 9.45 | ||||
| 2025-08-12 | 13F | Proequities, Inc. | 0 | 0 | ||||||
| 2025-08-14 | 13F | Susquehanna International Group, Llp | Call | 18,300 | 306.67 | 1,094 | 373.16 | |||
| 2025-08-13 | 13F | Greenwich Wealth Management LLC | 7,939 | 0.00 | 0 | |||||
| 2025-08-06 | 13F | Atlantic Union Bankshares Corp | 123 | 7 | ||||||
| 2025-08-06 | 13F | Commonwealth Equity Services, Llc | 99,823 | -5.36 | 6 | 0.00 | ||||
| 2025-07-29 | 13F | Curbstone Financial Management Corp | 20,780 | 0.00 | 1,242 | 16.07 | ||||
| 2025-08-07 | 13F | CENTRAL TRUST Co | 1,000 | -6.98 | 60 | 7.27 | ||||
| 2025-08-13 | 13F | Safe Harbor Fiduciary, LLC | 200 | 12 | ||||||
| 2025-07-14 | 13F | UMA Financial Services, Inc. | 1,250 | 0.00 | 75 | 15.63 | ||||
| 2025-08-04 | 13F | Pinnacle Associates Ltd | 45,203 | -8.30 | 2,702 | 6.46 | ||||
| 2025-04-16 | 13F | Wealth Enhancement Advisory Services, Llc | 0 | -100.00 | 0 | |||||
| 2025-07-18 | 13F | PFG Investments, LLC | 3,918 | 234 | ||||||
| 2025-08-14 | 13F | IHT Wealth Management, LLC | 9,397 | -8.38 | 562 | 6.25 | ||||
| 2025-07-31 | 13F | AlTi Global, Inc. | 5,665 | 0.00 | 339 | 16.15 | ||||
| 2025-08-04 | 13F | Roble, Belko & Company, Inc | 87 | 0 | ||||||
| 2025-07-23 | 13F | Bellevue Asset Management, Llc | 517 | 0.00 | 31 | 15.38 | ||||
| 2025-08-12 | 13F | Jpmorgan Chase & Co | 6,006 | 280.85 | 359 | 343.21 | ||||
| 2025-08-14 | 13F | Ameriprise Financial Inc | 129,201 | -9.03 | 7,724 | 5.59 | ||||
| 2025-07-14 | 13F | Pacifica Partners Inc. | 158 | 0.00 | 9 | 28.57 | ||||
| 2025-08-07 | 13F | Flagship Wealth Advisors, Llc | 188 | 0.00 | 11 | 22.22 | ||||
| 2025-08-07 | 13F | Fountainhead AM, LLC | 262,578 | -19.24 | 15,697 | -6.26 | ||||
| 2025-08-08 | 13F | Fortis Group Advisors, LLC | 502 | 0.00 | 30 | 20.00 | ||||
| 2025-08-19 | 13F | Anchor Investment Management, LLC | 50 | 0.00 | 3 | 0.00 | ||||
| 2025-07-07 | 13F | Trust Co | 79 | -1.25 | 5 | 0.00 | ||||
| 2025-08-13 | 13F | Northwestern Mutual Wealth Management Co | 88,367 | -7.92 | 5,283 | 6.88 | ||||
| 2025-07-22 | 13F | Berkshire Money Management, Inc. | 575 | 34 | ||||||
| 2025-07-22 | 13F | USAdvisors Wealth Management, LLC | 0 | -100.00 | 0 | |||||
| 2025-08-07 | 13F | Pinnacle Wealth Management Advisory Group, LLC | 10,470 | -26.85 | 626 | -15.20 | ||||
| 2025-08-18 | 13F/A | National Bank Of Canada /fi/ | 77,541 | -0.72 | 4,626 | 14.99 | ||||
| 2025-04-23 | 13F | Perigon Wealth Management, LLC | 0 | -100.00 | 0 | |||||
| 2025-07-29 | 13F | Creekside Partners | 7,110 | 0.00 | 425 | 16.12 | ||||
| 2025-08-01 | 13F | Biltmore Family Office, LLC | 201,327 | -1.07 | 12,035 | 14.84 | ||||
| 2025-07-21 | 13F | Ameritas Advisory Services, LLC | 194 | 12 | ||||||
| 2025-08-13 | 13F | Baird Financial Group, Inc. | 6,370 | -15.10 | 381 | -1.55 | ||||
| 2025-08-13 | 13F | Solutions 4 Wealth, Ltd | 18,024 | 3.15 | 1,077 | 19.80 | ||||
| 2025-08-14 | 13F | Comerica Bank | 4,815 | 0.04 | 288 | 16.19 | ||||
| 2025-08-01 | 13F | Envestnet Asset Management Inc | 97,458 | 7.02 | 5,826 | 24.22 | ||||
| 2025-07-08 | 13F | Silverleafe Capital Partners, LLC | 0 | -100.00 | 0 | |||||
| 2025-08-14 | 13F | Humankind Investments LLC | 41,500 | 0.00 | 2,481 | 16.05 | ||||
| 2025-04-09 | 13F | Fiduciary Alliance LLC | 0 | -100.00 | 0 | |||||
| 2025-08-14 | 13F | Mariner, LLC | 3,909 | -0.41 | 234 | 15.35 |