Mga Batayang Estadistika
| Pemilik Institusional | 163 total, 163 long only, 0 short only, 0 long/short - change of 18.84% MRQ |
| Alokasi Portofolio Rata-rata | 0.4162 % - change of 18.20% MRQ |
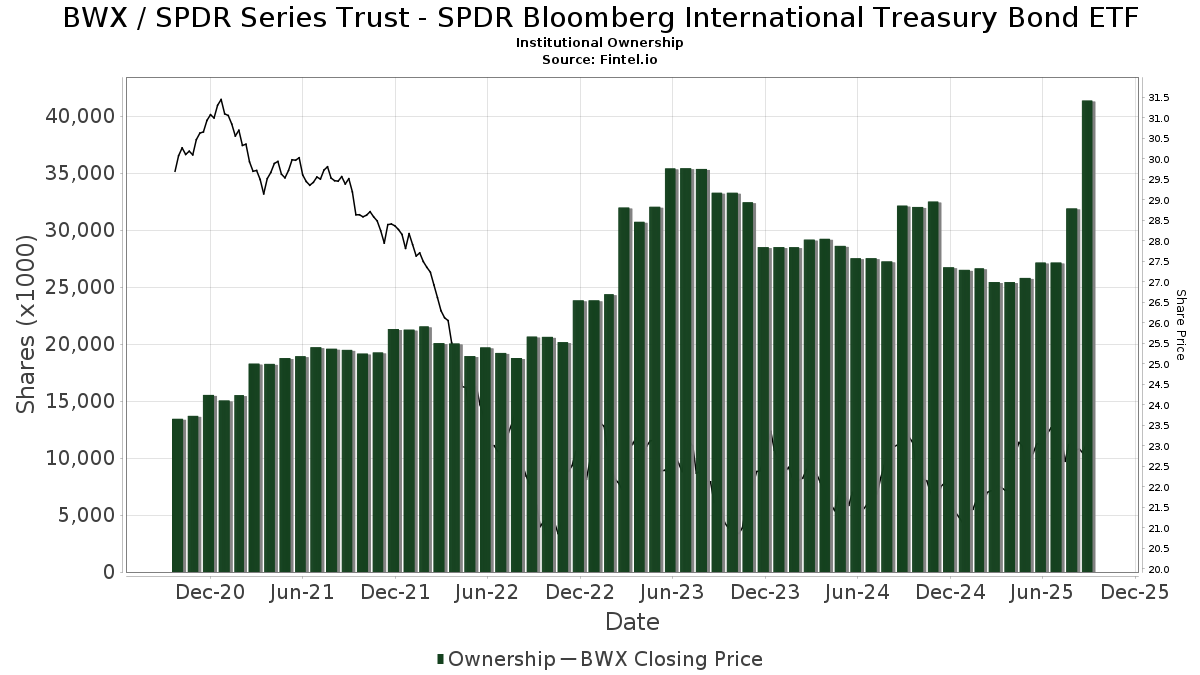
| Saham Institusional (Jangka Panjang) | 41,366,729 (ex 13D/G) - change of 14.22MM shares 52.36% MRQ |
| Nilai Institusional (Jangka Panjang) | $ 952,828 USD ($1000) |
Kepemilikan Institusional dan Pemegang Saham
SPDR Series Trust - SPDR Bloomberg International Treasury Bond ETF (US:BWX) memiliki 163 pemilik institusional dan pemegang saham yang telah mengajukan formulir 13D/G atau 13F kepada Komisi Bursa Efek (Securities Exchange Commission/SEC). Lembaga-lembaga ini memegang total 41,366,729 saham. Pemegang saham terbesar meliputi ARGI Investment Services, LLC, Manufacturers Life Insurance Company, The, Citigroup Inc, Annex Advisory Services, LLC, Morgan Stanley, Checchi Capital Advisers, LLC, State Street Corp, Leuthold Group, Llc, Envestnet Asset Management Inc, and Creative Planning .
Struktur kepemilikan institusional SPDR Series Trust - SPDR Bloomberg International Treasury Bond ETF (ARCA:BWX) menunjukkan posisi terkini di perusahaan oleh institusi dan dana, serta perubahan terbaru dalam ukuran posisi. Pemegang saham utama dapat mencakup investor individu, reksa dana, dana lindung nilai, atau institusi. Jadwal 13D menunjukkan bahwa investor memegang (atau pernah memegang) lebih dari 5% saham perusahaan dan bermaksud (atau pernah bermaksud) untuk secara aktif mengejar perubahan strategi bisnis. Jadwal 13G menunjukkan investasi pasif lebih dari 5%.
The share price as of September 5, 2025 is 23.06 / share. Previously, on September 6, 2024, the share price was 23.08 / share. This represents a decline of 0.09% over that period.
Skor Sentimen Dana
Skor Sentimen Dana (sebelumnya dikenal sebagai Skor Akumulasi Kepemilikan) menemukan saham-saham yang paling banyak dibeli oleh dana. Ini adalah hasil dari model kuantitatif multi-faktor yang canggih yang mengidentifikasi perusahaan dengan tingkat akumulasi institusional tertinggi. Model penilaian menggunakan kombinasi dari total peningkatan pemilik yang diungkapkan, perubahan dalam alokasi portofolio pada pemilik tersebut, dan metrik lainnya. Angka berkisar dari 0 hingga 100, dengan angka yang lebih tinggi menunjukkan tingkat akumulasi yang lebih tinggi dibandingkan dengan perusahaan sejenisnya, dan 50 adalah rata-ratanya.
Frekuensi Pembaruan: Setiap Hari
Lihat Ownership Explorer, yang menyediakan daftar perusahaan dengan peringkat tertinggi.
Rasio Put/Call Institusional
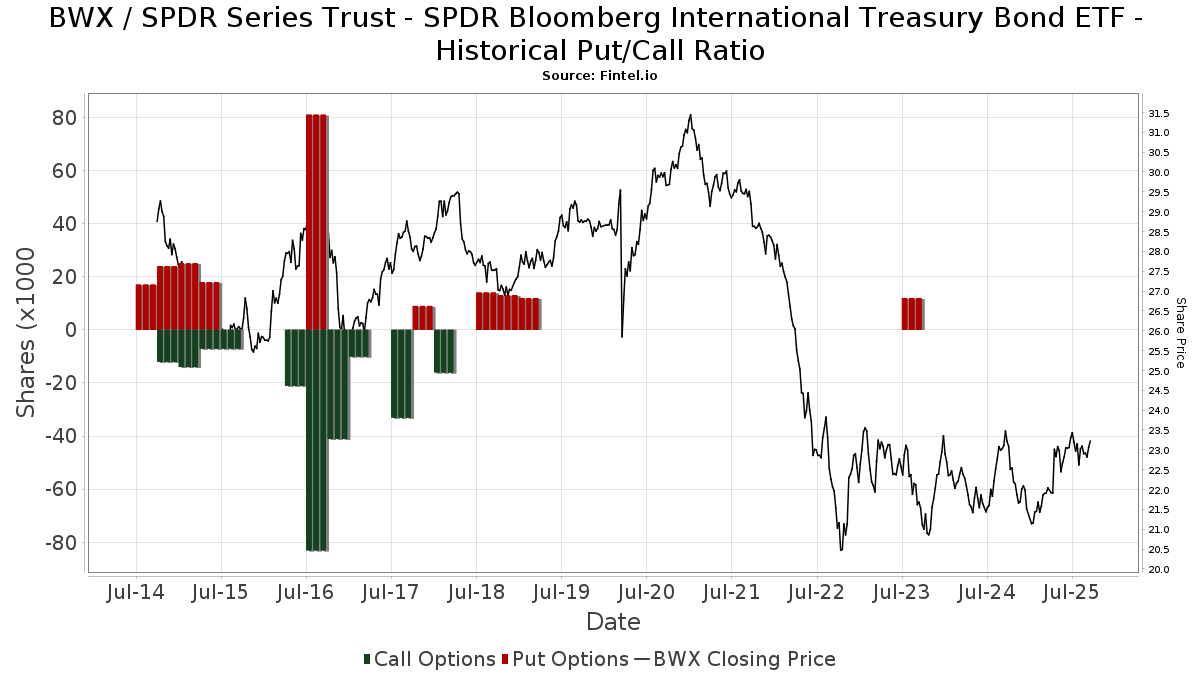
Selain melaporkan isu ekuitas dan utang standar, institusi dengan aset di bawah manajemen lebih dari 100 juta dolar AS juga harus mengungkapkan kepemilikan opsi put dan call mereka. Karena opsi put umumnya menunjukkan sentimen negatif, dan opsi call menunjukkan sentimen positif, kita dapat mengetahui sentimen institusional secara keseluruhan dengan memplot rasio put terhadap call. Grafik di sebelah kanan memplot rasio put/call historis untuk instrumen ini.
Menggunakan Rasio Put/Call sebagai indikator sentimen investor mengatasi salah satu kekurangan utama dari penggunaan total kepemilikan institusional, yaitu sejumlah besar aset yang dikelola diinvestasikan secara pasif untuk melacak indeks. Dana yang dikelola secara pasif biasanya tidak membeli opsi, sehingga indikator rasio put/call lebih akurat dalam melacak sentimen dana yang dikelola secara aktif.
Pengajuan 13F dan NPORT
Detail pada pengajuan 13F tersedia gratis. Detail pada pengajuan NP memerlukan keanggotaan premium. Baris berwarna hijau menunjukkan posisi baru. Baris berwarna merah menunjukkan posisi yang sudah ditutup. Klik tautan ini ikon untuk melihat riwayat transaksi selengkapnya.
Tingkatkan
untuk membuka data premium dan mengekspor ke Excel ![]() .
.
| Tanggal File | Sumber | Investor | Ketik | Presyo ng Avg (Silangan) |
Saham | Δ Saham (%) |
Dilaporkan Nilai ($1000) |
Nilai Δ (%) |
Alokasi Port (%) |
|
|---|---|---|---|---|---|---|---|---|---|---|
| 2025-07-30 | 13F | Legacy Wealth Asset Management, LLC | 29,644 | 0.25 | 696 | 7.74 | ||||
| 2025-08-14 | 13F | Snowden Capital Advisors LLC | 18,364 | -0.01 | 431 | 7.48 | ||||
| 2025-08-26 | NP | LCR - Leuthold Core ETF | 78,256 | -7.14 | 1,838 | -0.22 | ||||
| 2025-07-15 | 13F | Mather Group, Llc. | 0 | -100.00 | 0 | |||||
| 2025-07-25 | 13F | Ackerman Capital Advisors, LLC | 9,869 | -97.54 | 232 | -97.37 | ||||
| 2025-08-04 | 13F | Center for Financial Planning, Inc. | 1,403 | 33 | ||||||
| 2025-08-12 | 13F | Steward Partners Investment Advisory, Llc | 6,319 | -51.81 | 148 | -48.25 | ||||
| 2025-08-28 | NP | SSTIX - State Street Total Return V.I.S. Fund Class 1 Shares | 453,950 | 10,663 | ||||||
| 2025-08-14 | 13F | Ancora Advisors, LLC | 36 | 0.00 | 1 | |||||
| 2025-07-11 | 13F | Pinnacle Bancorp, Inc. | 300 | 0.00 | 7 | 16.67 | ||||
| 2025-08-15 | 13F | Tower Research Capital LLC (TRC) | 7 | 600.00 | 0 | |||||
| 2025-09-04 | 13F | Beacon Capital Management, Inc. | 2,722 | 64 | ||||||
| 2025-07-18 | 13F/A | MJT & Associates Financial Advisory Group, Inc. | 988 | 0.00 | 23 | 9.52 | ||||
| 2025-07-24 | 13F | VanderPol Investments L.L.C. | 53,818 | 1,264 | ||||||
| 2025-08-14 | 13F | Visionary Wealth Advisors | 0 | -100.00 | 0 | |||||
| 2025-05-14 | 13F | Caitlin John, LLC | 0 | -100.00 | 0 | |||||
| 2025-08-14 | 13F | Jane Street Group, Llc | 565,308 | -24.76 | 13,279 | -19.15 | ||||
| 2025-07-24 | 13F | IFP Advisors, Inc | 57 | 0.00 | 1 | 0.00 | ||||
| 2025-07-22 | 13F | Net Worth Advisory Group | 377,753 | 5.89 | 8,873 | 13.79 | ||||
| 2025-07-25 | 13F | Investment Advisory Group, LLC | 0 | -100.00 | 0 | |||||
| 2025-07-28 | 13F | RFG Advisory, LLC | 230,188 | 5,407 | ||||||
| 2025-08-14 | 13F | Stifel Financial Corp | 68,433 | -2.52 | 1,607 | 4.76 | ||||
| 2025-05-14 | 13F | Napa Wealth Management | 0 | -100.00 | 0 | |||||
| 2025-07-31 | 13F | Auour Investments LLC | 72,364 | 2.46 | 1,700 | 4.23 | ||||
| 2025-08-08 | 13F | Creative Planning | 806,718 | -19.13 | 18,950 | -13.11 | ||||
| 2025-05-28 | NP | FISR - SPDR SSGA Fixed Income Sector Rotation ETF This fund is a listed as child fund of State Street Corp and if that institution has disclosed ownership in this security, then these positions will not be double counted when calculating total shares and total value | 726 | -99.89 | 16 | -99.90 | ||||
| 2025-07-14 | 13F | Pacifica Partners Inc. | 45 | 0.00 | 1 | 0.00 | ||||
| 2025-08-13 | 13F | Cerity Partners LLC | 43,673 | 334.43 | 1,026 | 368.04 | ||||
| 2025-07-31 | 13F | FSM Wealth Advisors, LLC | 13,405 | -2.46 | 311 | 3.67 | ||||
| 2025-08-07 | 13F | David R. Rahn & Associates Inc. | 102,231 | -81.04 | 2,401 | -79.63 | ||||
| 2025-08-13 | 13F | Colonial Trust Co / SC | 3,001 | 65.07 | 70 | 79.49 | ||||
| 2025-07-21 | 13F | Ameritas Advisory Services, LLC | 1,322 | 31 | ||||||
| 2025-05-15 | 13F | Mariner, LLC | 0 | -100.00 | 0 | |||||
| 2025-04-23 | 13F | Mascagni Wealth Management, Inc. | 0 | -100.00 | 0 | -100.00 | ||||
| 2025-07-09 | 13F | Breakwater Investment Management | 2,807 | 0.00 | 66 | 6.56 | ||||
| 2025-08-14 | 13F | Fairview Capital Investment Management, Llc | 37,341 | 3.18 | 877 | 10.87 | ||||
| 2025-04-22 | 13F | Castleview Partners, Llc | 0 | -100.00 | 0 | -100.00 | ||||
| 2025-08-07 | 13F | Allworth Financial LP | 1,047 | 681.34 | 25 | 700.00 | ||||
| 2025-08-15 | 13F | Global View Capital Management LLC | 33,315 | 783 | ||||||
| 2025-08-08 | 13F | SBI Securities Co., Ltd. | 1,053 | 0.77 | 25 | 9.09 | ||||
| 2025-07-28 | 13F | Harbour Investments, Inc. | 273 | 950.00 | 6 | |||||
| 2025-08-13 | 13F | Proactive Wealth Strategies LLC | 8,571 | 0 | ||||||
| 2025-08-13 | 13F | Rsm Us Wealth Management Llc | 19,415 | 456 | ||||||
| 2025-08-14 | 13F | Smartleaf Asset Management LLC | 9,192 | 2,275.19 | 215 | 2,575.00 | ||||
| 2025-05-08 | 13F | Altiora Financial Group, LLC | 0 | -100.00 | 0 | |||||
| 2025-08-14 | 13F | Financial Engines Advisors L.L.C. | 403,152 | -1.65 | 9,470 | 5.68 | ||||
| 2025-07-31 | 13F | Brinker Capital Investments, LLC | 0 | -100.00 | 0 | -100.00 | ||||
| 2025-07-17 | 13F | Wolff Wiese Magana Llc | 127 | 0.00 | 3 | 0.00 | ||||
| 2025-04-14 | 13F | Strategic Wealth Designers | 0 | -100.00 | 0 | -100.00 | ||||
| 2025-07-31 | 13F | United Community Bank | 5,959 | 25.29 | 140 | 34.95 | ||||
| 2025-08-13 | 13F | ARGI Investment Services, LLC | 7,984,272 | 58.59 | 187,551 | 70.42 | ||||
| 2025-07-11 | 13F | Farther Finance Advisors, LLC | 518 | 0.00 | 12 | 9.09 | ||||
| 2025-07-24 | 13F | Forefront Analytics, LLC | 88,982 | 2,089 | ||||||
| 2025-08-13 | 13F | Johnson Financial Group, Inc. | 2,427 | 1.12 | 57 | 9.62 | ||||
| 2025-04-22 | 13F | Synergy Financial Management, LLC | 0 | -100.00 | 0 | |||||
| 2025-08-14 | 13F | Ameriprise Financial Inc | 257,513 | 21.47 | 6,049 | 30.51 | ||||
| 2025-08-26 | NP | LCORX - Leuthold Core Investment Fund Retail Class | 411,919 | 0.00 | 9,676 | 7.45 | ||||
| 2025-09-04 | 13F/A | Advisor Group Holdings, Inc. | 92,197 | 22.61 | 2,156 | 31.16 | ||||
| 2025-08-11 | 13F | Aptus Capital Advisors, LLC | 287 | 0.00 | 7 | 0.00 | ||||
| 2025-07-25 | 13F | Concord Wealth Partners | 128 | 0.79 | 3 | 50.00 | ||||
| 2025-08-15 | 13F | Morgan Stanley | 2,625,775 | 22.19 | 61,679 | 31.31 | ||||
| 2025-07-11 | 13F | Seacrest Wealth Management, Llc | 12,881 | 0.65 | 303 | 8.24 | ||||
| 2025-08-28 | NP | GAL - SPDR SSGA Global Allocation ETF This fund is a listed as child fund of State Street Corp and if that institution has disclosed ownership in this security, then these positions will not be double counted when calculating total shares and total value | 221,473 | 98.66 | 5,202 | 113.46 | ||||
| 2025-08-13 | 13F | Renaissance Technologies Llc | 185,500 | 4,357 | ||||||
| 2025-04-29 | 13F | Hm Payson & Co | 54,208 | 376.30 | 1,185 | 387.24 | ||||
| 2025-07-25 | 13F | Cwm, Llc | 0 | -100.00 | 0 | |||||
| 2025-08-12 | 13F | Jpmorgan Chase & Co | 37,510 | 231.48 | 881 | 256.68 | ||||
| 2025-08-14 | 13F | Susquehanna International Group, Llp | 0 | -100.00 | 0 | |||||
| 2025-05-21 | 13F/A | Geneos Wealth Management Inc. | 59 | 1 | ||||||
| 2025-08-13 | 13F | Mackenzie Financial Corp | 173,005 | 0.00 | 4,064 | 7.46 | ||||
| 2025-08-07 | 13F | Montag A & Associates Inc | 896 | 0.00 | 21 | 10.53 | ||||
| 2025-07-23 | 13F/A | Euro Pacific Asset Management, LLC | 54,023 | -1.77 | 1 | 0.00 | ||||
| 2025-08-06 | 13F | Commonwealth Equity Services, Llc | 445,119 | 2,155.48 | 10 | |||||
| 2025-08-13 | 13F | EverSource Wealth Advisors, LLC | 0 | -100.00 | 0 | |||||
| 2025-08-14 | 13F | Gen-Wealth Partners Inc | 1,641 | 1.61 | 39 | 8.57 | ||||
| 2025-05-14 | 13F | Bnp Paribas Arbitrage, Sa | 0 | -100.00 | 0 | |||||
| 2025-08-06 | 13F | Csenge Advisory Group | 11,233 | 2.50 | 258 | 2.39 | ||||
| 2025-08-07 | 13F | Blackhawk Capital Partners LLC. | 0 | -100.00 | 0 | |||||
| 2025-08-05 | 13F | Bank Of Montreal /can/ | 63,860 | 1,908.81 | 1,500 | 2,073.91 | ||||
| 2025-07-09 | 13F | Post Resch Tallon Group Inc. | 12,713 | 0.00 | 299 | 7.58 | ||||
| 2025-07-31 | 13F | Moser Wealth Advisors, LLC | 219 | 5 | ||||||
| 2025-08-28 | NP | SSIZX - Sierra Tactical Core Income Fund Class A Shares | 461,700 | 10,845 | ||||||
| 2025-08-14 | 13F | Sunbelt Securities, Inc. | 111 | 0.00 | 2 | 0.00 | ||||
| 2025-07-30 | NP | QVOY - Q3 All-Season Active Rotation ETF | 25,155 | 577 | ||||||
| 2025-05-14 | 13F | Northwestern Mutual Wealth Management Co | 0 | -100.00 | 0 | |||||
| 2025-07-17 | 13F | Fifth Third Securities, Inc. | 19,101 | -28.06 | 449 | -22.76 | ||||
| 2025-07-25 | 13F | Richardson Financial Services Inc. | 989 | -28.85 | 23 | -23.33 | ||||
| 2025-08-08 | 13F | Capital Investment Advisory Services, LLC | 1,556 | 461.73 | 37 | 500.00 | ||||
| 2025-08-14 | 13F | GWM Advisors LLC | 52,529 | 10,533.40 | 1,234 | 12,230.00 | ||||
| 2025-07-09 | 13F | Baron Financial Group, LLC | 112,126 | 4.74 | 2,634 | 12.52 | ||||
| 2025-08-13 | 13F | Jones Financial Companies Lllp | 61,732 | 29.20 | 1,441 | 38.03 | ||||
| 2025-04-24 | 13F | Tsfg, Llc | 0 | -100.00 | 0 | |||||
| 2025-07-14 | 13F | UMA Financial Services, Inc. | 47 | 0.00 | 1 | 0.00 | ||||
| 2025-08-19 | 13F | Cape Investment Advisory, Inc. | 1,640 | 0.61 | 39 | 8.57 | ||||
| 2025-07-16 | 13F | Brown, Lisle/cummings, Inc. | 0 | -100.00 | 0 | |||||
| 2025-08-14 | 13F | Wells Fargo & Company/mn | 135,974 | -6.25 | 3,194 | 0.76 | ||||
| 2025-08-11 | 13F | Citigroup Inc | 3,753,724 | 19,000.01 | 88,175 | 20,453.38 | ||||
| 2025-08-12 | 13F | CIBC Private Wealth Group, LLC | 76 | -74.58 | 2 | -83.33 | ||||
| 2025-04-14 | 13F | Park Avenue Securities Llc | 0 | -100.00 | 0 | |||||
| 2025-08-13 | 13F | RPg Family Wealth Advisory, LLC | 14,286 | -95.92 | 336 | -95.62 | ||||
| 2025-08-12 | 13F | Global Retirement Partners, LLC | 723 | -0.28 | 17 | 6.67 | ||||
| 2025-08-08 | 13F | Emerald Investment Partners, Llc | 268 | 0.00 | 6 | 20.00 | ||||
| 2025-07-24 | 13F | Blair William & Co/il | 959 | 17.52 | 23 | 29.41 | ||||
| 2025-07-17 | 13F | Sound Income Strategies, LLC | 34 | 1 | ||||||
| 2025-08-05 | 13F | Lord & Richards Wealth Management, LLC | 0 | -100.00 | 0 | |||||
| 2025-07-10 | 13F | Worth Asset Management, LLC | 31,420 | 738 | ||||||
| 2025-05-30 | NP | GPTCX - GuidePath(R) Conservative Allocation Fund Service Shares | 61,241 | 1.34 | 1,339 | 3.56 | ||||
| 2025-08-08 | 13F | Larson Financial Group LLC | 47 | 1 | ||||||
| 2025-05-01 | 13F | High Note Wealth, LLC | 0 | -100.00 | 0 | |||||
| 2025-07-23 | 13F | Vontobel Holding Ltd. | 19,023 | -12.10 | 447 | -5.71 | ||||
| 2025-07-29 | 13F | FLC Capital Advisors | 392,651 | 9,223 | ||||||
| 2025-07-29 | 13F | Tradewinds Capital Management, LLC | 754,299 | 17,718 | ||||||
| 2025-08-01 | 13F | Envestnet Asset Management Inc | 816,030 | 4.52 | 19,169 | 12.32 | ||||
| 2025-07-17 | 13F | Eclectic Associates Inc /adv | 25,206 | -0.66 | 592 | 6.86 | ||||
| 2025-08-14 | 13F | Raymond James Financial Inc | 32,666 | 0.61 | 767 | 8.18 | ||||
| 2025-08-12 | 13F | Blueprint Financial Advisors LLC | 294,633 | 51.21 | 6,921 | 62.48 | ||||
| 2025-08-06 | 13F | Valued Wealth Advisors LLC | 0 | -100.00 | 0 | |||||
| 2025-05-08 | 13F | Natixis Advisors, L.p. | 0 | -100.00 | 0 | |||||
| 2025-08-12 | 13F | XTX Topco Ltd | 12,237 | 287 | ||||||
| 2025-08-05 | 13F | Simplex Trading, Llc | 189 | 0 | ||||||
| 2025-07-14 | 13F | Golden State Equity Partners | 33,102 | -16.25 | 778 | -9.97 | ||||
| 2025-08-14 | 13F | Tennessee Valley Asset Management Partners | 16,116 | 12.96 | 379 | 21.54 | ||||
| 2025-08-05 | 13F | Huntington National Bank | 0 | |||||||
| 2025-08-07 | 13F | Bradley & Co. Private Wealth Management, LLC | 0 | 0 | ||||||
| 2025-08-11 | 13F | Principal Securities, Inc. | 20,426 | 46.17 | 480 | 60.74 | ||||
| 2025-07-23 | 13F | Tectonic Advisors Llc | 442,925 | 29.12 | 10,404 | 38.76 | ||||
| 2025-08-14 | 13F | UBS Group AG | 132,018 | 11.93 | 3,101 | 20.29 | ||||
| 2025-07-07 | 13F | Upper Left Wealth Management, LLC | 226,378 | -0.74 | 5,318 | 6.66 | ||||
| 2025-07-18 | 13F | Pure Financial Advisors, Inc. | 48,524 | -5.09 | 1,140 | 1.97 | ||||
| 2025-08-14 | 13F | CoreCap Advisors, LLC | 22,965 | 795.67 | 539 | 862.50 | ||||
| 2025-08-12 | 13F | Blueprint Investment Partners LLC | 662,796 | 52.95 | 15,569 | 64.37 | ||||
| 2025-07-17 | 13F | Spartan Planning & Wealth Management | 176,993 | 64.63 | 4,158 | 76.89 | ||||
| 2025-04-21 | 13F | Cherry Tree Wealth Management, LLC | 0 | -100.00 | 0 | |||||
| 2025-08-12 | 13F | Proequities, Inc. | 0 | 0 | ||||||
| 2025-08-11 | 13F | HighTower Advisors, LLC | 17,431 | 409 | ||||||
| 2025-08-11 | 13F | Strategic Wealth Partners, Ltd. | 250 | 6 | ||||||
| 2025-07-28 | 13F | Axxcess Wealth Management, Llc | 17,964 | 422 | ||||||
| 2025-08-13 | 13F | Leuthold Group, Llc | 839,145 | 3.89 | 19,712 | 11.64 | ||||
| 2025-08-06 | 13F | Adviser Investments LLC | 181,952 | -60.95 | 4,274 | -58.03 | ||||
| 2025-08-14 | 13F | Destination Wealth Management | 10,078 | 237 | ||||||
| 2025-05-13 | 13F | Peak Financial Management, Inc. | 0 | -100.00 | 0 | |||||
| 2025-08-11 | 13F | Covestor Ltd | 15,656 | 26.86 | 0 | |||||
| 2025-09-03 | 13F | Q3 Asset Management | 93,851 | 2 | ||||||
| 2025-08-14 | 13F | Wiley Bros.-aintree Capital, Llc | 9,871 | 232 | ||||||
| 2025-07-18 | 13F | Client 1st Advisory Group, Llc | 14,067 | 0.00 | 330 | 7.49 | ||||
| 2025-08-06 | 13F | AE Wealth Management LLC | 32 | -99.47 | 1 | -100.00 | ||||
| 2025-07-30 | 13F | Prosperity Financial Group, Inc. | 9,511 | 223 | ||||||
| 2025-08-12 | 13F | Pathstone Holdings, LLC | 45,011 | 1,057 | ||||||
| 2025-08-12 | 13F | Howe & Rusling Inc | 401 | -37.34 | 9 | -30.77 | ||||
| 2025-08-13 | 13F | Cresset Asset Management, LLC | 38,214 | 898 | ||||||
| 2025-08-08 | 13F | Pnc Financial Services Group, Inc. | 48,149 | 122.42 | 1,131 | 139.11 | ||||
| 2025-08-14 | 13F | Comerica Bank | 13,998 | 44.07 | 329 | 54.72 | ||||
| 2025-07-25 | 13F | Keener Financial Planning LLC | 1,162 | 0 | ||||||
| 2025-08-15 | 13F | Kestra Advisory Services, LLC | 30,042 | 10.00 | 706 | 18.09 | ||||
| 2025-07-11 | 13F | Annex Advisory Services, LLC | 3,130,772 | 73,542 | ||||||
| 2025-08-08 | 13F | Cetera Investment Advisers | 347,371 | -2.18 | 8,160 | 5.11 | ||||
| 2025-08-14 | 13F | Cardiff Park Advisors, Llc | 18,435 | 0.00 | 433 | 7.71 | ||||
| 2025-08-11 | 13F | Sykon Capital Llc | 232,600 | 5,464 | ||||||
| 2025-08-14 | 13F | Riggs Asset Managment Co. Inc. | 0 | -100.00 | 0 | |||||
| 2025-08-12 | 13F | LPL Financial LLC | 401,392 | -9.61 | 9,429 | -2.87 | ||||
| 2025-07-22 | 13F | 4Thought Financial Group Inc. | 12,551 | -4.47 | 295 | 2.44 | ||||
| 2025-08-26 | NP | GLBIX - Leuthold Global Fund Institutional Class | 12,929 | 0.00 | 304 | 7.45 | ||||
| 2025-08-14 | 13F | State Street Corp | 904,760 | 2,766.07 | 21,253 | 2,980.00 | ||||
| 2025-08-13 | 13F/A | StoneX Group Inc. | 10,157 | 228 | ||||||
| 2025-08-12 | 13F | MAI Capital Management | 84 | 0.00 | 2 | 0.00 | ||||
| 2025-08-14 | 13F | Manufacturers Life Insurance Company, The | 7,099,331 | 11.52 | 166,763 | 19.84 | ||||
| 2025-08-14 | 13F | Bank Of America Corp /de/ | 488,691 | 54.86 | 11,479 | 66.41 | ||||
| 2025-08-04 | 13F | Assetmark, Inc | 38,320 | -65.37 | 900 | -62.78 | ||||
| 2025-07-10 | 13F | Wealth Enhancement Advisory Services, Llc | 9,730 | 227 | ||||||
| 2025-08-06 | 13F | Convergence Financial, LLC | 45,054 | 41.42 | 1,058 | 52.01 | ||||
| 2025-08-12 | 13F | O'shaughnessy Asset Management, Llc | 48 | 1 | ||||||
| 2025-08-14 | 13F | Hancock Whitney Corp | 75,330 | 1,770 | ||||||
| 2025-05-05 | 13F | Transce3nd, LLC | 0 | -100.00 | 0 | |||||
| 2025-08-14 | 13F | Colony Group, LLC | 9,924 | 0.80 | 233 | 8.37 | ||||
| 2025-07-21 | 13F | Quent Capital, LLC | 103,939 | -6.36 | 2,442 | 0.62 | ||||
| 2025-08-13 | 13F | Satovsky Asset Management Llc | 19,250 | 452 | ||||||
| 2025-08-06 | 13F | First Horizon Advisors, Inc. | 4,849 | -59.66 | 114 | -56.87 | ||||
| 2025-05-02 | 13F | Cullen/frost Bankers, Inc. | 0 | -100.00 | 0 | |||||
| 2025-08-14 | 13F | Citadel Advisors Llc | 22,167 | 30.04 | 521 | 39.78 | ||||
| 2025-07-25 | 13F | Atria Wealth Solutions, Inc. | 0 | -100.00 | 0 | |||||
| 2025-07-03 | 13F | Fiduciary Financial Group, Llc | 10,747 | 253 | ||||||
| 2025-07-24 | 13F | Us Bancorp \de\ | 0 | -100.00 | 0 | |||||
| 2025-04-29 | 13F | Truist Financial Corp | 0 | -100.00 | 0 | |||||
| 2025-08-08 | 13F | Croban | 88,982 | 11.80 | 2,089 | 20.13 | ||||
| 2025-07-25 | 13F | Envestnet Portfolio Solutions, Inc. | 62,196 | -45.56 | 1,461 | -41.53 | ||||
| 2025-04-21 | 13F | Nelson, Van Denburg & Campbell Wealth Management Group, LLC | 0 | -100.00 | 0 | |||||
| 2025-08-13 | 13F | Summit Financial, LLC | 8,563 | 201 | ||||||
| 2025-07-22 | 13F | Coastal Investment Advisors, Inc. | 12,207 | 2.49 | 287 | 10.00 | ||||
| 2025-08-13 | 13F | Congress Wealth Management LLC / DE / | 13,522 | -2.69 | 318 | 4.62 | ||||
| 2025-07-22 | 13F | Checchi Capital Advisers, LLC | 1,627,532 | 1.05 | 38,231 | 8.59 | ||||
| 2025-08-14 | 13F | Royal Bank Of Canada | 29,123 | 6.22 | 684 | 14.00 | ||||
| 2025-08-06 | 13F | Walkner Condon Financial Advisors LLC | 205,328 | 119.90 | 4,823 | 136.26 | ||||
| 2025-07-24 | 13F | rebel Financial LLC | 267,556 | 6,285 | ||||||
| 2025-08-14 | 13F | Mercer Global Advisors Inc /adv | 72,173 | 603.03 | 1,695 | 656.70 | ||||
| 2025-07-02 | 13F | HBW Advisory Services LLC | 8,803 | 207 | ||||||
| 2025-08-14 | 13F | Mml Investors Services, Llc | 154,234 | -6.10 | 4 | 0.00 | ||||
| 2025-07-31 | 13F | Cambridge Investment Research Advisors, Inc. | 17,756 | 0 | ||||||
| 2025-07-29 | 13F | Salomon & Ludwin, LLC | 32 | -51.52 | 1 | -100.00 | ||||
| 2025-05-16 | 13F | Coppell Advisory Solutions LLC | 0 | -100.00 | 0 | |||||
| 2025-07-31 | 13F | Oppenheimer & Co Inc | 22,885 | -1.31 | 538 | 6.13 | ||||
| 2025-08-14 | 13F | Fmr Llc | 645 | -0.15 | 15 | 7.14 | ||||
| 2025-05-06 | 13F | Avantax Advisory Services, Inc. | 0 | -100.00 | 0 |
Other Listings
| MX:BWX |