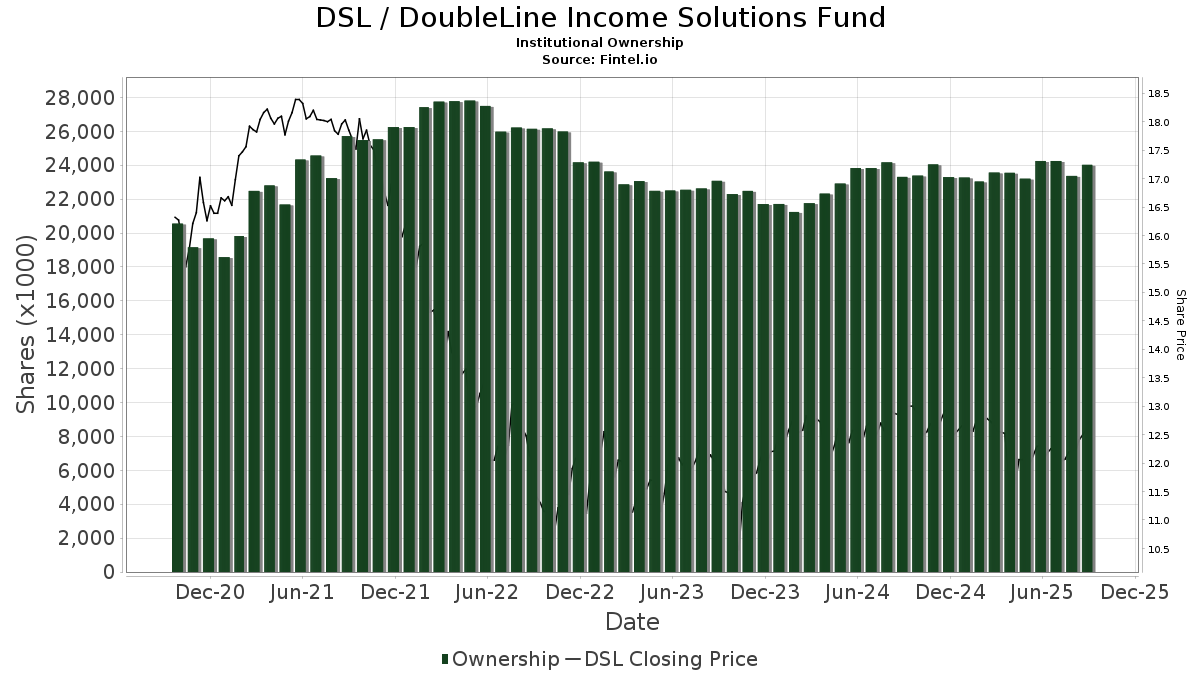
Mga Batayang Estadistika
| Pemilik Institusional | 191 total, 189 long only, 0 short only, 2 long/short - change of 1.60% MRQ |
| Alokasi Portofolio Rata-rata | 0.1170 % - change of -25.43% MRQ |
| Saham Institusional (Jangka Panjang) | 24,013,661 (ex 13D/G) - change of -0.25MM shares -1.03% MRQ |
| Nilai Institusional (Jangka Panjang) | $ 266,301 USD ($1000) |
Kepemilikan Institusional dan Pemegang Saham
DoubleLine Income Solutions Fund (US:DSL) memiliki 191 pemilik institusional dan pemegang saham yang telah mengajukan formulir 13D/G atau 13F kepada Komisi Bursa Efek (Securities Exchange Commission/SEC). Lembaga-lembaga ini memegang total 24,013,661 saham. Pemegang saham terbesar meliputi McGowan Group Asset Management, Inc., Morgan Stanley, Wells Fargo & Company/mn, UBS Group AG, Invesco Ltd., PCEF - Invesco CEF Income Composite ETF, Stifel Financial Corp, Ameriprise Financial Inc, Raymond James Financial Inc, and Royal Bank Of Canada .
Struktur kepemilikan institusional DoubleLine Income Solutions Fund (NYSE:DSL) menunjukkan posisi terkini di perusahaan oleh institusi dan dana, serta perubahan terbaru dalam ukuran posisi. Pemegang saham utama dapat mencakup investor individu, reksa dana, dana lindung nilai, atau institusi. Jadwal 13D menunjukkan bahwa investor memegang (atau pernah memegang) lebih dari 5% saham perusahaan dan bermaksud (atau pernah bermaksud) untuk secara aktif mengejar perubahan strategi bisnis. Jadwal 13G menunjukkan investasi pasif lebih dari 5%.
The share price as of September 4, 2025 is 12.50 / share. Previously, on September 5, 2024, the share price was 13.01 / share. This represents a decline of 3.92% over that period.
Skor Sentimen Dana
Skor Sentimen Dana (sebelumnya dikenal sebagai Skor Akumulasi Kepemilikan) menemukan saham-saham yang paling banyak dibeli oleh dana. Ini adalah hasil dari model kuantitatif multi-faktor yang canggih yang mengidentifikasi perusahaan dengan tingkat akumulasi institusional tertinggi. Model penilaian menggunakan kombinasi dari total peningkatan pemilik yang diungkapkan, perubahan dalam alokasi portofolio pada pemilik tersebut, dan metrik lainnya. Angka berkisar dari 0 hingga 100, dengan angka yang lebih tinggi menunjukkan tingkat akumulasi yang lebih tinggi dibandingkan dengan perusahaan sejenisnya, dan 50 adalah rata-ratanya.
Frekuensi Pembaruan: Setiap Hari
Lihat Ownership Explorer, yang menyediakan daftar perusahaan dengan peringkat tertinggi.
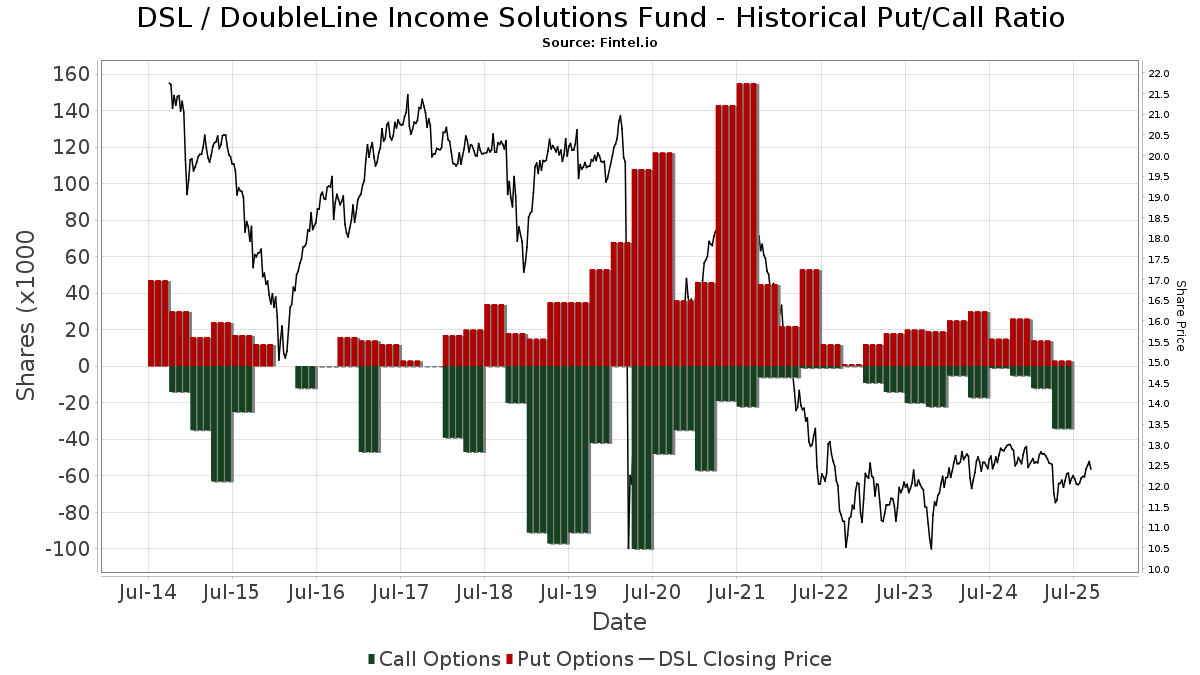
Rasio Put/Call Institusional
Selain melaporkan isu ekuitas dan utang standar, institusi dengan aset di bawah manajemen lebih dari 100 juta dolar AS juga harus mengungkapkan kepemilikan opsi put dan call mereka. Karena opsi put umumnya menunjukkan sentimen negatif, dan opsi call menunjukkan sentimen positif, kita dapat mengetahui sentimen institusional secara keseluruhan dengan memplot rasio put terhadap call. Grafik di sebelah kanan memplot rasio put/call historis untuk instrumen ini.
Menggunakan Rasio Put/Call sebagai indikator sentimen investor mengatasi salah satu kekurangan utama dari penggunaan total kepemilikan institusional, yaitu sejumlah besar aset yang dikelola diinvestasikan secara pasif untuk melacak indeks. Dana yang dikelola secara pasif biasanya tidak membeli opsi, sehingga indikator rasio put/call lebih akurat dalam melacak sentimen dana yang dikelola secara aktif.
Pengajuan 13F dan NPORT
Detail pada pengajuan 13F tersedia gratis. Detail pada pengajuan NP memerlukan keanggotaan premium. Baris berwarna hijau menunjukkan posisi baru. Baris berwarna merah menunjukkan posisi yang sudah ditutup. Klik tautan ini ikon untuk melihat riwayat transaksi selengkapnya.
Tingkatkan
untuk membuka data premium dan mengekspor ke Excel ![]() .
.
| Tanggal File | Sumber | Investor | Ketik | Presyo ng Avg (Silangan) |
Saham | Δ Saham (%) |
Dilaporkan Nilai ($1000) |
Nilai Δ (%) |
Alokasi Port (%) |
|
|---|---|---|---|---|---|---|---|---|---|---|
| 2025-08-14 | 13F | First Foundation Advisors | 20,553 | -14.13 | 252 | -16.61 | ||||
| 2025-08-13 | 13F | Granite Investment Partners, LLC | 33,193 | 2.38 | 406 | -0.49 | ||||
| 2025-08-12 | 13F | CIBC Private Wealth Group, LLC | 10,033 | 0.01 | 123 | 7.02 | ||||
| 2025-07-17 | 13F | Beacon Capital Management, LLC | 1,064 | 2.80 | 13 | 0.00 | ||||
| 2025-07-09 | 13F | Triumph Capital Management | 30,857 | -44.38 | 378 | -46.07 | ||||
| 2025-08-11 | 13F | Pin Oak Investment Advisors Inc | 42,065 | 0.00 | 1 | |||||
| 2025-08-11 | 13F | Strategic Wealth Partners, Ltd. | 197,357 | 69.03 | 2,416 | 61.32 | ||||
| 2025-08-18 | 13F | Hollencrest Capital Management | 36,938 | 2.06 | 452 | -0.88 | ||||
| 2025-08-12 | 13F | Insigneo Advisory Services, Llc | 17,454 | 0.00 | 214 | -3.18 | ||||
| 2025-07-14 | 13F | Sowell Financial Services LLC | 24,709 | -67.18 | 302 | -68.18 | ||||
| 2025-07-31 | 13F | Oppenheimer & Co Inc | 48,801 | -5.93 | 597 | -8.72 | ||||
| 2025-05-09 | 13F | Pathway Financial Advisers, LLC | 0 | -100.00 | 0 | |||||
| 2025-08-11 | 13F | United Advisor Group, LLC | 33,853 | -22.42 | 414 | -24.73 | ||||
| 2025-08-14 | 13F | Dauntless Investment Group, LLC | 326 | 4 | ||||||
| 2025-08-13 | 13F | Jones Financial Companies Lllp | 1,068 | 13 | ||||||
| 2025-08-07 | 13F | Montag A & Associates Inc | 0 | -100.00 | 0 | |||||
| 2025-08-13 | 13F | Botty Investors LLC | 15,000 | 0.00 | 184 | -3.17 | ||||
| 2025-07-25 | 13F | Apollon Wealth Management, LLC | 16,640 | -74.99 | 204 | -75.80 | ||||
| 2025-07-03 | 13F | Sage Capital Advisors,llc | 33,586 | -14.84 | 411 | -17.30 | ||||
| 2025-08-06 | 13F | Paragon Capital Management Inc | 88,344 | -0.25 | 1,081 | -3.14 | ||||
| 2025-08-14 | 13F | Cohen & Steers, Inc. | 348,993 | 0.00 | 4 | 0.00 | ||||
| 2025-08-15 | 13F | Morgan Stanley | 3,149,726 | 5.13 | 38,553 | 2.04 | ||||
| 2025-08-19 | 13F | Newbridge Financial Services Group, Inc. | 1,750 | 21 | ||||||
| 2025-08-14 | 13F | Williams Jones Wealth Management, LLC. | 12,822 | 0.00 | 157 | -3.11 | ||||
| 2025-07-11 | 13F | Farther Finance Advisors, LLC | 7,001 | 366.73 | 86 | 372.22 | ||||
| 2025-08-04 | 13F | Spire Wealth Management | 4,000 | 0.00 | 49 | -4.00 | ||||
| 2025-08-14 | 13F | UBS Group AG | 1,019,319 | 2.13 | 12,476 | -0.87 | ||||
| 2025-04-17 | 13F | Precedent Wealth Partners, Llc | 0 | -100.00 | 0 | |||||
| 2025-08-04 | 13F | ELCO Management Co., LLC | 15,000 | 2.04 | 184 | -1.08 | ||||
| 2025-07-30 | 13F | Whittier Trust Co | 16,831 | -1.95 | 206 | -4.63 | ||||
| 2025-08-14 | 13F | Stifel Financial Corp | 744,956 | 1.66 | 9,118 | -1.32 | ||||
| 2025-07-14 | 13F | Golden State Equity Partners | 152,774 | 1.89 | 1,870 | -1.11 | ||||
| 2025-07-30 | 13F | D.a. Davidson & Co. | 230,981 | 5.30 | 2,827 | 2.21 | ||||
| 2025-08-14 | 13F | Herold Advisors, Inc. | 114,950 | 1,407 | ||||||
| 2025-07-31 | 13F | Optimum Investment Advisors | 6,010 | 0.00 | 74 | -2.67 | ||||
| 2025-07-29 | 13F | Foster & Motley Inc | 58,052 | -1.18 | 1 | |||||
| 2025-07-30 | 13F | Whittier Trust Co Of Nevada Inc | 250 | -86.90 | 3 | -87.50 | ||||
| 2025-08-14 | 13F | Evergreen Capital Management Llc | 0 | -100.00 | 0 | |||||
| 2025-07-10 | 13F | Focus Financial Network, Inc. | 22,443 | 7.58 | 275 | 4.18 | ||||
| 2025-08-14 | 13F | Hrt Financial Lp | 45,065 | 1 | ||||||
| 2025-08-04 | 13F | Assetmark, Inc | 0 | -100.00 | 0 | |||||
| 2025-08-13 | 13F | Cerity Partners LLC | 51,400 | -3.60 | 629 | -6.40 | ||||
| 2025-08-14 | 13F | Wetherby Asset Management Inc | 20,000 | -21.83 | 245 | -23.99 | ||||
| 2025-08-14 | 13F | Citadel Advisors Llc | Put | 0 | -100.00 | 0 | ||||
| 2025-08-12 | 13F | Walled Lake Planning & Wealth Management, Llc | 39,332 | 0.41 | 481 | -2.43 | ||||
| 2025-08-14 | 13F | Apriem Advisors | 22,300 | 0.00 | 273 | -3.20 | ||||
| 2025-08-15 | 13F | Tower Research Capital LLC (TRC) | 0 | -100.00 | 0 | |||||
| 2025-05-08 | 13F | Gsa Capital Partners Llp | 0 | -100.00 | 0 | |||||
| 2025-07-08 | 13F | Nbc Securities, Inc. | 53,475 | -3.66 | 1 | |||||
| 2025-08-07 | 13F | Evoke Wealth, Llc | 197,436 | 0.00 | 2,417 | -2.93 | ||||
| 2025-07-29 | 13F | Stratos Wealth Advisors, LLC | 180,033 | 208.33 | 2,204 | 199.32 | ||||
| 2025-08-14 | 13F | Ancora Advisors, LLC | 500 | 0.00 | 6 | 0.00 | ||||
| 2025-07-28 | 13F | Harbour Investments, Inc. | 2,300 | -2.62 | 28 | -3.45 | ||||
| 2025-08-05 | 13F | GPS Wealth Strategies Group, LLC | 78 | 0.00 | 1 | |||||
| 2025-07-22 | 13F | Wealthcare Advisory Partners LLC | 122,001 | -0.92 | 1,493 | -3.80 | ||||
| 2025-08-14 | 13F | Mml Investors Services, Llc | 12,287 | -0.87 | 0 | |||||
| 2025-07-29 | 13F | Activest Wealth Management | 160,551 | -3.50 | 1,965 | -6.29 | ||||
| 2025-07-28 | 13F | BRYN MAWR TRUST Co | 1,800 | 0.00 | 22 | 0.00 | ||||
| 2025-07-29 | 13F | International Assets Investment Management, Llc | 17,290 | 0.00 | 212 | -3.21 | ||||
| 2025-08-05 | 13F | Peregrine Asset Advisers, Inc. | 31,832 | 0.04 | 390 | -2.99 | ||||
| 2025-05-14 | 13F | Landscape Capital Management, L.l.c. | 0 | -100.00 | 0 | |||||
| 2025-08-14 | 13F | Jane Street Group, Llc | 17,595 | -53.16 | 215 | -54.55 | ||||
| 2025-07-14 | 13F | AdvisorNet Financial, Inc | 400 | 0.00 | 5 | -20.00 | ||||
| 2025-08-06 | 13F | Golden State Wealth Management, LLC | 40,998 | -7.30 | 502 | -10.05 | ||||
| 2025-08-05 | 13F | Shaker Financial Services, LLC | 244,126 | 206.71 | 2,988 | 197.91 | ||||
| 2025-08-13 | 13F | M Holdings Securities, Inc. | 0 | -100.00 | 0 | |||||
| 2025-08-11 | 13F | Dorsey & Whitney Trust CO LLC | 13,350 | 4.71 | 163 | 1.88 | ||||
| 2025-08-15 | 13F | Kestra Advisory Services, LLC | 119,061 | 18.49 | 1,457 | 15.00 | ||||
| 2025-08-07 | 13F | Summit X, LLC | 102,730 | -12.35 | 1,257 | -14.90 | ||||
| 2025-08-11 | 13F | Elequin Capital Lp | 39,816 | 487 | ||||||
| 2025-05-02 | 13F | Signaturefd, Llc | 0 | -100.00 | 0 | |||||
| 2025-07-17 | 13F/A | Capital Investment Advisors, LLC | 18,700 | 0.00 | 229 | -2.98 | ||||
| 2025-08-12 | 13F | Global Retirement Partners, LLC | 1,356 | 143.88 | 17 | 166.67 | ||||
| 2025-08-13 | 13F | Invesco Ltd. | 935,733 | 2.60 | 11,453 | -0.42 | ||||
| 2025-07-14 | 13F | Gridiron Partners, LLC | 19,136 | 0.00 | 234 | -2.90 | ||||
| 2025-08-12 | 13F | LPL Financial LLC | 563,553 | 6.58 | 6,898 | 3.45 | ||||
| 2025-08-12 | 13F | Calton & Associates, Inc. | 28,165 | 35.81 | 345 | -10.18 | ||||
| 2025-04-29 | 13F | Lee Danner & Bass Inc | 0 | -100.00 | 0 | |||||
| 2025-08-04 | 13F | Bay Colony Advisory Group, Inc d/b/a Bay Colony Advisors | 48,691 | 0.83 | 596 | -1.65 | ||||
| 2025-08-14 | 13F | Ameriprise Financial Inc | 678,431 | 2.66 | 8,298 | -0.43 | ||||
| 2025-08-11 | 13F | HighTower Advisors, LLC | 423,017 | 1.21 | 5,178 | -1.76 | ||||
| 2025-08-01 | 13F | Envestnet Asset Management Inc | 47,595 | 27.02 | 583 | 23.31 | ||||
| 2025-07-29 | 13F | Woodard & Co Asset Management Group Inc /adv | 10,350 | 0.00 | 127 | -3.08 | ||||
| 2025-08-08 | 13F | Avantax Advisory Services, Inc. | 13,901 | -29.48 | 170 | -31.45 | ||||
| 2025-08-12 | 13F | MAI Capital Management | 1,650 | 0.00 | 20 | 0.00 | ||||
| 2025-08-12 | 13F | NWF Advisory Services Inc. | 14,616 | 26.94 | 184 | 27.78 | ||||
| 2025-08-14 | 13F | Federation des caisses Desjardins du Quebec | 1,135 | 0.00 | 14 | -7.14 | ||||
| 2025-07-16 | 13F | Maridea Wealth Management LLC | 44,265 | 1.37 | 542 | -1.64 | ||||
| 2025-05-05 | 13F | Lindbrook Capital, Llc | 5,500 | 0.00 | 69 | 0.00 | ||||
| 2025-08-13 | 13F | Northwestern Mutual Wealth Management Co | 416 | 5 | ||||||
| 2025-08-01 | 13F | Bessemer Group Inc | 0 | -100.00 | 0 | |||||
| 2025-08-11 | 13F | Private Advisor Group, LLC | 107,267 | 2.51 | 1,313 | -0.53 | ||||
| 2025-07-25 | 13F | Atria Wealth Solutions, Inc. | 70,692 | 10.08 | 865 | 6.92 | ||||
| 2025-07-08 | 13F | Parallel Advisors, LLC | 150,542 | 28.17 | 1,843 | 24.38 | ||||
| 2025-07-14 | 13F | E&G Advisors, LP | 55,500 | -1.77 | 679 | -4.63 | ||||
| 2025-08-14 | 13F | Mercer Global Advisors Inc /adv | 12,353 | 8.08 | 151 | 7.09 | ||||
| 2025-08-14 | 13F | TCG Advisory Services, LLC | 12,200 | 149 | ||||||
| 2025-07-29 | 13F | Arcus Capital Partners, LLC | 38,609 | -25.80 | 473 | -28.05 | ||||
| 2025-08-04 | 13F | Creekmur Asset Management LLC | 15 | 0 | ||||||
| 2025-08-12 | 13F | Journey Strategic Wealth Llc | 55,550 | -35.07 | 680 | -37.01 | ||||
| 2025-08-08 | 13F | Wall Street Access Asset Management, LLC | 14,642 | 179 | ||||||
| 2025-07-11 | 13F | Grove Bank & Trust | 0 | -100.00 | 0 | |||||
| 2025-07-25 | 13F | Cypress Capital Group | 49,895 | 611 | ||||||
| 2025-08-14 | 13F/A | Rockefeller Capital Management L.P. | 53,750 | -0.92 | 658 | -3.95 | ||||
| 2025-08-26 | 13F/A | Thrivent Financial For Lutherans | 177,762 | 0.96 | 2 | 0.00 | ||||
| 2025-07-18 | 13F | SOA Wealth Advisors, LLC. | 2,035 | 0.89 | 25 | -4.00 | ||||
| 2025-08-14 | 13F | Vivaldi Capital Management, LLC | 10,100 | 0.00 | 124 | -3.15 | ||||
| 2025-07-29 | 13F | Creekside Partners | 20,303 | 0.00 | 249 | -3.12 | ||||
| 2025-07-22 | 13F | Iron Horse Wealth Management, LLC | 207 | 3 | ||||||
| 2025-07-29 | 13F | Easterly Investment Partners Llc | 40,127 | 0.00 | 491 | -2.96 | ||||
| 2025-08-06 | 13F | Penserra Capital Management LLC | 444,190 | 3.04 | 5 | 0.00 | ||||
| 2025-08-06 | 13F | Commonwealth Equity Services, Llc | 56,936 | 7.81 | 1 | |||||
| 2025-07-28 | 13F | WealthPLAN Partners, LLC | 13,575 | 0.00 | 166 | -2.92 | ||||
| 2025-04-29 | 13F | Pensionmark Financial Group, Llc | 0 | -100.00 | 0 | |||||
| 2025-07-25 | 13F | Cwm, Llc | 5,491 | 7.04 | 0 | |||||
| 2025-07-21 | 13F | Future Financial Wealth Managment LLC | 16,850 | 0.00 | 206 | -2.83 | ||||
| 2025-08-12 | 13F | Jpmorgan Chase & Co | 2,426 | -93.03 | 30 | -93.38 | ||||
| 2025-08-14 | 13F | Sequent Planning LLC | 49,156 | 30.81 | 602 | 27.06 | ||||
| 2025-08-08 | 13F | Kingsview Wealth Management, LLC | 28,250 | 0.00 | 346 | -3.09 | ||||
| 2025-07-30 | 13F | Avidian Wealth Solutions, LLC | 16,000 | 0.00 | 196 | -2.99 | ||||
| 2025-08-07 | 13F | BOK Financial Private Wealth, Inc. | 6,056 | 0.00 | 74 | -2.63 | ||||
| 2025-08-12 | 13F | Horizon Kinetics Asset Management Llc | 56,052 | -2.88 | 686 | -5.64 | ||||
| 2025-05-14 | 13F | Susquehanna International Group, Llp | 0 | -100.00 | 0 | |||||
| 2025-08-06 | 13F | Mark Sheptoff Financial Planning, Llc | 500 | 6 | ||||||
| 2025-07-18 | 13F | Institute for Wealth Management, LLC. | 25,774 | 92.07 | 315 | 86.39 | ||||
| 2025-08-14 | 13F | Integrated Wealth Concepts LLC | 26,372 | -43.12 | 323 | -44.86 | ||||
| 2025-08-14 | 13F | NCM Capital Management, LLC | 12,300 | -3.91 | 151 | -6.83 | ||||
| 2025-07-16 | 13F | St Germain D J Co Inc | 850 | 0.00 | 10 | 0.00 | ||||
| 2025-07-15 | 13F | LeConte Wealth Management, LLC | 237,396 | -77.59 | 2,906 | -78.25 | ||||
| 2025-08-14 | 13F | Group One Trading, L.p. | Put | 1,100 | -78.00 | 13 | -79.37 | |||
| 2025-08-14 | 13F | Group One Trading, L.p. | Call | 1,600 | 220.00 | 20 | 216.67 | |||
| 2025-08-12 | 13F | J.w. Cole Advisors, Inc. | 35,083 | -30.76 | 429 | -32.76 | ||||
| 2025-08-07 | 13F | Parkside Financial Bank & Trust | 0 | -100.00 | 0 | |||||
| 2025-07-11 | 13F | Seacrest Wealth Management, Llc | 15,545 | -0.85 | 190 | -3.55 | ||||
| 2025-08-13 | 13F | Baird Financial Group, Inc. | 56,469 | 691 | ||||||
| 2025-08-14 | 13F | GWM Advisors LLC | 176,543 | 1.67 | 2,161 | -1.32 | ||||
| 2025-07-28 | NP | PCEF - Invesco CEF Income Composite ETF This fund is a listed as child fund of Invesco Ltd. and if that institution has disclosed ownership in this security, then these positions will not be double counted when calculating total shares and total value | 922,844 | 3.49 | 11,351 | -1.10 | ||||
| 2025-08-14 | 13F | Two Sigma Securities, Llc | 14,986 | 183 | ||||||
| 2025-07-10 | 13F | Wealth Enhancement Advisory Services, Llc | 46,094 | -8.67 | 565 | -11.16 | ||||
| 2025-07-22 | 13F/A | Kingstone Capital Partners Texas, LLC | 15,011 | 184 | ||||||
| 2025-08-13 | 13F | McGowan Group Asset Management, Inc. | 3,225,943 | 1.12 | 39,486 | -1.84 | ||||
| 2025-08-11 | 13F | FSA Wealth Management LLC | 0 | -100.00 | 0 | |||||
| 2025-08-14 | 13F | Wells Fargo & Company/mn | 1,380,492 | 8.47 | 16,897 | 5.29 | ||||
| 2025-08-13 | 13F | Guggenheim Capital Llc | 177,830 | 44.12 | 2,177 | 39.94 | ||||
| 2025-07-08 | 13F | Next Level Private LLC | 19,644 | 2.24 | 240 | -0.83 | ||||
| 2025-08-12 | 13F | Steward Partners Investment Advisory, Llc | 3,607 | 0.00 | 44 | -2.22 | ||||
| 2025-07-07 | 13F | Nova Wealth Management, Inc. | 3,350 | 0.00 | 41 | -2.38 | ||||
| 2025-08-07 | 13F | Allworth Financial LP | 7,652 | 361.52 | 94 | 389.47 | ||||
| 2025-08-13 | 13F | First Trust Advisors Lp | 94,730 | -0.96 | 1,159 | -3.90 | ||||
| 2025-08-14 | 13F | Cura Wealth Advisors, Llc | 21,910 | 0.00 | 268 | -2.90 | ||||
| 2025-07-30 | 13F | Journey Advisory Group, LLC | 227,512 | 0.27 | 2,785 | -2.69 | ||||
| 2025-05-06 | 13F | Ghe, Llc | 38,200 | 0.00 | 0 | |||||
| 2025-08-08 | 13F | Pnc Financial Services Group, Inc. | 5,845 | 0.00 | 72 | -2.74 | ||||
| 2025-08-14 | 13F | Comerica Bank | 11,757 | -57.27 | 144 | -58.67 | ||||
| 2025-07-18 | 13F | Consolidated Portfolio Review Corp | 108,535 | -10.56 | 1,328 | -13.20 | ||||
| 2025-08-18 | 13F/A | National Bank Of Canada /fi/ | 107,657 | 11.66 | 1,314 | 8.15 | ||||
| 2025-08-15 | 13F | Equitable Holdings, Inc. | 37,273 | 0.02 | 456 | -2.77 | ||||
| 2025-08-14 | 13F | Matrix Private Capital Group Llc | 130,210 | 0.37 | 1,594 | -2.57 | ||||
| 2025-08-14 | 13F | Bank Of America Corp /de/ | 428,118 | 4.05 | 5,240 | 1.00 | ||||
| 2025-07-15 | 13F | World Equity Group, Inc. | 13,830 | 16.91 | 169 | 13.42 | ||||
| 2025-08-12 | 13F | Left Brain Wealth Management, LLC | 40,550 | 18.86 | 496 | 15.35 | ||||
| 2025-08-14 | 13F | Mariner, LLC | 44,146 | 2.23 | 540 | -0.74 | ||||
| 2025-08-12 | 13F | SRS Capital Advisors, Inc. | 1,800 | 22 | ||||||
| 2025-08-14 | 13F | Raymond James Financial Inc | 630,032 | 0.13 | 7,712 | -2.81 | ||||
| 2025-07-17 | 13F | Sound Income Strategies, LLC | 1 | 0.00 | 0 | |||||
| 2025-04-30 | 13F | Ramiah Investment Group | 57,906 | 54.10 | 730 | 59.04 | ||||
| 2025-07-25 | 13F | Concurrent Investment Advisors, LLC | 116,886 | 7.16 | 1,431 | 4.00 | ||||
| 2025-08-12 | 13F | Proequities, Inc. | Put | 0 | 0 | |||||
| 2025-08-12 | 13F | Proequities, Inc. | Call | 0 | 0 | |||||
| 2025-08-12 | 13F | Proequities, Inc. | 0 | 0 | ||||||
| 2025-04-22 | 13F | Synergy Financial Management, LLC | 0 | -100.00 | 0 | |||||
| 2025-08-07 | 13F | Hennion & Walsh Asset Management, Inc. | 0 | -100.00 | 0 | |||||
| 2025-08-12 | 13F | Financial Advocates Investment Management | 0 | -100.00 | 0 | |||||
| 2025-04-25 | 13F | Smallwood Wealth Investment Management, LLC | 333 | 4 | ||||||
| 2025-07-17 | 13F | Janney Montgomery Scott LLC | 282,852 | 6.21 | 3 | 0.00 | ||||
| 2025-04-29 | 13F | Raleigh Capital Management Inc. | 0 | -100.00 | 0 | -100.00 | ||||
| 2025-07-11 | 13F | SILVER OAK SECURITIES, Inc | 28,998 | 1.27 | 355 | -1.12 | ||||
| 2025-08-08 | 13F | Schwarz Dygos Wheeler Investment Advisors Llc | 108,346 | 6.04 | 1,326 | 2.95 | ||||
| 2025-08-11 | 13F | Alteri Wealth LLC | 19,121 | -1.19 | 234 | -4.10 | ||||
| 2025-07-28 | 13F | RFG Advisory, LLC | 12,200 | -7.58 | 149 | -10.24 | ||||
| 2025-07-21 | 13F | Trinity Legacy Partners, LLC | 296,789 | 1.50 | 3,576 | -0.39 | ||||
| 2025-07-31 | 13F/A | Avion Wealth | 501 | 0.00 | 0 | |||||
| 2025-07-21 | 13F | Ameritas Advisory Services, LLC | 5,700 | 70 | ||||||
| 2025-08-13 | 13F | Natixis | 3,381 | -33.16 | 41 | -34.92 | ||||
| 2025-08-28 | NP | YYY - Amplify High Income ETF | 439,670 | 1.99 | 5,382 | -0.99 | ||||
| 2025-05-15 | 13F | Talon Private Wealth, LLC | 0 | -100.00 | 0 | -100.00 | ||||
| 2025-08-13 | 13F | Fort Sheridan Advisors Llc | 97,442 | -29.09 | 1,193 | -31.18 | ||||
| 2025-07-14 | 13F | Armstrong Advisory Group, Inc | 0 | -100.00 | 0 | |||||
| 2025-08-08 | 13F | Larson Financial Group LLC | 1,984 | 0.00 | 24 | -4.00 | ||||
| 2025-08-28 | NP | FFBYX - First Foundation Fixed Income Fund Class Y | 9,193 | 0.00 | 113 | -2.61 | ||||
| 2025-08-15 | 13F | Captrust Financial Advisors | 39,056 | 478 | ||||||
| 2025-05-12 | 13F | Fmr Llc | 0 | -100.00 | 0 | |||||
| 2025-07-15 | 13F | Fifth Third Bancorp | 173 | 0.00 | 2 | 0.00 | ||||
| 2025-05-05 | 13F | Transce3nd, LLC | 0 | -100.00 | 0 | |||||
| 2025-07-21 | 13F | Ameriflex Group, Inc. | 1,437 | 1.84 | 18 | 0.00 | ||||
| 2025-08-14 | 13F | Balyasny Asset Management Llc | 21,016 | 257 | ||||||
| 2025-07-18 | 13F | Parkside Investments, LLC | 0 | -100.00 | 0 | |||||
| 2025-07-18 | 13F | PFG Investments, LLC | 13,874 | 18.21 | 170 | 14.19 | ||||
| 2025-07-15 | 13F | Financial Management Professionals, Inc. | 1,686 | 2.74 | 21 | 0.00 | ||||
| 2025-08-14 | 13F | Pinnacle Family Advisors, LLC | 10,334 | 126 | ||||||
| 2025-08-01 | 13F | Transcend Wealth Collective, Llc | 0 | -100.00 | 0 | |||||
| 2025-08-06 | 13F | North Capital, Inc. | 360 | 0.00 | 4 | 0.00 | ||||
| 2025-08-05 | 13F | Intellectus Partners, LLC | 442,278 | -1.27 | 5,413 | -4.16 | ||||
| 2025-08-04 | 13F | Kovack Advisors, Inc. | 15,700 | 16.64 | 192 | 13.61 | ||||
| 2025-08-14 | 13F | CoreCap Advisors, LLC | 2,950 | 68.57 | 36 | 63.64 | ||||
| 2025-04-16 | 13F | Fortitude Family Office, LLC | 0 | -100.00 | 0 | -100.00 | ||||
| 2025-08-19 | 13F | National Asset Management, Inc. | 0 | -100.00 | 0 | |||||
| 2025-08-14 | 13F | Warren Averett Asset Management, LLC | 0 | -100.00 | 0 | |||||
| 2025-07-25 | 13F | We Are One Seven, LLC | 59,817 | 732 | ||||||
| 2025-07-31 | 13F | Cambridge Investment Research Advisors, Inc. | 591,707 | -26.76 | 7 | -30.00 | ||||
| 2025-08-05 | 13F | Westside Investment Management, Inc. | 1,000 | 0.00 | 12 | 0.00 | ||||
| 2025-08-05 | 13F | Simplex Trading, Llc | Put | 2,200 | 450.00 | 0 | ||||
| 2025-08-05 | 13F | Simplex Trading, Llc | Call | 14,600 | 40.38 | 0 | ||||
| 2025-08-13 | 13F | Lido Advisors, LLC | 14,303 | 30.39 | 175 | 26.81 | ||||
| 2025-08-18 | 13F | Geneos Wealth Management Inc. | 2,670 | 0.00 | 33 | -3.03 | ||||
| 2025-08-06 | 13F | Wedbush Securities Inc | 72,385 | -2.66 | 1 | |||||
| 2025-05-15 | 13F | Prospera Financial Services Inc | 0 | -100.00 | 0 | |||||
| 2025-08-08 | 13F | Fiera Capital Corp | 83,264 | -0.93 | 1,019 | -3.78 | ||||
| 2025-07-10 | 13F | Sovran Advisors, LLC | 86,918 | -3.64 | 1,055 | 0.19 | ||||
| 2025-05-16 | 13F | Coppell Advisory Solutions LLC | 0 | -100.00 | 0 | |||||
| 2025-08-14 | 13F | Royal Bank Of Canada | 607,965 | 3.18 | 7,441 | 0.13 | ||||
| 2025-07-11 | 13F | Bell Bank | 13,656 | 0.00 | 167 | -2.91 | ||||
| 2025-09-04 | 13F/A | Advisor Group Holdings, Inc. | 144,406 | 1.30 | 1,768 | -1.67 | ||||
| 2025-07-24 | 13F | IFP Advisors, Inc | 499 | 110.55 | 6 | 200.00 | ||||
| 2025-08-14 | 13F | Citadel Advisors Llc | Call | 18,600 | 1,228.57 | 228 | 1,235.29 | |||
| 2025-08-14 | 13F | Citadel Advisors Llc | 15,839 | 303.75 | 194 | 293.88 | ||||
| 2025-06-12 | 13F/A | Deutsche Bank Ag\ | 0 | -100.00 | 0 | |||||
| 2025-08-08 | 13F | Cetera Investment Advisers | 223,740 | 4.72 | 2,739 | 1.63 | ||||
| 2025-05-09 | 13F | NewEdge Wealth, LLC | 0 | -100.00 | 0 | |||||
| 2025-08-14 | 13F | Arete Wealth Advisors, LLC | 17,814 | -23.21 | 0 | |||||
| 2025-05-14 | 13F | Van Hulzen Asset Management, LLC | 0 | -100.00 | 0 | |||||
| 2025-05-15 | 13F | Concorde Asset Management, LLC | 26,600 | 3.91 | 314 | -2.18 | ||||
| 2025-08-07 | 13F | Readystate Asset Management Lp | 81,169 | 304.17 | 994 | 292.49 |