Mga Batayang Estadistika
| Pemilik Institusional | 203 total, 203 long only, 0 short only, 0 long/short - change of 0.49% MRQ |
| Alokasi Portofolio Rata-rata | 0.1383 % - change of -23.78% MRQ |
| Saham Institusional (Jangka Panjang) | 9,812,783 (ex 13D/G) - change of -0.42MM shares -4.11% MRQ |
| Nilai Institusional (Jangka Panjang) | $ 734,408 USD ($1000) |
Kepemilikan Institusional dan Pemegang Saham
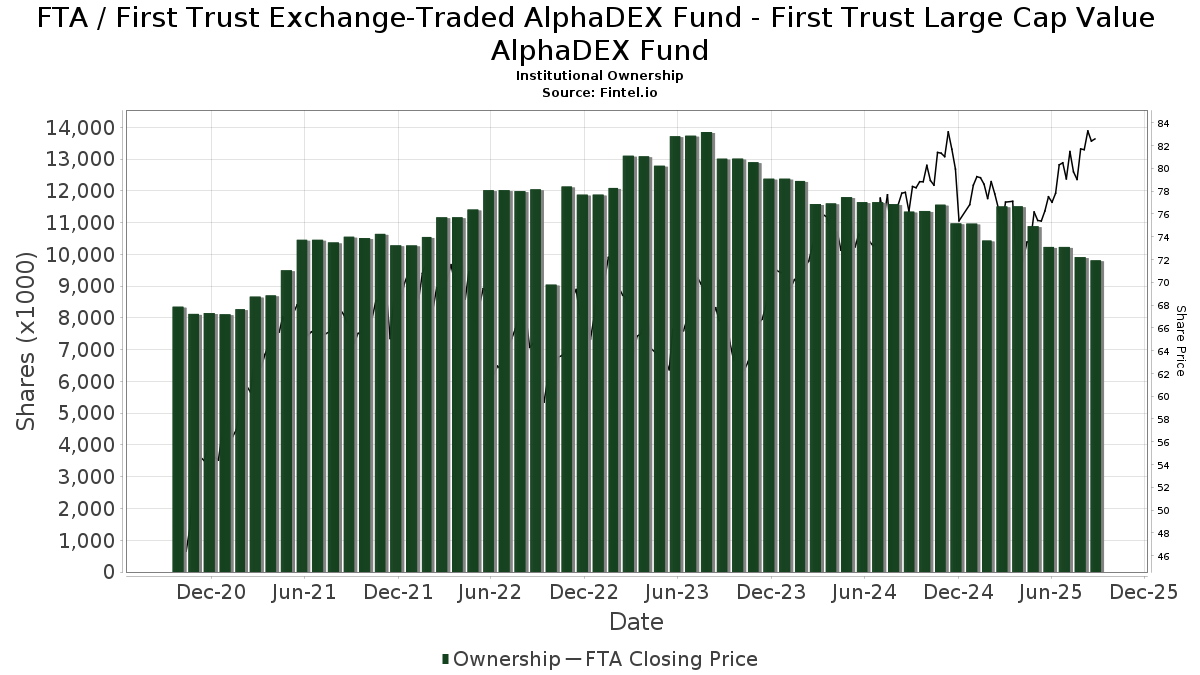
First Trust Exchange-Traded AlphaDEX Fund - First Trust Large Cap Value AlphaDEX Fund (US:FTA) memiliki 203 pemilik institusional dan pemegang saham yang telah mengajukan formulir 13D/G atau 13F kepada Komisi Bursa Efek (Securities Exchange Commission/SEC). Lembaga-lembaga ini memegang total 9,812,783 saham. Pemegang saham terbesar meliputi Morgan Stanley, UBS Group AG, LPL Financial LLC, Envestnet Asset Management Inc, Bank Of America Corp /de/, Cetera Investment Advisers, Raymond James Financial Inc, Royal Bank Of Canada, IHT Wealth Management, LLC, and Wells Fargo & Company/mn .
Struktur kepemilikan institusional First Trust Exchange-Traded AlphaDEX Fund - First Trust Large Cap Value AlphaDEX Fund (NasdaqGM:FTA) menunjukkan posisi terkini di perusahaan oleh institusi dan dana, serta perubahan terbaru dalam ukuran posisi. Pemegang saham utama dapat mencakup investor individu, reksa dana, dana lindung nilai, atau institusi. Jadwal 13D menunjukkan bahwa investor memegang (atau pernah memegang) lebih dari 5% saham perusahaan dan bermaksud (atau pernah bermaksud) untuk secara aktif mengejar perubahan strategi bisnis. Jadwal 13G menunjukkan investasi pasif lebih dari 5%.
The share price as of September 5, 2025 is 83.14 / share. Previously, on September 6, 2024, the share price was 76.45 / share. This represents an increase of 8.76% over that period.
Skor Sentimen Dana
Skor Sentimen Dana (sebelumnya dikenal sebagai Skor Akumulasi Kepemilikan) menemukan saham-saham yang paling banyak dibeli oleh dana. Ini adalah hasil dari model kuantitatif multi-faktor yang canggih yang mengidentifikasi perusahaan dengan tingkat akumulasi institusional tertinggi. Model penilaian menggunakan kombinasi dari total peningkatan pemilik yang diungkapkan, perubahan dalam alokasi portofolio pada pemilik tersebut, dan metrik lainnya. Angka berkisar dari 0 hingga 100, dengan angka yang lebih tinggi menunjukkan tingkat akumulasi yang lebih tinggi dibandingkan dengan perusahaan sejenisnya, dan 50 adalah rata-ratanya.
Frekuensi Pembaruan: Setiap Hari
Lihat Ownership Explorer, yang menyediakan daftar perusahaan dengan peringkat tertinggi.
Rasio Put/Call Institusional
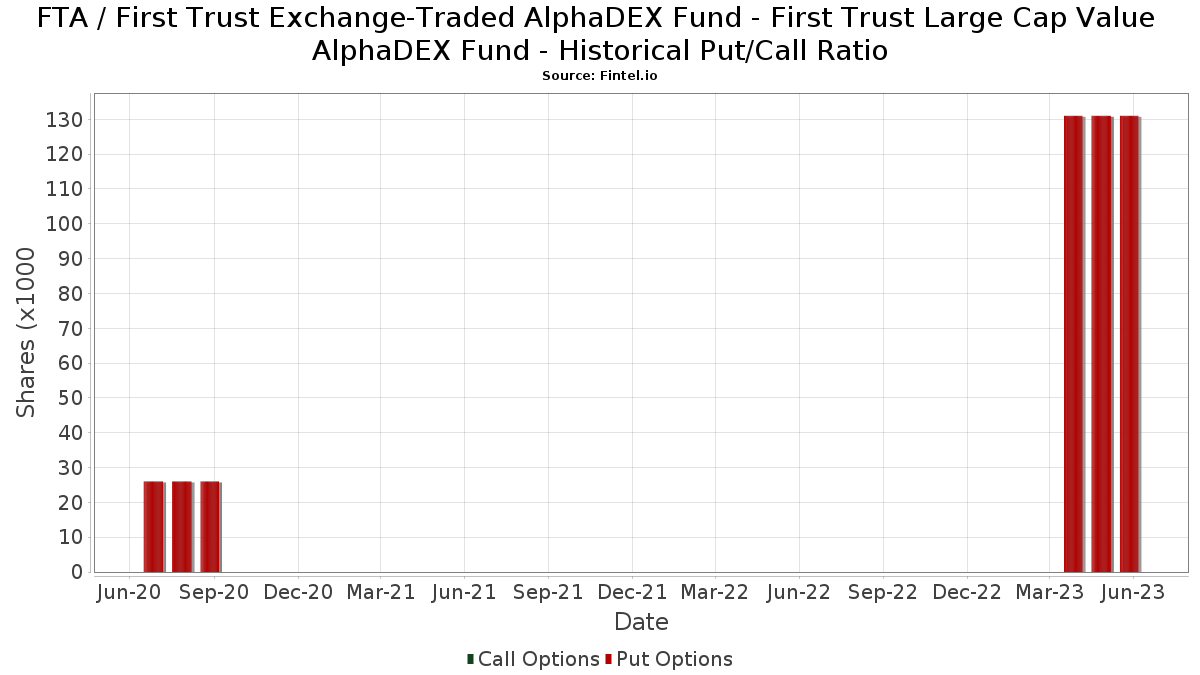
Selain melaporkan isu ekuitas dan utang standar, institusi dengan aset di bawah manajemen lebih dari 100 juta dolar AS juga harus mengungkapkan kepemilikan opsi put dan call mereka. Karena opsi put umumnya menunjukkan sentimen negatif, dan opsi call menunjukkan sentimen positif, kita dapat mengetahui sentimen institusional secara keseluruhan dengan memplot rasio put terhadap call. Grafik di sebelah kanan memplot rasio put/call historis untuk instrumen ini.
Menggunakan Rasio Put/Call sebagai indikator sentimen investor mengatasi salah satu kekurangan utama dari penggunaan total kepemilikan institusional, yaitu sejumlah besar aset yang dikelola diinvestasikan secara pasif untuk melacak indeks. Dana yang dikelola secara pasif biasanya tidak membeli opsi, sehingga indikator rasio put/call lebih akurat dalam melacak sentimen dana yang dikelola secara aktif.
Pengajuan 13F dan NPORT
Detail pada pengajuan 13F tersedia gratis. Detail pada pengajuan NP memerlukan keanggotaan premium. Baris berwarna hijau menunjukkan posisi baru. Baris berwarna merah menunjukkan posisi yang sudah ditutup. Klik tautan ini ikon untuk melihat riwayat transaksi selengkapnya.
Tingkatkan
untuk membuka data premium dan mengekspor ke Excel ![]() .
.
| Tanggal File | Sumber | Investor | Ketik | Presyo ng Avg (Silangan) |
Saham | Δ Saham (%) |
Dilaporkan Nilai ($1000) |
Nilai Δ (%) |
Alokasi Port (%) |
|
|---|---|---|---|---|---|---|---|---|---|---|
| 2025-08-08 | 13F | Smithfield Trust Co | 600 | 0.00 | 0 | |||||
| 2025-07-29 | 13F | Empirical Asset Management, LLC | 2,558 | 201 | ||||||
| 2025-07-10 | 13F | Secure Asset Management, LLC | 0 | -100.00 | 0 | |||||
| 2025-08-06 | 13F | Wedbush Securities Inc | 3,026 | 0.00 | 0 | |||||
| 2025-08-06 | 13F | Commonwealth Equity Services, Llc | 153,141 | -2.87 | 12 | 0.00 | ||||
| 2025-08-14 | 13F | Goldman Sachs Group Inc | 100,072 | -5.34 | 7,869 | -2.98 | ||||
| 2025-07-23 | 13F | Meitav Dash Investments Ltd | 7,550 | 0.00 | 594 | 2.42 | ||||
| 2025-07-17 | 13F | Sound Income Strategies, LLC | 0 | 0 | ||||||
| 2025-07-29 | 13F | Kraft, Davis & Associates, LLC | 5,131 | 0.00 | 414 | 13.15 | ||||
| 2025-08-13 | 13F | Baird Financial Group, Inc. | 31,020 | 211.63 | 2,439 | 219.66 | ||||
| 2025-08-05 | 13F | American Institute for Advanced Investment Management, LLP | 6,260 | -12.39 | 492 | -10.22 | ||||
| 2025-08-11 | 13F | Citigroup Inc | 227 | 0.00 | 18 | 0.00 | ||||
| 2025-08-08 | 13F | WealthTrust Asset Management, LLC | 2,849 | -32.73 | 224 | -30.86 | ||||
| 2025-04-10 | 13F | TrueWealth Advisors, LLC | 0 | -100.00 | 0 | -100.00 | ||||
| 2025-08-12 | 13F | Financial Advocates Investment Management | 0 | -100.00 | 0 | |||||
| 2025-08-29 | 13F | Centaurus Financial, Inc. | 1,621 | 0.06 | 0 | |||||
| 2025-08-11 | 13F | Principal Securities, Inc. | 3,911 | -7.10 | 308 | -4.36 | ||||
| 2025-08-07 | 13F | PFG Advisors | 16,518 | -29.41 | 1,299 | -27.69 | ||||
| 2025-07-28 | 13F | RFG Advisory, LLC | 8,183 | -0.94 | 643 | 1.58 | ||||
| 2025-07-09 | 13F | Keystone Wealth Services, LLC | 10,476 | 0.01 | 824 | 2.49 | ||||
| 2025-08-08 | 13F | Larson Financial Group LLC | 480 | 0.00 | 38 | 2.78 | ||||
| 2025-05-15 | 13F/A | Orion Portfolio Solutions, LLC | 24,695 | -0.94 | 1,895 | -0.63 | ||||
| 2025-08-12 | 13F | OneAscent Financial Services LLC | 22,354 | 5.84 | 2 | 0.00 | ||||
| 2025-07-15 | 13F | Main Street Group, LTD | 360 | 0.00 | 28 | 3.70 | ||||
| 2025-07-30 | 13F/A | KPP Advisory Services LLC | 4,186 | 0.00 | 329 | 2.49 | ||||
| 2025-07-29 | 13F | Koshinski Asset Management, Inc. | 3,003 | 0.13 | 236 | 2.61 | ||||
| 2025-08-15 | 13F | Fsb Premier Wealth Management, Inc. | 23,274 | -13.69 | 1,830 | -11.51 | ||||
| 2025-08-04 | 13F | Atria Investments Llc | 42,769 | 6.15 | 3,363 | 8.77 | ||||
| 2025-04-29 | 13F | Resources Investment Advisors, LLC. | 0 | -100.00 | 0 | |||||
| 2025-08-14 | 13F | Integrated Wealth Concepts LLC | 201,948 | 0.31 | 15,879 | 2.81 | ||||
| 2025-05-05 | 13F | PCA Investment Advisory Services Inc. | 0 | -100.00 | 0 | |||||
| 2025-08-14 | 13F | IHT Wealth Management, LLC | 240,535 | -18.82 | 18,913 | -16.80 | ||||
| 2025-08-07 | 13F | Blackhawk Capital Partners LLC. | 9,736 | -5.69 | 766 | -3.29 | ||||
| 2025-07-17 | 13F | Janney Montgomery Scott LLC | 69,398 | -3.52 | 5 | 0.00 | ||||
| 2025-08-13 | 13F | Northwestern Mutual Wealth Management Co | 7,089 | -12.04 | 557 | -9.87 | ||||
| 2025-08-08 | 13F | 1776 Wealth LLC | 5,117 | 0.00 | 402 | 2.55 | ||||
| 2025-09-04 | 13F/A | Advisor Group Holdings, Inc. | 153,411 | 4.29 | 12,057 | 6.80 | ||||
| 2025-08-05 | 13F | Dunhill Financial, LLC | 217 | 17 | ||||||
| 2025-07-17 | 13F | City Holding Co | 165 | 0.00 | 13 | 0.00 | ||||
| 2025-08-14 | 13F | Mariner, LLC | 6,255 | 10.26 | 492 | 12.87 | ||||
| 2025-07-16 | 13F | Midwest Heritage Bank, FSB | 60,771 | -17.64 | 4,778 | -15.60 | ||||
| 2025-08-06 | 13F | Paladin Advisory Group, LLC | 46 | 4 | ||||||
| 2025-04-29 | 13F | Strategic Blueprint, LLC | 0 | -100.00 | 0 | |||||
| 2025-05-12 | 13F | Independent Advisor Alliance | 0 | -100.00 | 0 | |||||
| 2025-04-23 | 13F | Saxony Capital Management, LLC | 0 | -100.00 | 0 | -100.00 | ||||
| 2025-08-04 | 13F | Daymark Wealth Partners, Llc | 3,774 | 297 | ||||||
| 2025-08-14 | 13F | Comerica Bank | 8,832 | -0.06 | 694 | 2.51 | ||||
| 2025-08-18 | 13F | Geneos Wealth Management Inc. | 300 | -3.54 | 24 | 0.00 | ||||
| 2025-08-12 | 13F | LPL Financial LLC | 872,484 | 0.91 | 68,603 | 3.42 | ||||
| 2025-07-11 | 13F | Pinnacle Bancorp, Inc. | 963 | 0.00 | 76 | 2.74 | ||||
| 2025-08-06 | 13F | RFG - Bristol Wealth Advisors, LLC | 0 | -100.00 | 0 | |||||
| 2025-08-07 | 13F | Kestra Private Wealth Services, Llc | 43,782 | 0.43 | 3,443 | 2.93 | ||||
| 2025-08-11 | 13F | Western Wealth Management, LLC | 15,003 | -4.29 | 1,180 | -1.91 | ||||
| 2025-08-12 | 13F | SRS Capital Advisors, Inc. | 124 | -39.22 | 10 | -40.00 | ||||
| 2025-08-01 | 13F | Ashton Thomas Private Wealth, LLC | 4,301 | 2.43 | 338 | 4.97 | ||||
| 2025-08-19 | 13F | Newbridge Financial Services Group, Inc. | 2,695 | 212 | ||||||
| 2025-07-01 | 13F | Private Client Services, Llc | 3,778 | -3.75 | 297 | -1.33 | ||||
| 2025-08-14 | 13F | Mpwm Advisory Solutions, Llc | 9,633 | 1,249.16 | 757 | 1,301.85 | ||||
| 2025-08-15 | 13F | Kestra Advisory Services, LLC | 20,489 | 6.23 | 1,611 | 8.92 | ||||
| 2025-07-14 | 13F | GAMMA Investing LLC | 563 | -8.90 | 44 | -6.38 | ||||
| 2025-07-14 | 13F | Park Avenue Securities Llc | 21,363 | -1.46 | 2 | 0.00 | ||||
| 2025-07-31 | 13F | Oppenheimer & Co Inc | 7,741 | -0.67 | 609 | 1.84 | ||||
| 2025-08-05 | 13F | Sigma Planning Corp | 9,615 | -55.83 | 756 | -54.73 | ||||
| 2025-08-04 | 13F | Arkadios Wealth Advisors | 14,912 | -61.71 | 1,173 | -60.76 | ||||
| 2025-05-14 | 13F | Jane Street Group, Llc | 0 | -100.00 | 0 | |||||
| 2025-08-08 | 13F | Pnc Financial Services Group, Inc. | 10,409 | -7.21 | 818 | -4.88 | ||||
| 2025-08-14 | 13F | Fmr Llc | 4,088 | 22.91 | 321 | 25.88 | ||||
| 2025-05-16 | 13F/A | Kestra Investment Management, LLC | 0 | -100.00 | 0 | |||||
| 2025-08-11 | 13F | Regal Investment Advisors LLC | 29,523 | -3.98 | 2,321 | -1.57 | ||||
| 2025-08-12 | 13F | Steward Partners Investment Advisory, Llc | 8,264 | -6.37 | 650 | -4.14 | ||||
| 2025-08-13 | 13F | GeoWealth Management, LLC | 2,900 | 12.01 | 228 | 15.15 | ||||
| 2025-04-14 | 13F | City Center Advisors, LLC | 0 | -100.00 | 0 | |||||
| 2025-08-01 | 13F | Envestnet Asset Management Inc | 415,281 | -1.56 | 32,654 | 0.89 | ||||
| 2025-07-28 | 13F | Mutual Advisors, LLC | 7,436 | 0.57 | 604 | 11.87 | ||||
| 2025-08-04 | 13F/A | 626 Financial, LLC | 2,645 | 0.00 | 208 | 2.48 | ||||
| 2025-07-15 | 13F | Traction Financial Partners, LLC | 5,783 | 455 | ||||||
| 2025-08-14 | 13F | Snowden Capital Advisors LLC | 54,385 | -1.31 | 4,276 | 1.16 | ||||
| 2025-08-04 | 13F | Hantz Financial Services, Inc. | 267 | 0 | ||||||
| 2025-08-13 | 13F | Virtue Capital Management, LLC | 0 | -100.00 | 0 | |||||
| 2025-08-14 | 13F | GWM Advisors LLC | 25,983 | 2.30 | 2,043 | 4.88 | ||||
| 2025-08-18 | 13F | Tyler-Stone Wealth Management | 7,008 | 0.01 | 551 | 2.61 | ||||
| 2025-08-13 | 13F | Cresset Asset Management, LLC | 2,648 | 208 | ||||||
| 2025-07-29 | 13F | International Assets Investment Management, Llc | 3,087 | -8.86 | 243 | -6.56 | ||||
| 2025-07-15 | 13F | Armis Advisers, LLC | 3,523 | -21.85 | 277 | -20.00 | ||||
| 2025-07-21 | 13F | Ameritas Advisory Services, LLC | 199 | 16 | ||||||
| 2025-07-25 | 13F | Envestnet Portfolio Solutions, Inc. | 9,698 | -64.58 | 763 | -63.71 | ||||
| 2025-07-29 | 13F | Cottonwood Capital Advisors, Llc | 60,935 | -1.65 | 4,791 | 0.80 | ||||
| 2025-08-05 | 13F | Key FInancial Inc | 46 | 0.00 | 4 | 0.00 | ||||
| 2025-07-17 | 13F | Northwest Wealth Management, Llc | 2,836 | 0.00 | 223 | 2.30 | ||||
| 2025-07-31 | 13F | Cambridge Investment Research Advisors, Inc. | 137,099 | 22.81 | 11 | 25.00 | ||||
| 2025-07-23 | 13F | REAP Financial Group, LLC | 3,087 | -26.90 | 243 | -25.08 | ||||
| 2025-07-15 | 13F | FLP Wealth Management, LLC | 0 | -100.00 | 0 | |||||
| 2025-04-23 | 13F | Walkner Condon Financial Advisors LLC | 0 | -100.00 | 0 | |||||
| 2025-08-14 | 13F/A | Skopos Labs, Inc. | 265 | 21 | ||||||
| 2025-08-01 | 13F | Winebrenner Capital Management Llc | 12,911 | -0.20 | 1,015 | 2.32 | ||||
| 2025-07-28 | 13F | Triton Wealth Management, PLLC | 23,681 | -0.96 | 1,914 | -1.69 | ||||
| 2025-05-15 | 13F | Advisory Services Network, LLC | 0 | -100.00 | 0 | |||||
| 2025-07-29 | 13F | Signature Estate & Investment Advisors Llc | 0 | -100.00 | 0 | |||||
| 2025-08-14 | 13F | Sequent Planning LLC | 2,934 | -2.75 | 231 | -0.43 | ||||
| 2025-04-22 | 13F | LVZ Advisors, Inc. | 0 | -100.00 | 0 | |||||
| 2025-08-13 | 13F | Luminist Capital LLC | 211 | 0.00 | 17 | 0.00 | ||||
| 2025-08-12 | 13F | O'shaughnessy Asset Management, Llc | 690 | 54 | ||||||
| 2025-08-12 | 13F | Jpmorgan Chase & Co | 20,478 | -2.86 | 1,610 | -0.43 | ||||
| 2025-08-14 | 13F | Stifel Financial Corp | 56,462 | 5.67 | 4,440 | 8.29 | ||||
| 2025-08-29 | 13F | Total Investment Management Inc | 1,126 | 89 | ||||||
| 2025-07-25 | 13F | Apollon Wealth Management, LLC | 4,549 | 4.02 | 358 | 6.57 | ||||
| 2025-08-05 | 13F | GPS Wealth Strategies Group, LLC | 1,037 | 0.29 | 82 | 2.53 | ||||
| 2025-07-22 | 13F | Wealthcare Advisory Partners LLC | 3,562 | -0.34 | 280 | 2.19 | ||||
| 2025-08-07 | 13F | Allworth Financial LP | 9,025 | -5.56 | 710 | 1.29 | ||||
| 2025-08-14 | 13F | Great Valley Advisor Group, Inc. | 11,322 | 13.87 | 891 | 16.80 | ||||
| 2025-07-29 | 13F | Stratos Wealth Partners, LTD. | 14,660 | 1.47 | 1,153 | 3.97 | ||||
| 2025-07-08 | 13F | Nbc Securities, Inc. | 2,364 | -74.63 | 0 | |||||
| 2025-07-21 | 13F | Hilltop National Bank | 1,037 | 0.00 | 82 | 2.53 | ||||
| 2025-08-15 | 13F | Tower Research Capital LLC (TRC) | 7 | -99.92 | 1 | -100.00 | ||||
| 2025-08-13 | 13F | Transce3nd, LLC | 117 | -12.03 | 9 | -10.00 | ||||
| 2025-08-14 | 13F | Raymond James Financial Inc | 285,318 | -4.81 | 22,435 | -2.44 | ||||
| 2025-08-08 | 13F | Creative Planning | 43,332 | -54.33 | 3,407 | -53.19 | ||||
| 2025-07-14 | 13F | Iams Wealth Management, Llc | 35,387 | 5.15 | 2,783 | 7.79 | ||||
| 2025-08-13 | 13F | Elios Financial Group Inc. | 5,027 | 0.12 | 395 | 2.60 | ||||
| 2025-08-27 | 13F/A | Brinker Capital Investments, LLC | 23,537 | -4.69 | 1,851 | -2.32 | ||||
| 2025-08-05 | 13F | EPG Wealth Management LLC | 0 | -100.00 | 0 | |||||
| 2025-08-14 | 13F | Wiley Bros.-aintree Capital, Llc | 2,666 | -0.60 | 210 | 2.96 | ||||
| 2025-08-14 | 13F | Ancora Advisors, LLC | 207 | 0.00 | 16 | 6.67 | ||||
| 2025-07-23 | 13F | Morey & Quinn Wealth Partners, LLC | 7,650 | 0.00 | 602 | 2.56 | ||||
| 2025-07-29 | 13F | Chicago Partners Investment Group LLC | 14,916 | -3.36 | 1,215 | 6.95 | ||||
| 2025-08-06 | 13F | Golden State Wealth Management, LLC | 898 | 0.00 | 71 | 2.94 | ||||
| 2025-08-11 | 13F | Avantax Planning Partners, Inc. | 2,855 | 0.00 | 224 | 2.28 | ||||
| 2025-07-30 | 13F | D.a. Davidson & Co. | 38,126 | -1.71 | 2,998 | 0.74 | ||||
| 2025-08-08 | 13F | Kingsview Wealth Management, LLC | 199,588 | -1.85 | 15,694 | 0.59 | ||||
| 2025-07-25 | 13F | Cwm, Llc | 1,492 | 27.20 | 0 | |||||
| 2025-07-22 | 13F | DAVENPORT & Co LLC | 5,328 | -22.99 | 419 | -21.13 | ||||
| 2025-08-12 | 13F | Global Retirement Partners, LLC | 9,824 | -15.24 | 772 | -12.87 | ||||
| 2025-07-24 | 13F | Blair William & Co/il | 4,127 | -61.18 | 324 | -60.25 | ||||
| 2025-08-14 | 13F | Citadel Advisors Llc | 3,774 | -85.40 | 297 | -85.07 | ||||
| 2025-08-12 | 13F | Clearwater Capital Advisors, LLC | 6,578 | -0.12 | 517 | 2.38 | ||||
| 2025-08-08 | 13F | Cetera Investment Advisers | 292,810 | -2.32 | 23,024 | 0.11 | ||||
| 2025-08-12 | 13F | Proequities, Inc. | 0 | 0 | ||||||
| 2025-07-18 | 13F | Truist Financial Corp | 83,435 | -4.85 | 6,560 | -2.48 | ||||
| 2025-08-14 | 13F | MGB Wealth Management, LLC | 5,633 | 0.04 | 443 | 2.31 | ||||
| 2025-07-07 | 13F | Wesbanco Bank Inc | 3,284 | 0.00 | 258 | 2.79 | ||||
| 2025-07-09 | 13F | Key Client Fiduciary Advisors, LLC | 2,800 | -22.22 | 220 | -20.29 | ||||
| 2025-07-14 | 13F | ABLE Financial Group, LLC | 3,688 | -35.61 | 290 | -34.17 | ||||
| 2025-08-06 | 13F | Prospera Financial Services Inc | 37,953 | 0.20 | 2,984 | 2.68 | ||||
| 2025-08-14 | 13F | Sunbelt Securities, Inc. | 769 | 107.84 | 59 | 107.14 | ||||
| 2025-07-25 | 13F | Atria Wealth Solutions, Inc. | 2,766 | -87.09 | 217 | -86.80 | ||||
| 2025-04-24 | 13F | Transcend Wealth Collective, Llc | 0 | -100.00 | 0 | |||||
| 2025-08-14 | 13F | CoreCap Advisors, LLC | 153 | 0.00 | 12 | 9.09 | ||||
| 2025-08-14 | 13F | Benjamin Edwards Inc | 80,780 | 23.85 | 6,352 | 26.94 | ||||
| 2025-07-28 | 13F | RMR Capital Management, LLC | 11,729 | -39.63 | 922 | -38.12 | ||||
| 2025-08-12 | 13F | Gladstone Institutional Advisory LLC | 5,794 | 0.14 | 456 | 2.71 | ||||
| 2025-07-31 | 13F | Moloney Securities Asset Management, LLC | 2,563 | -9.27 | 202 | -6.94 | ||||
| 2025-08-06 | 13F | Vestmark Advisory Solutions, Inc. | 202,848 | 78.88 | 15,950 | 83.34 | ||||
| 2025-07-24 | 13F | IFP Advisors, Inc | 38,692 | -4.08 | 3,042 | -1.68 | ||||
| 2025-08-13 | 13F | StoneX Group Inc. | 16,623 | -11.13 | 1,307 | -8.86 | ||||
| 2025-08-14 | 13F | STAR Financial Bank | 6,801 | 121.10 | 535 | 127.23 | ||||
| 2025-08-04 | 13F | IFG Advisory, LLC | 4,679 | -11.62 | 368 | -9.61 | ||||
| 2025-08-14 | 13F | Susquehanna International Group, Llp | 34,077 | 2,679 | ||||||
| 2025-08-08 | 13F/A | Sequoia Financial Advisors, LLC | 0 | -100.00 | 0 | |||||
| 2025-08-01 | 13F | Rossby Financial, LCC | 1,359 | 0.07 | 107 | 7.07 | ||||
| 2025-07-02 | 13F | HBW Advisory Services LLC | 4,621 | 4.17 | 363 | 6.76 | ||||
| 2025-07-23 | 13F | Tcfg Wealth Management, Llc | 13,971 | -0.19 | 1,099 | 2.33 | ||||
| 2025-08-13 | 13F | Jones Financial Companies Lllp | 8,714 | 31.18 | 683 | 35.52 | ||||
| 2025-08-14 | 13F | UBS Group AG | 974,046 | 2.03 | 76,589 | 4.57 | ||||
| 2025-08-11 | 13F | NewEdge Wealth, LLC | 17,144 | -2.08 | 1,354 | 0.82 | ||||
| 2025-07-28 | 13F | Harbour Investments, Inc. | 39,709 | 5.99 | 3,122 | 8.63 | ||||
| 2025-05-15 | 13F | Hrt Financial Lp | 0 | -100.00 | 0 | |||||
| 2025-08-12 | 13F | Richmond Investment Services, LLC | 13,438 | 100.09 | 1,057 | 105.05 | ||||
| 2025-07-24 | 13F | Ronald Blue Trust, Inc. | 154 | 0.00 | 12 | 9.09 | ||||
| 2025-08-08 | 13F | Avantax Advisory Services, Inc. | 85,016 | -18.71 | 6,685 | -16.69 | ||||
| 2025-07-30 | 13F | BlueChip Wealth Advisors LLC | 5,613 | 0.00 | 441 | 2.56 | ||||
| 2025-07-10 | 13F | Three Seasons Wealth, LLC | 8,008 | 0.00 | 630 | 2.44 | ||||
| 2025-08-15 | 13F | Morgan Stanley | 2,072,545 | -3.19 | 162,964 | -0.78 | ||||
| 2025-08-05 | 13F | Bank of New York Mellon Corp | 40,070 | 3.48 | 3,151 | 6.06 | ||||
| 2025-07-29 | 13F | Private Trust Co Na | 430 | 0.00 | 34 | 3.13 | ||||
| 2025-08-14 | 13F | Wells Fargo & Company/mn | 207,122 | -3.00 | 16,286 | -0.59 | ||||
| 2025-08-12 | 13F | MAI Capital Management | 2,280 | 0.00 | 179 | 2.87 | ||||
| 2025-07-11 | 13F | Farther Finance Advisors, LLC | 1,381 | 196.99 | 109 | 208.57 | ||||
| 2025-07-24 | 13F | Us Bancorp \de\ | 8,819 | 368.10 | 693 | 381.25 | ||||
| 2025-08-14 | 13F | LaSalle St. Investment Advisors, LLC | 16,896 | -3.89 | 1 | 0.00 | ||||
| 2025-07-21 | 13F | DHJJ Financial Advisors, Ltd. | 2,516 | 0.00 | 198 | 2.07 | ||||
| 2025-08-13 | 13F | First Trust Advisors Lp | 14,288 | -2.60 | 1,123 | -0.18 | ||||
| 2025-08-07 | 13F | Runnymede Capital Advisors, Inc. | 0 | -100.00 | 0 | |||||
| 2025-08-01 | 13F | Bank of Jackson Hole Trust | 1,485 | 0.00 | 117 | 0.00 | ||||
| 2025-05-14 | 13F | Rockefeller Capital Management L.P. | 0 | -100.00 | 0 | |||||
| 2025-05-15 | 13F | D. E. Shaw & Co., Inc. | 0 | -100.00 | 0 | |||||
| 2025-07-14 | 13F | AdvisorNet Financial, Inc | 96 | -45.45 | 8 | -46.15 | ||||
| 2025-08-13 | 13F | Gateway Wealth Partners, LLC | 29,702 | -0.66 | 2,335 | 1.83 | ||||
| 2025-08-11 | 13F | Private Advisor Group, LLC | 172,923 | -2.62 | 13,597 | -0.20 | ||||
| 2025-07-23 | 13F | Trueblood Wealth Management, LLC | 39,090 | 4.99 | 3,074 | 7.60 | ||||
| 2025-08-13 | 13F | Russell Investments Group, Ltd. | 297 | -1.33 | 23 | 0.00 | ||||
| 2025-08-11 | 13F | Synergy Investment Management, LLC | 0 | -100.00 | 0 | |||||
| 2025-08-04 | 13F | Assetmark, Inc | 131,282 | 22.68 | 10,323 | 25.74 | ||||
| 2025-08-14 | 13F | Ameriprise Financial Inc | 3,451 | 12.70 | 271 | 15.81 | ||||
| 2025-08-08 | 13F | MTM Investment Management, LLC | 3,514 | -17.16 | 276 | -14.81 | ||||
| 2025-08-12 | 13F | J.w. Cole Advisors, Inc. | 3,183 | 250 | ||||||
| 2025-08-14 | 13F | Ausdal Financial Partners, Inc. | 3,102 | 0.13 | 244 | 2.53 | ||||
| 2025-08-19 | 13F | Asset Dedication, LLC | 343 | 0.00 | 27 | 0.00 | ||||
| 2025-08-14 | 13F | Colony Group, LLC | 3,423 | 0.00 | 269 | 2.67 | ||||
| 2025-04-22 | 13F | Synergy Financial Management, LLC | 0 | -100.00 | 0 | |||||
| 2025-08-14 | 13F | Warren Averett Asset Management, LLC | 14,974 | 0.25 | 1,177 | 2.79 | ||||
| 2025-08-05 | 13F | Holistic Financial Partners | 132,191 | -1.41 | 10,394 | 1.04 | ||||
| 2025-07-16 | 13F | American National Bank | 79 | 0.00 | 6 | 0.00 | ||||
| 2025-08-06 | 13F | Eukles Asset Management | 8,987 | -1.78 | 707 | 0.71 | ||||
| 2025-08-14 | 13F | Pinnacle Family Advisors, LLC | 6,983 | 0.81 | 549 | 3.39 | ||||
| 2025-07-31 | 13F | Buckingham Strategic Partners | 2,962 | 0.20 | 233 | 2.65 | ||||
| 2025-07-07 | 13F | Nova Wealth Management, Inc. | 3,617 | -39.89 | 284 | -38.39 | ||||
| 2025-08-01 | 13F | Bessemer Group Inc | 784 | 0 | ||||||
| 2025-07-11 | 13F | SILVER OAK SECURITIES, Inc | 18,845 | 3.15 | 1,482 | 6.70 | ||||
| 2025-08-12 | 13F | Virtu Financial LLC | 9,906 | -43.94 | 1 | -100.00 | ||||
| 2025-08-11 | 13F | Tidemark, LLC | 3,169 | -7.45 | 249 | -4.96 | ||||
| 2025-07-25 | 13F | Concurrent Investment Advisors, LLC | 9,383 | -43.13 | 738 | -41.74 | ||||
| 2025-08-14 | 13F | Atomi Financial Group, Inc. | 2,695 | 212 | ||||||
| 2025-07-23 | 13F | Valmark Advisers, Inc. | 4,143 | 0.00 | 326 | 2.52 | ||||
| 2025-08-12 | 13F | Founders Financial Alliance, LLC | 5,786 | 4.37 | 455 | 6.82 | ||||
| 2025-07-11 | 13F | Kaydan Wealth Management, Inc. | 91,273 | -66.99 | 7,177 | -66.17 | ||||
| 2025-07-16 | 13F | Independent Wealth Network Inc. | 5,570 | -0.64 | 438 | 1.86 | ||||
| 2025-08-14 | 13F | Bank Of America Corp /de/ | 342,742 | 13.37 | 26,950 | 16.19 | ||||
| 2025-04-21 | 13F | Nelson, Van Denburg & Campbell Wealth Management Group, LLC | 0 | -100.00 | 0 | |||||
| 2025-08-14 | 13F | Royal Bank Of Canada | 267,944 | -3.88 | 21,067 | -1.49 | ||||
| 2025-08-13 | 13F | Continuum Advisory, LLC | 0 | -100.00 | 0 | |||||
| 2025-08-14 | 13F | Aprio Wealth Management, LLC | 2,792 | 0.40 | 220 | 2.82 | ||||
| 2025-07-08 | 13F | Parallel Advisors, LLC | 26 | 0.00 | 2 | 100.00 | ||||
| 2025-07-17 | 13F | Janney Capital Management LLC | 3,263 | 0.00 | 0 | |||||
| 2025-08-06 | 13F | AE Wealth Management LLC | 93,783 | -1.34 | 7,374 | 1.11 | ||||
| 2025-08-04 | 13F | Spire Wealth Management | 1,624 | -47.60 | 128 | -46.41 | ||||
| 2025-08-13 | 13F | Northern Trust Corp | 0 | -100.00 | 0 | |||||
| 2025-07-10 | 13F | Wealth Enhancement Advisory Services, Llc | 2,861 | 230 | ||||||
| 2025-08-04 | 13F | Creative Financial Designs Inc /adv | 300 | 0.00 | 24 | 0.00 | ||||
| 2025-08-13 | 13F | Proactive Wealth Strategies LLC | 5,547 | 0.40 | 0 | |||||
| 2025-08-14 | 13F | Mercer Global Advisors Inc /adv | 3,009 | 0.00 | 237 | 2.61 | ||||
| 2025-08-14 | 13F | Diversify Advisory Services, LLC | 2,782 | -3.67 | 223 | 5.19 | ||||
| 2025-08-15 | 13F | Equitable Holdings, Inc. | 18,587 | -11.00 | 1,461 | -8.80 | ||||
| 2025-08-14 | 13F | Mml Investors Services, Llc | 23,804 | 0.78 | 2 | 0.00 | ||||
| 2025-08-11 | 13F | HighTower Advisors, LLC | 6,964 | 0.00 | 548 | 2.43 | ||||
| 2025-08-20 | 13F/A | Coppell Advisory Solutions LLC | 23,998 | -32.92 | 1,881 | -28.45 | ||||
| 2025-05-02 | 13F | Capital A Wealth Management, LLC | 0 | -100.00 | 0 | |||||
| 2025-08-05 | 13F | Huntington National Bank | 150 | 2.76 |
Other Listings
| MX:FTA |