Mga Batayang Estadistika
| Pemilik Institusional | 263 total, 260 long only, 0 short only, 3 long/short - change of -2.59% MRQ |
| Alokasi Portofolio Rata-rata | 0.1117 % - change of 14.48% MRQ |
| Saham Institusional (Jangka Panjang) | 72,977,774 (ex 13D/G) - change of -3.50MM shares -4.57% MRQ |
| Nilai Institusional (Jangka Panjang) | $ 1,511,968 USD ($1000) |
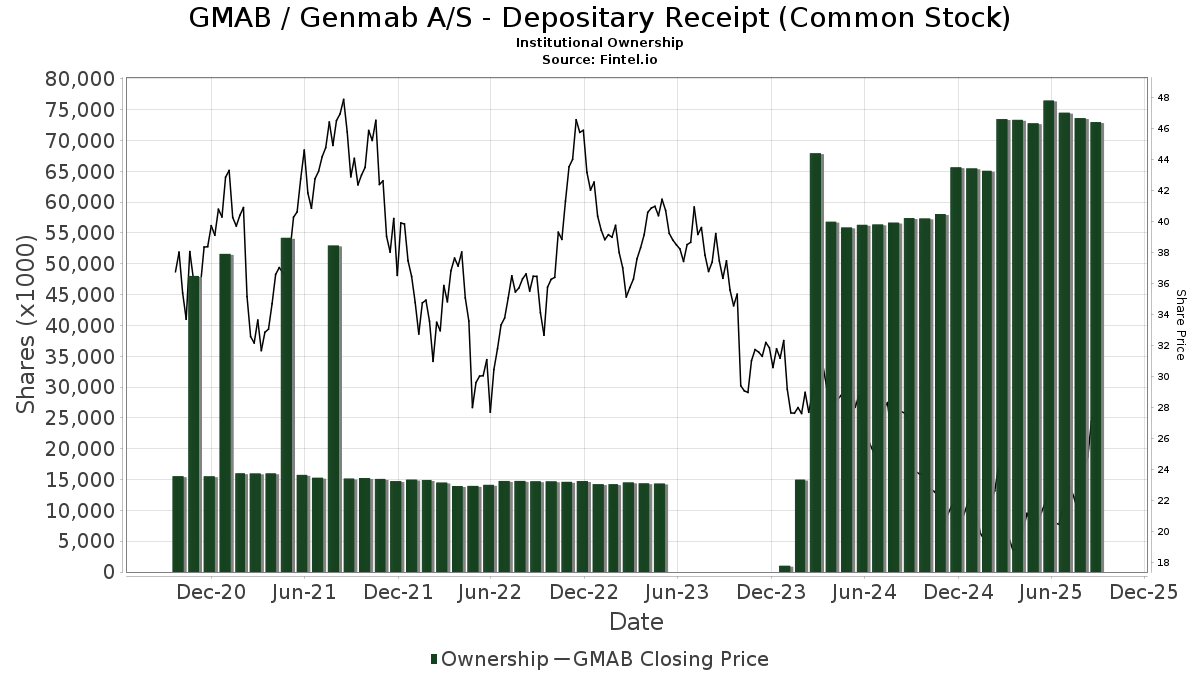
Kepemilikan Institusional dan Pemegang Saham
Genmab A/S - Depositary Receipt (Common Stock) (US:GMAB) memiliki 263 pemilik institusional dan pemegang saham yang telah mengajukan formulir 13D/G atau 13F kepada Komisi Bursa Efek (Securities Exchange Commission/SEC). Lembaga-lembaga ini memegang total 72,977,774 saham. Pemegang saham terbesar meliputi Alliancebernstein L.p., Orbis Allan Gray Ltd, APGAX - AB LARGE CAP GROWTH FUND INC Class A, Citadel Advisors Llc, Arrowstreet Capital, Limited Partnership, BlackRock, Inc., Harding Loevner Lp, Renaissance Technologies Llc, Morgan Stanley, and IBB - iShares Nasdaq Biotechnology ETF .
Struktur kepemilikan institusional Genmab A/S - Depositary Receipt (Common Stock) (NasdaqGS:GMAB) menunjukkan posisi terkini di perusahaan oleh institusi dan dana, serta perubahan terbaru dalam ukuran posisi. Pemegang saham utama dapat mencakup investor individu, reksa dana, dana lindung nilai, atau institusi. Jadwal 13D menunjukkan bahwa investor memegang (atau pernah memegang) lebih dari 5% saham perusahaan dan bermaksud (atau pernah bermaksud) untuk secara aktif mengejar perubahan strategi bisnis. Jadwal 13G menunjukkan investasi pasif lebih dari 5%.
The share price as of September 5, 2025 is 27.54 / share. Previously, on September 6, 2024, the share price was 27.52 / share. This represents an increase of 0.07% over that period.
Skor Sentimen Dana
Skor Sentimen Dana (sebelumnya dikenal sebagai Skor Akumulasi Kepemilikan) menemukan saham-saham yang paling banyak dibeli oleh dana. Ini adalah hasil dari model kuantitatif multi-faktor yang canggih yang mengidentifikasi perusahaan dengan tingkat akumulasi institusional tertinggi. Model penilaian menggunakan kombinasi dari total peningkatan pemilik yang diungkapkan, perubahan dalam alokasi portofolio pada pemilik tersebut, dan metrik lainnya. Angka berkisar dari 0 hingga 100, dengan angka yang lebih tinggi menunjukkan tingkat akumulasi yang lebih tinggi dibandingkan dengan perusahaan sejenisnya, dan 50 adalah rata-ratanya.
Frekuensi Pembaruan: Setiap Hari
Lihat Ownership Explorer, yang menyediakan daftar perusahaan dengan peringkat tertinggi.
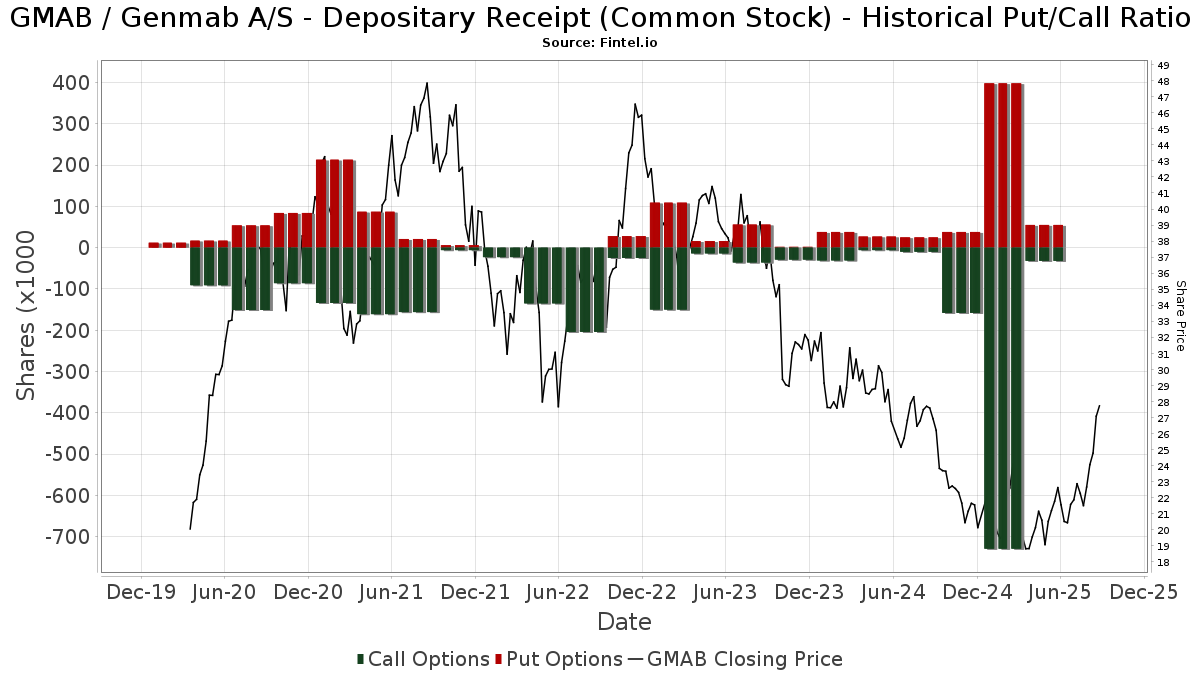
Rasio Put/Call Institusional
Selain melaporkan isu ekuitas dan utang standar, institusi dengan aset di bawah manajemen lebih dari 100 juta dolar AS juga harus mengungkapkan kepemilikan opsi put dan call mereka. Karena opsi put umumnya menunjukkan sentimen negatif, dan opsi call menunjukkan sentimen positif, kita dapat mengetahui sentimen institusional secara keseluruhan dengan memplot rasio put terhadap call. Grafik di sebelah kanan memplot rasio put/call historis untuk instrumen ini.
Menggunakan Rasio Put/Call sebagai indikator sentimen investor mengatasi salah satu kekurangan utama dari penggunaan total kepemilikan institusional, yaitu sejumlah besar aset yang dikelola diinvestasikan secara pasif untuk melacak indeks. Dana yang dikelola secara pasif biasanya tidak membeli opsi, sehingga indikator rasio put/call lebih akurat dalam melacak sentimen dana yang dikelola secara aktif.
Pengajuan 13F dan NPORT
Detail pada pengajuan 13F tersedia gratis. Detail pada pengajuan NP memerlukan keanggotaan premium. Baris berwarna hijau menunjukkan posisi baru. Baris berwarna merah menunjukkan posisi yang sudah ditutup. Klik tautan ini ikon untuk melihat riwayat transaksi selengkapnya.
Tingkatkan
untuk membuka data premium dan mengekspor ke Excel ![]() .
.
| Tanggal File | Sumber | Investor | Ketik | Presyo ng Avg (Silangan) |
Saham | Δ Saham (%) |
Dilaporkan Nilai ($1000) |
Nilai Δ (%) |
Alokasi Port (%) |
|
|---|---|---|---|---|---|---|---|---|---|---|
| 2025-08-06 | 13F | Golden State Wealth Management, LLC | 0 | -100.00 | 0 | |||||
| 2025-08-12 | 13F | XTX Topco Ltd | 0 | -100.00 | 0 | |||||
| 2025-08-13 | 13F | Quadrant Capital Group Llc | 27,518 | -7.54 | 569 | -2.41 | ||||
| 2025-08-14 | 13F/A | Rockefeller Capital Management L.P. | 12,931 | 267 | ||||||
| 2025-08-08 | 13F | Grandfield & Dodd, Llc | 38,503 | -3.48 | 795 | 1.79 | ||||
| 2025-08-13 | 13F | First Trust Advisors Lp | 1,770,310 | 3.54 | 36,575 | 9.25 | ||||
| 2025-08-08 | 13F | Atlantic Trust, LLC | 199 | 4 | ||||||
| 2025-07-25 | 13F | JustInvest LLC | 52,684 | 24.67 | 1,088 | 31.56 | ||||
| 2025-08-14 | 13F | Group One Trading, L.p. | 8 | 0 | ||||||
| 2025-08-26 | NP | AZBAX - AllianzGI Small-Cap Fund Class A | 27,495 | 568 | ||||||
| 2025-08-05 | 13F | NewSquare Capital LLC | 299 | 1,200.00 | 6 | |||||
| 2025-08-14 | 13F | Harding Loevner Lp | 2,923,439 | 1.48 | 60,419 | 7.06 | ||||
| 2025-08-12 | 13F | Atlas Capital Advisors Llc | 189 | 0.00 | 4 | 0.00 | ||||
| 2025-08-04 | 13F | Assetmark, Inc | 216 | -0.92 | 4 | 0.00 | ||||
| 2025-08-06 | NP | LINCOLN VARIABLE INSURANCE PRODUCTS TRUST - LVIP T. Rowe Price Growth Stock Fund Standard Class | 205,222 | -3.10 | 4,240 | 2.24 | ||||
| 2025-06-18 | NP | REAYX - Equity Income Fund Class Y | 17,667 | 8.10 | 374 | 16.20 | ||||
| 2025-08-13 | 13F | Russell Investments Group, Ltd. | 934,067 | -13.52 | 19,298 | -8.75 | ||||
| 2025-08-14 | 13F | Mml Investors Services, Llc | 38,576 | -17.44 | 1 | |||||
| 2025-08-12 | 13F | Clear Street Markets Llc | 152,832 | 3,158 | ||||||
| 2025-08-08 | 13F | Creative Planning | 65,132 | 11.79 | 1,346 | 17.98 | ||||
| 2025-07-30 | 13F | Cullen/frost Bankers, Inc. | 75 | -87.24 | 2 | -90.91 | ||||
| 2025-08-14 | 13F | Point72 Asia (Singapore) Pte. Ltd. | 258 | -23.21 | 5 | -16.67 | ||||
| 2025-07-08 | 13F | Parallel Advisors, LLC | 3,720 | 377.54 | 77 | 406.67 | ||||
| 2025-08-13 | 13F | Cresset Asset Management, LLC | 0 | -100.00 | 0 | |||||
| 2025-08-14 | 13F | Ameriprise Financial Inc | 56,714 | 1,172 | ||||||
| 2025-08-07 | 13F | Addison Advisors LLC | 300 | -21.88 | 6 | -14.29 | ||||
| 2025-08-04 | 13F | Keybank National Association/oh | 28,864 | 1.03 | 596 | 6.62 | ||||
| 2025-08-14 | 13F | Jane Street Group, Llc | 360,489 | 155.97 | 7,448 | 170.11 | ||||
| 2025-08-13 | 13F | Tema Etfs Llc | 130,217 | 26.73 | 2,690 | 33.76 | ||||
| 2025-08-14 | 13F | Jane Street Group, Llc | Put | 11,300 | -74.83 | 233 | -73.49 | |||
| 2025-08-15 | 13F | CI Private Wealth, LLC | 0 | -100.00 | 0 | |||||
| 2025-08-08 | 13F | Geode Capital Management, Llc | 27,127 | 0.41 | 560 | 6.06 | ||||
| 2025-05-05 | 13F | Creekmur Asset Management LLC | 0 | -100.00 | 0 | |||||
| 2025-08-14 | 13F | Wells Fargo & Company/mn | 9,765 | 3.05 | 202 | 8.65 | ||||
| 2025-08-14 | 13F | Daiwa Securities Group Inc. | 159 | 0.00 | 0 | |||||
| 2025-08-14 | 13F | Engineers Gate Manager LP | 78,151 | -12.55 | 1,615 | -7.72 | ||||
| 2025-08-14 | 13F | Macquarie Group Ltd | 0 | -100.00 | 0 | -100.00 | ||||
| 2025-06-18 | NP | RETSX - Tax-Managed U.S. Large Cap Fund Class S | 508,504 | 10,755 | ||||||
| 2025-07-14 | 13F | UMA Financial Services, Inc. | 95 | 2 | ||||||
| 2025-07-30 | NP | APIE - ActivePassive International Equity ETF | 30,008 | -40.38 | 629 | -44.96 | ||||
| 2025-08-14 | 13F | Nfj Investment Group, Llc | 48 | -99.44 | 1 | -100.00 | ||||
| 2025-08-06 | 13F | First Horizon Advisors, Inc. | 625 | -8.49 | 13 | -7.69 | ||||
| 2025-08-14 | 13F | Verition Fund Management LLC | 168,647 | 163.57 | 3,484 | 178.27 | ||||
| 2025-08-11 | 13F | Pin Oak Investment Advisors Inc | 381 | 0.00 | 0 | |||||
| 2025-08-12 | 13F | Deutsche Bank Ag\ | 4 | 0 | ||||||
| 2025-05-14 | 13F | Pilgrim Partners Asia Pte Ltd | 0 | -100.00 | 0 | |||||
| 2025-05-16 | 13F/A | Kestra Investment Management, LLC | 0 | -100.00 | 0 | |||||
| 2025-07-16 | 13F | Eagle Global Advisors Llc | 210,295 | 0.48 | 4,345 | 6.03 | ||||
| 2025-08-08 | 13F/A | Sterling Capital Management LLC | 18,914 | -5.14 | 391 | 0.00 | ||||
| 2025-08-14 | 13F | Schonfeld Strategic Advisors LLC | 0 | -100.00 | 0 | |||||
| 2025-08-05 | 13F | Huntington National Bank | 563 | 3.30 | 12 | 10.00 | ||||
| 2025-05-15 | 13F | Bridgefront Capital, LLC | 0 | -100.00 | 0 | |||||
| 2025-08-14 | 13F/A | Barclays Plc | 5,006 | 58.72 | 0 | |||||
| 2025-07-24 | 13F | Us Bancorp \de\ | 88,158 | -18.03 | 1,821 | -13.49 | ||||
| 2025-07-28 | NP | AVSD - Avantis Responsible International Equity ETF | 2,893 | 0.00 | 61 | -7.69 | ||||
| 2025-04-29 | 13F | Callan Capital, LLC | 14,361 | 281 | ||||||
| 2025-07-24 | 13F | IFP Advisors, Inc | 100 | -16.67 | 2 | 0.00 | ||||
| 2025-08-13 | 13F | Renaissance Technologies Llc | 2,766,750 | 22.30 | 57,161 | 29.04 | ||||
| 2025-07-14 | 13F | GAMMA Investing LLC | 1,919 | 12.22 | 40 | 18.18 | ||||
| 2025-08-14 | 13F | Alliancebernstein L.p. | 10,662,375 | -27.59 | 220,285 | -23.60 | ||||
| 2025-07-16 | 13F | Signaturefd, Llc | 9,124 | -13.30 | 188 | -8.74 | ||||
| 2025-06-26 | NP | DFIV - Dimensional International Value ETF | 9,780 | 0.00 | 207 | 7.29 | ||||
| 2025-08-14 | 13F | Capstone Investment Advisors, Llc | 0 | -100.00 | 0 | -100.00 | ||||
| 2025-05-13 | 13F | United Capital Financial Advisers, Llc | 0 | -100.00 | 0 | |||||
| 2025-04-25 | NP | ONEQ - Fidelity Nasdaq Composite Index Tracking Stock This fund is a listed as child fund of Fmr Llc and if that institution has disclosed ownership in this security, then these positions will not be double counted when calculating total shares and total value | 16,836 | 2.61 | 382 | 8.24 | ||||
| 2025-08-11 | 13F | Hexagon Capital Partners LLC | 0 | -100.00 | 0 | |||||
| 2025-08-12 | 13F | MAI Capital Management | 539 | 290.58 | 11 | 450.00 | ||||
| 2025-08-07 | 13F | Campbell & CO Investment Adviser LLC | 107,217 | 293.14 | 2,215 | 315.57 | ||||
| 2025-07-11 | 13F | Farther Finance Advisors, LLC | 422 | 93.58 | 9 | 100.00 | ||||
| 2025-07-31 | 13F | CVA Family Office, LLC | 0 | -100.00 | 0 | |||||
| 2025-08-14 | 13F | Aqr Capital Management Llc | 29,963 | 619 | ||||||
| 2025-07-28 | NP | AVIV - Avantis International Large Cap Value ETF This fund is a listed as child fund of American Century Companies Inc and if that institution has disclosed ownership in this security, then these positions will not be double counted when calculating total shares and total value | 17,483 | 366 | ||||||
| 2025-08-05 | 13F | Bank Of Montreal /can/ | 40,056 | -1.12 | 828 | 4.29 | ||||
| 2025-07-25 | 13F | Yousif Capital Management, Llc | 10,943 | 7.78 | 226 | 14.14 | ||||
| 2025-08-07 | 13F | Zions Bancorporation, National Association /ut/ | 23 | -51.06 | 0 | |||||
| 2025-08-14 | 13F | Qube Research & Technologies Ltd | 0 | -100.00 | 0 | |||||
| 2025-04-28 | NP | CNCR - Loncar Cancer Immunotherapy ETF | 5,921 | -6.02 | 134 | -0.74 | ||||
| 2025-07-28 | 13F | Harbour Investments, Inc. | 133 | 0.00 | 3 | 0.00 | ||||
| 2025-06-26 | NP | APGAX - AB LARGE CAP GROWTH FUND INC Class A | 4,102,116 | -4.81 | 86,760 | 2.35 | ||||
| 2025-08-14 | 13F | Two Sigma Investments, Lp | 1,618,544 | -14.80 | 33,439 | -10.10 | ||||
| 2025-08-12 | 13F | SRS Capital Advisors, Inc. | 7 | 0.00 | 3 | |||||
| 2025-07-18 | 13F | Founders Capital Management | 1,000 | 21 | ||||||
| 2025-08-12 | 13F | Trexquant Investment LP | 363,114 | -22.28 | 7,502 | -17.99 | ||||
| 2025-08-14 | 13F | Private Wealth Advisors, LLC | 148,336 | 3,065 | ||||||
| 2025-08-06 | 13F | True Wealth Design, LLC | 50 | 56.25 | 1 | |||||
| 2025-08-14 | 13F | Mariner, LLC | 37,153 | -9.51 | 768 | -4.60 | ||||
| 2025-05-15 | 13F | Bridger Management, Llc | 0 | -100.00 | 0 | |||||
| 2025-08-13 | 13F | Rsm Us Wealth Management Llc | 25,794 | -0.94 | 533 | 4.52 | ||||
| 2025-08-14 | 13F | Avidity Partners Management LP | 650,000 | 13,429 | ||||||
| 2025-05-15 | 13F | Rise Advisors, LLC | 0 | -100.00 | 0 | |||||
| 2025-08-15 | 13F | Morgan Stanley | 2,697,135 | -4.99 | 55,723 | 0.24 | ||||
| 2025-08-12 | 13F | Dimensional Fund Advisors Lp | 53,105 | 4.49 | 1,097 | 10.25 | ||||
| 2025-05-09 | 13F | R Squared Ltd | 0 | -100.00 | 0 | |||||
| 2025-07-31 | 13F | Whipplewood Advisors, LLC | 18 | -89.16 | 0 | -100.00 | ||||
| 2025-07-24 | NP | FNCMX - Fidelity Nasdaq Composite Index Fund This fund is a listed as child fund of Fmr Llc and if that institution has disclosed ownership in this security, then these positions will not be double counted when calculating total shares and total value | 27,016 | 0.00 | 566 | -7.68 | ||||
| 2025-07-16 | 13F | Highline Wealth Partners Llc | 0 | -100.00 | 0 | |||||
| 2025-08-05 | 13F | Advisors Preferred, LLC | 0 | -100.00 | 0 | |||||
| 2025-08-12 | 13F | American Century Companies Inc | 308,437 | -19.66 | 6,372 | -15.22 | ||||
| 2025-08-14 | 13F | Woodline Partners LP | 493,506 | 10,196 | ||||||
| 2025-08-12 | 13F | Charles Schwab Investment Management Inc | 76,491 | 25.50 | 1,580 | 32.44 | ||||
| 2025-03-27 | NP | AGRFX - AB Growth Fund Class A | 129,000 | 0.00 | 2,537 | -11.88 | ||||
| 2025-07-17 | 13F | Alpine Bank Wealth Management | 0 | -100.00 | 0 | |||||
| 2025-08-14 | 13F | Caption Management, LLC | Put | 0 | -100.00 | 0 | ||||
| 2025-08-11 | 13F | Brown Brothers Harriman & Co | 544 | 0.00 | 11 | 10.00 | ||||
| 2025-08-14 | 13F | Caption Management, LLC | Call | 0 | -100.00 | 0 | ||||
| 2025-08-06 | NP | LINCOLN VARIABLE INSURANCE PRODUCTS TRUST - LVIP Blended Large Cap Growth Managed Volatility Fund Standard Class | 107,119 | -0.82 | 2,213 | 4.68 | ||||
| 2025-08-14 | 13F | Caption Management, LLC | 0 | -100.00 | 0 | |||||
| 2025-08-13 | 13F | NEOS Investment Management LLC | 130,217 | 26.73 | 2,690 | 33.76 | ||||
| 2025-07-30 | NP | ENDW - Cambria Endowment Style ETF | 20 | 0 | ||||||
| 2025-05-13 | 13F | Vestmark Advisory Solutions, Inc. | 0 | -100.00 | 0 | |||||
| 2025-08-06 | 13F | Baillie Gifford & Co | 12 | -77.78 | 0 | -100.00 | ||||
| 2025-07-24 | NP | Tema ETF Trust - Tema Oncology ETF | 116,562 | -2.22 | 2,442 | -9.69 | ||||
| 2025-08-14 | 13F | Graham Capital Management, L.P. | 0 | -100.00 | 0 | |||||
| 2025-05-15 | 13F | Glenmede Trust Co Na | 13,193 | 19.83 | 258 | 12.66 | ||||
| 2025-08-12 | 13F | Coldstream Capital Management Inc | 0 | -100.00 | 0 | |||||
| 2025-08-14 | 13F | Royal Bank Of Canada | 117,288 | -2.72 | 2,423 | 2.63 | ||||
| 2025-07-30 | 13F | Whittier Trust Co Of Nevada Inc | 0 | -100.00 | 0 | |||||
| 2025-08-14 | 13F | UBS Group AG | 484,867 | -10.38 | 10,017 | -5.43 | ||||
| 2025-07-21 | 13F | Hardman Johnston Global Advisors LLC | 0 | -100.00 | 0 | |||||
| 2025-08-12 | 13F | Advisors Asset Management, Inc. | 0 | -100.00 | 0 | |||||
| 2025-08-14 | 13F | Bank Of America Corp /de/ | 567,795 | -16.87 | 11,731 | -12.29 | ||||
| 2025-08-15 | 13F | Captrust Financial Advisors | 22,442 | 2.40 | 464 | 7.93 | ||||
| 2025-08-28 | 13F | China Universal Asset Management Co., Ltd. | 18,421 | -60.13 | 381 | -57.96 | ||||
| 2025-08-11 | 13F | GW&K Investment Management, LLC | 140 | 0.00 | 0 | |||||
| 2025-08-11 | 13F | Cornerstone Planning Group LLC | 97 | 193.94 | 2 | |||||
| 2025-08-14 | 13F | Stifel Financial Corp | 22,748 | -63.92 | 470 | -61.99 | ||||
| 2025-05-15 | 13F | PenderFund Capital Management Ltd. | 0 | -100.00 | 0 | |||||
| 2025-07-11 | 13F | Pinnacle Bancorp, Inc. | 733 | 0.00 | 15 | 7.14 | ||||
| 2025-07-15 | 13F | Fifth Third Bancorp | 41,425 | -1.72 | 856 | 3.64 | ||||
| 2025-08-13 | 13F | Mount Yale Investment Advisors, LLC | 280 | 6 | ||||||
| 2025-08-13 | 13F | Natixis Advisors, L.p. | 130,445 | 1.49 | 3 | 0.00 | ||||
| 2025-08-14 | 13F | Cubist Systematic Strategies, LLC | 384,546 | -69.44 | 7,945 | -67.75 | ||||
| 2025-08-13 | 13F | Bare Financial Services, Inc | 0 | -100.00 | 0 | |||||
| 2025-08-14 | 13F | Quantinno Capital Management LP | 158,132 | 64.88 | 3,267 | 74.05 | ||||
| 2025-08-25 | 13F/A | Neuberger Berman Group LLC | 47,093 | 6.33 | 973 | 12.11 | ||||
| 2025-08-19 | NP | RIFAX - U.S. Strategic Equity Fund | 25,963 | 0.00 | 536 | 5.51 | ||||
| 2025-08-29 | NP | WDNA - WisdomTree BioRevolution Fund N/A | 967 | -0.51 | 20 | 0.00 | ||||
| 2025-07-24 | 13F | Callan Family Office, LLC | 31,681 | 655 | ||||||
| 2025-08-08 | 13F | Wealth Alliance | 14,455 | 2.31 | 299 | 7.97 | ||||
| 2025-08-11 | 13F | Principal Securities, Inc. | 2,231 | -16.35 | 46 | -16.36 | ||||
| 2025-08-13 | 13F | Northern Trust Corp | 803,602 | 28.55 | 16,602 | 35.65 | ||||
| 2025-04-22 | 13F | Mendota Financial Group, LLC | 0 | -100.00 | 0 | |||||
| 2025-08-14 | 13F | Tang Capital Management Llc | 200,000 | 0.00 | 4,132 | 5.52 | ||||
| 2025-08-28 | NP | DTLGX - Large Company Growth Portfolio Investment Class | 9,954 | -0.99 | 206 | 4.59 | ||||
| 2025-08-12 | 13F | Nemes Rush Group LLC | 60 | 1 | ||||||
| 2025-08-14 | 13F/A | Skopos Labs, Inc. | 7,354 | 73.20 | 152 | 81.93 | ||||
| 2025-07-15 | 13F | Fortitude Family Office, LLC | 0 | -100.00 | 0 | |||||
| 2025-05-08 | NP | QGBLX - Quantified Global Fund Investor Class | 4,481 | 74.83 | 88 | 7.41 | ||||
| 2025-08-19 | 13F/A | Pitcairn Co | 12,266 | -20.20 | 253 | -15.67 | ||||
| 2025-09-04 | 13F/A | Advisor Group Holdings, Inc. | 1,603 | 37.83 | 33 | 50.00 | ||||
| 2025-07-31 | 13F | DDD Partners, LLC | 0 | -100.00 | 0 | |||||
| 2025-08-14 | 13F | Raymond James Financial Inc | 31,146 | 48.08 | 643 | 56.45 | ||||
| 2025-05-13 | 13F | Ethic Inc. | 0 | -100.00 | 0 | |||||
| 2025-08-14 | 13F | Point72 Asset Management, L.P. | 538,500 | -41.71 | 11,125 | -38.50 | ||||
| 2025-08-13 | 13F | Northwestern Mutual Wealth Management Co | 38 | 1 | ||||||
| 2025-08-14 | 13F | Orbis Allan Gray Ltd | 7,920,400 | 38.69 | 163,635 | 46.34 | ||||
| 2025-06-18 | NP | RSEAX - U.S. Strategic Equity Fund Class A | 138,075 | 12.48 | 2,920 | 20.96 | ||||
| 2025-08-12 | 13F | Global Retirement Partners, LLC | 1,956 | -2.88 | 40 | -4.76 | ||||
| 2025-08-13 | 13F | Mackenzie Financial Corp | 31,910 | -3.33 | 659 | 2.01 | ||||
| 2025-08-12 | 13F | Brandywine Global Investment Management, LLC | 1,744,769 | 1.59 | 36,047 | 7.20 | ||||
| 2025-08-13 | 13F | Twin Peaks Wealth Advisors, LLC | 187 | 4 | ||||||
| 2025-07-30 | 13F | FNY Investment Advisers, LLC | 2 | 0 | ||||||
| 2025-08-28 | NP | SEUIX - Simt Large Cap Value Fund Class I | 99,887 | 7.05 | 2,064 | 12.92 | ||||
| 2025-08-13 | 13F | Capital Fund Management S.a. | 226,584 | 110.73 | 4,681 | 122.38 | ||||
| 2025-07-22 | 13F | Gf Fund Management Co. Ltd. | 1,073 | 0.00 | 22 | 4.76 | ||||
| 2025-08-11 | 13F | Citigroup Inc | 87,471 | 337.03 | 1,807 | 362.15 | ||||
| 2025-08-04 | 13F | Creative Financial Designs Inc /adv | 0 | -100.00 | 0 | |||||
| 2025-08-08 | 13F | Crossmark Global Holdings, Inc. | 41,813 | -6.77 | 864 | -1.71 | ||||
| 2025-08-12 | 13F | BlackRock, Inc. | 3,166,021 | -10.00 | 65,410 | -5.04 | ||||
| 2025-05-12 | 13F | Aigen Investment Management, Lp | 0 | -100.00 | 0 | |||||
| 2025-06-26 | NP | DFALX - Large Cap International Portfolio - Institutional Class This fund is a listed as child fund of Dimensional Fund Advisors Lp and if that institution has disclosed ownership in this security, then these positions will not be double counted when calculating total shares and total value | 1,009 | 0.00 | 21 | 10.53 | ||||
| 2025-05-15 | 13F | Deep Track Capital, LP | 0 | -100.00 | 0 | |||||
| 2025-07-21 | 13F | Ameritas Advisory Services, LLC | 100 | 2 | ||||||
| 2025-05-15 | 13F | Hrt Financial Lp | 0 | -100.00 | 0 | |||||
| 2025-07-25 | 13F | Sequoia Financial Advisors, LLC | 20,419 | -7.70 | 422 | -2.77 | ||||
| 2025-08-07 | 13F | Sierra Ocean, Llc | 211 | 12.83 | 4 | 33.33 | ||||
| 2025-07-21 | 13F | Credential Qtrade Securities Inc. | 0 | -100.00 | 0 | -100.00 | ||||
| 2025-08-14 | 13F | Headlands Technologies LLC | 10,166 | 551.67 | 210 | 600.00 | ||||
| 2025-05-15 | 13F | WPG Advisers, LLC | 0 | -100.00 | 0 | -100.00 | ||||
| 2025-07-29 | 13F | Regions Financial Corp | 12,483 | -6.14 | 258 | -1.15 | ||||
| 2025-07-30 | 13F | Bogart Wealth, LLC | 146 | 0.00 | 3 | 50.00 | ||||
| 2025-08-08 | 13F | Gts Securities Llc | 114,743 | 2,371 | ||||||
| 2025-05-12 | 13F | Nomura Asset Management Co Ltd | 0 | 0 | ||||||
| 2025-08-15 | 13F | Binnacle Investments Inc | 39 | 143.75 | 1 | |||||
| 2025-06-26 | NP | DFSI - Dimensional International Sustainability Core 1 ETF | 2,300 | 0.00 | 49 | 6.67 | ||||
| 2025-07-17 | 13F | Park Place Capital Corp | 156 | 0.00 | 3 | 0.00 | ||||
| 2025-07-10 | 13F | Exchange Traded Concepts, Llc | 0 | -100.00 | 0 | |||||
| 2025-05-06 | 13F | Venturi Wealth Management, LLC | 0 | -100.00 | 0 | |||||
| 2025-08-14 | 13F | Voloridge Investment Management, Llc | 949,178 | -27.72 | 19,610 | -23.74 | ||||
| 2025-08-01 | 13F | Y-Intercept (Hong Kong) Ltd | 29,329 | -9.69 | 606 | -4.72 | ||||
| 2025-08-12 | 13F | Country Trust Bank | 0 | -100.00 | 0 | |||||
| 2025-05-12 | 13F | Capital International Investors | 0 | -100.00 | 0 | |||||
| 2025-08-26 | NP | FBT - First Trust NYSE Arca Biotechnology Index Fund This fund is a listed as child fund of First Trust Advisors Lp and if that institution has disclosed ownership in this security, then these positions will not be double counted when calculating total shares and total value | 1,679,981 | -0.66 | 34,708 | 4.82 | ||||
| 2025-07-11 | 13F/A | Umb Bank N A/mo | 928 | 206.27 | 19 | 280.00 | ||||
| 2025-04-25 | 13F | Mather Group, Llc. | 0 | -100.00 | 0 | |||||
| 2025-08-14 | 13F | Wetherby Asset Management Inc | 0 | -100.00 | 0 | |||||
| 2025-08-14 | 13F | Scientech Research LLC | 35,077 | 1.35 | 725 | 6.94 | ||||
| 2025-08-14 | 13F | Barometer Capital Management Inc. | 19,137 | 395 | ||||||
| 2025-07-14 | 13F | Park Avenue Securities Llc | 14,940 | 5.90 | 0 | |||||
| 2025-08-26 | NP | AB VARIABLE PRODUCTS SERIES FUND, INC. - AB Large Cap Growth Portfolio Class A | 147,067 | 0.00 | 3,038 | 5.52 | ||||
| 2025-06-26 | NP | DFAI - Dimensional International Core Equity Market ETF | 22,620 | 0.00 | 478 | 7.66 | ||||
| 2025-08-12 | 13F | Franklin Resources Inc | 30,154 | -3.38 | 623 | 1.80 | ||||
| 2025-08-08 | 13F | Pnc Financial Services Group, Inc. | 18,622 | -81.48 | 385 | -80.49 | ||||
| 2025-08-12 | 13F | Rhumbline Advisers | 17,207 | 1.48 | 355 | 7.25 | ||||
| 2025-07-31 | 13F | Ingalls & Snyder Llc | 119,484 | -19.98 | 2 | 0.00 | ||||
| 2025-08-14 | 13F | Point72 Hong Kong Ltd | 15,377 | 318 | ||||||
| 2025-08-26 | NP | FTQI - First Trust Hedged BuyWrite Income ETF This fund is a listed as child fund of First Trust Advisors Lp and if that institution has disclosed ownership in this security, then these positions will not be double counted when calculating total shares and total value | 63,536 | 2,802.51 | 1,313 | 1,480.72 | ||||
| 2025-06-27 | NP | SUNAMERICA SERIES TRUST - SA AB Growth Portfolio Class 1 | 288,808 | 5.69 | 6,108 | 13.64 | ||||
| 2025-07-30 | 13F | Financial Perspectives, Inc | 1,333 | 0.00 | 28 | 3.85 | ||||
| 2025-08-14 | 13F | Bnp Paribas Arbitrage, Sa | 48,139 | -77.33 | 995 | -76.09 | ||||
| 2025-08-14 | 13F | GWM Advisors LLC | 93 | -99.19 | 2 | -99.56 | ||||
| 2025-08-08 | 13F | POM Investment Strategies, LLC | 0 | -100.00 | 0 | |||||
| 2025-08-14 | 13F | Vident Advisory, LLC | 31,482 | 154.36 | 650 | 168.60 | ||||
| 2025-08-15 | 13F | Tower Research Capital LLC (TRC) | 46,653 | 4,407.54 | 964 | 4,715.00 | ||||
| 2025-08-08 | 13F | Mitsubishi UFJ Trust & Banking Corp | 52,872 | 374.32 | 1,092 | 400.92 | ||||
| 2025-08-11 | 13F | Rothschild Investment Llc | 746 | 9.22 | 15 | 15.38 | ||||
| 2025-08-14 | 13F | Evergreen Capital Management Llc | 9,697 | 200 | ||||||
| 2025-08-12 | 13F | AlphaCore Capital LLC | 2,122 | 44 | ||||||
| 2025-05-15 | 13F | StoneX Group Inc. | 0 | -100.00 | 0 | -100.00 | ||||
| 2025-07-29 | 13F | Salomon & Ludwin, LLC | 12 | 0 | ||||||
| 2025-08-14 | 13F | Mercer Global Advisors Inc /adv | 32,467 | -35.27 | 671 | -31.77 | ||||
| 2025-08-15 | 13F | Provenance Wealth Advisors, LLC | 0 | -100.00 | 0 | |||||
| 2025-08-12 | 13F | CIBC Private Wealth Group, LLC | 783 | -52.86 | 16 | -44.83 | ||||
| 2025-08-26 | NP | GMOI - GMO International Value ETF | 4,239 | 88 | ||||||
| 2025-03-24 | 13F/A | Wellington Management Group Llp | 0 | -100.00 | 0 | |||||
| 2025-08-04 | 13F | Hantz Financial Services, Inc. | 5,428 | 1,590.97 | 0 | |||||
| 2025-08-12 | 13F | Steward Partners Investment Advisory, Llc | 80 | 0.00 | 2 | 0.00 | ||||
| 2025-07-28 | 13F | BRYN MAWR TRUST Co | 0 | -100.00 | 0 | |||||
| 2025-08-13 | 13F | Continuum Advisory, LLC | 0 | -100.00 | 0 | |||||
| 2025-07-22 | 13F | DAVENPORT & Co LLC | 33,826 | 6.78 | 699 | 12.58 | ||||
| 2025-08-12 | 13F | Folketrygdfondet | 172,796 | 1.42 | 3,570 | 6.98 | ||||
| 2025-08-13 | 13F | Arrowstreet Capital, Limited Partnership | 3,454,378 | 152.25 | 71,367 | 166.17 | ||||
| 2025-08-06 | 13F | Mark Sheptoff Financial Planning, Llc | 1,400 | 0.00 | 29 | 3.70 | ||||
| 2025-04-28 | NP | ADGAX - AB CORE OPPORTUNITIES FUND, INC. Class A | 29,174 | -4.81 | 662 | 0.46 | ||||
| 2025-08-14 | 13F | Glenmede Investment Management, LP | 13,859 | 286 | ||||||
| 2025-07-29 | NP | CAVAX - Catholic Values Equity Fund Class F, effective 1-31-2017 (formerly Class A) | 0 | -100.00 | 0 | -100.00 | ||||
| 2025-08-11 | 13F | Madison Asset Management, LLC | 62,930 | 0.91 | 1,300 | 6.47 | ||||
| 2025-06-26 | NP | DFIC - Dimensional International Core Equity 2 ETF | 1,800 | 0.00 | 38 | 8.57 | ||||
| 2025-08-14 | 13F | Susquehanna International Group, Llp | 30,394 | 628 | ||||||
| 2025-08-14 | 13F | Susquehanna International Group, Llp | Call | 14,200 | -62.92 | 293 | -60.88 | |||
| 2025-08-14 | 13F | Citadel Advisors Llc | 3,569,184 | -19.37 | 73,739 | -14.92 | ||||
| 2025-08-14 | 13F | Susquehanna International Group, Llp | Put | 16,900 | 33.07 | 349 | 40.73 | |||
| 2025-08-14 | 13F | Two Sigma Advisers, Lp | 1,821,000 | -7.74 | 37,622 | -2.65 | ||||
| 2025-08-13 | 13F | Cerity Partners LLC | 22,834 | -44.18 | 472 | -41.12 | ||||
| 2025-08-13 | 13F | EverSource Wealth Advisors, LLC | 2,114 | 124.89 | 44 | 138.89 | ||||
| 2025-08-08 | 13F | SBI Securities Co., Ltd. | 307 | 42.13 | 6 | 50.00 | ||||
| 2025-07-25 | 13F | Envestnet Portfolio Solutions, Inc. | 11,658 | -16.79 | 241 | -12.41 | ||||
| 2025-05-15 | 13F | Wiley Bros.-aintree Capital, Llc | 0 | -100.00 | 0 | |||||
| 2025-07-25 | 13F | Stephens Consulting, LLC | 79 | 2 | ||||||
| 2025-08-27 | 13F/A | Squarepoint Ops LLC | 94,233 | 636.25 | 1,947 | 678.40 | ||||
| 2025-07-15 | 13F | Td Private Client Wealth Llc | 6,308 | -21.80 | 130 | -17.20 | ||||
| 2025-07-28 | NP | BIB - ProShares Ultra Nasdaq Biotechnology | 1,542 | -14.95 | 32 | -21.95 | ||||
| 2025-08-14 | 13F | Citadel Advisors Llc | Call | 18,300 | -62.03 | 378 | -59.92 | |||
| 2025-08-14 | 13F | Citadel Advisors Llc | Put | 26,800 | -29.47 | 554 | -25.67 | |||
| 2025-08-14 | 13F | Goldman Sachs Group Inc | 889,275 | 25.54 | 18,372 | 32.47 | ||||
| 2025-08-15 | 13F | Kestra Advisory Services, LLC | 0 | -100.00 | 0 | |||||
| 2025-07-29 | NP | SCPAX - Siit Large Cap Disciplined Equity Fund - Class A | 67,210 | 4.79 | 1,408 | -3.16 | ||||
| 2025-08-14 | 13F | Camber Capital Management LP | 0 | -100.00 | 0 | |||||
| 2025-07-28 | NP | AVDEX - Avantis International Equity Fund Institutional Class This fund is a listed as child fund of American Century Companies Inc and if that institution has disclosed ownership in this security, then these positions will not be double counted when calculating total shares and total value | 17,015 | 215.09 | 356 | 191.80 | ||||
| 2025-07-21 | 13F | Ameriflex Group, Inc. | 0 | -100.00 | 0 | |||||
| 2025-07-24 | 13F | Jfs Wealth Advisors, Llc | 129 | -9.79 | 3 | 0.00 | ||||
| 2025-08-27 | 13F/A | Brinker Capital Investments, LLC | 19,252 | -9.46 | 398 | -4.57 | ||||
| 2025-08-14 | 13F | Point72 Europe (London) LLP | 471,700 | 9,745 | ||||||
| 2025-05-15 | 13F | Millennium Management Llc | Call | 0 | -100.00 | 0 | -100.00 | |||
| 2025-08-18 | 13F/A | Hudson Bay Capital Management LP | 300,000 | -1.64 | 6,198 | 3.80 | ||||
| 2025-07-10 | 13F | Wealth Enhancement Advisory Services, Llc | 12,685 | 257 | ||||||
| 2025-07-21 | 13F | Qrg Capital Management, Inc. | 65,902 | -11.95 | 1,362 | -7.10 | ||||
| 2025-08-14 | 13F | Smartleaf Asset Management LLC | 6,008 | 4.09 | 123 | 7.89 | ||||
| 2025-05-12 | 13F | Prestige Wealth Management Group LLC | 0 | -100.00 | 0 | |||||
| 2025-07-25 | 13F | LRI Investments, LLC | 558 | 0.00 | 12 | 10.00 | ||||
| 2025-08-13 | 13F | Foresight Group Ltd Liability Partnership | 48,007 | -1.47 | 9,933 | 5.07 | ||||
| 2025-05-05 | 13F | Lindbrook Capital, Llc | 901 | -51.32 | 18 | -55.26 | ||||
| 2025-07-08 | 13F | Gallacher Capital Management LLC | 17,348 | 20.93 | 358 | 27.86 | ||||
| 2025-08-11 | 13F | Annis Gardner Whiting Capital Advisors, LLC | 122 | 3 | ||||||
| 2025-08-28 | NP | SLGAX - SIMT Large Cap Fund Class F | 82,643 | 30.59 | 1,707 | 37.77 | ||||
| 2025-08-14 | 13F | Avidity Partners Management LP | Call | 0 | -100.00 | 0 | -100.00 | |||
| 2025-05-14 | 13F | OMERS ADMINISTRATION Corp | 0 | -100.00 | 0 | |||||
| 2025-08-11 | 13F | Bell Investment Advisors, Inc | 164 | 105.00 | 3 | 200.00 | ||||
| 2025-05-02 | 13F | Concord Wealth Partners | 0 | -100.00 | 0 | |||||
| 2025-08-15 | 13F | WealthCollab, LLC | 357 | -32.26 | 7 | -30.00 | ||||
| 2025-07-07 | 13F | Versant Capital Management, Inc | 10,567 | 21.13 | 218 | 28.24 | ||||
| 2025-08-14 | 13F | Principia Wealth Advisory, LLC | 13 | 0 | ||||||
| 2025-07-21 | 13F | Mirae Asset Global Investments Co., Ltd. | 1,620 | -94.94 | 33 | -94.76 | ||||
| 2025-07-28 | 13F | Private Wealth Asset Management, LLC | 35 | 0.00 | 1 | |||||
| 2025-08-01 | 13F | Envestnet Asset Management Inc | 749,603 | 1.80 | 15,487 | 7.41 | ||||
| 2025-07-31 | 13F | Washington Trust Advisors, Inc. | 196 | 0.00 | 4 | 33.33 | ||||
| 2025-08-08 | 13F | Hartland & Co., LLC | 71 | 0.00 | 1 | 0.00 | ||||
| 2025-07-02 | 13F | Marotta Asset Management | 12,084 | -10.70 | 250 | -24.32 | ||||
| 2025-08-13 | 13F | Quadrature Capital Ltd | 0 | -100.00 | 0 | |||||
| 2025-08-07 | 13F | Allworth Financial LP | 983 | 35.77 | 20 | 42.86 | ||||
| 2025-08-07 | 13F | Parkside Financial Bank & Trust | 334 | 73.96 | 7 | 100.00 | ||||
| 2025-08-14 | 13F | Jain Global LLC | 35,281 | 56.44 | 729 | 65.08 | ||||
| 2025-07-31 | 13F | Caitong International Asset Management Co., Ltd | 5,809 | 200.83 | 120 | 224.32 | ||||
| 2025-08-12 | 13F | LPL Financial LLC | 250,829 | 22.73 | 5,182 | 29.52 | ||||
| 2025-08-13 | 13F | Quantbot Technologies LP | 0 | -100.00 | 0 | |||||
| 2025-08-21 | NP | MNCSX - Mercer Non-US Core Equity Fund Class I | 179,676 | 3,712 | ||||||
| 2025-08-05 | 13F | Simplex Trading, Llc | 5,630 | -91.13 | 0 | -100.00 | ||||
| 2025-07-30 | 13F | Legacy Wealth Asset Management, LLC | 47,018 | -4.76 | 971 | 0.52 | ||||
| 2025-08-14 | 13F | Optiver Holding B.V. | 155,954 | 3,222 | ||||||
| 2025-08-18 | 13F | Geneos Wealth Management Inc. | 509 | 2.21 | 11 | 11.11 | ||||
| 2025-07-24 | 13F | Ronald Blue Trust, Inc. | 9,871 | 33.16 | 204 | 40.00 | ||||
| 2025-08-12 | 13F | Pathstone Holdings, LLC | 14,002 | -9.07 | 289 | -3.99 | ||||
| 2025-08-14 | 13F | Riggs Asset Managment Co. Inc. | 50 | 0.00 | 1 | |||||
| 2025-08-07 | 13F | Vise Technologies, Inc. | 14,458 | 12.15 | 299 | 10.78 | ||||
| 2025-08-08 | 13F | SG Americas Securities, LLC | 16,314 | -28.74 | 0 | |||||
| 2025-08-22 | NP | FENI - Fidelity Enhanced International ETF | 232,753 | 9.21 | 4,809 | 15.22 | ||||
| 2025-08-12 | 13F | Jpmorgan Chase & Co | 933,309 | 17.03 | 19,282 | 23.49 | ||||
| 2025-05-15 | 13F | Bamco Inc /ny/ | 0 | -100.00 | 0 | -100.00 | ||||
| 2025-08-15 | 13F | Great West Life Assurance Co /can/ | 2,526 | 11.57 | 0 | |||||
| 2025-08-14 | 13F | Ubs Oconnor Llc | 158,719 | 120.82 | 3,279 | 133.05 | ||||
| 2025-08-11 | 13F | Anderson Financial Strategies, LLC | 0 | -100.00 | 0 | |||||
| 2025-08-01 | 13F | Bessemer Group Inc | 231 | 0.00 | 0 | |||||
| 2025-08-04 | 13F | Atria Investments Llc | 30,565 | -1.53 | 631 | 3.95 | ||||
| 2025-08-13 | 13F | Walleye Capital LLC | 0 | -100.00 | 0 | |||||
| 2025-08-13 | 13F | Jones Financial Companies Lllp | 1,511 | 13.78 | 31 | 15.38 | ||||
| 2025-08-12 | 13F | AIMZ Investment Advisors, LLC | 165,880 | -1.13 | 3,427 | 4.32 | ||||
| 2025-08-13 | 13F | Level Four Advisory Services, Llc | 64,925 | 24.77 | 1,341 | 31.73 | ||||
| 2025-08-05 | 13F | Bank of New York Mellon Corp | 56,202 | 4.95 | 1,161 | 10.78 | ||||
| 2025-08-11 | 13F | NewEdge Wealth, LLC | 0 | -100.00 | 0 | |||||
| 2025-08-08 | 13F | Abc Arbitrage Sa | 447,055 | 9,236 | ||||||
| 2025-06-26 | NP | DFAX - Dimensional World ex U.S. Core Equity 2 ETF | 1,020 | 0.00 | 22 | 5.00 | ||||
| 2025-08-27 | NP | TPIAX - Timothy Plan International Fund Class A | 100,000 | 0.00 | 2,066 | 5.52 | ||||
| 2025-07-29 | 13F | Private Trust Co Na | 8 | 0.00 | 0 | |||||
| 2025-05-15 | 13F/A | Orion Portfolio Solutions, LLC | 21,263 | 22.37 | 416 | 14.92 | ||||
| 2025-08-14 | 13F | Synovus Financial Corp | 34,798 | 7.60 | 719 | 13.43 | ||||
| 2025-08-13 | 13F | Skandinaviska Enskilda Banken AB (publ) | 23,887 | 0.00 | 494 | 5.57 | ||||
| 2025-07-18 | 13F | Truist Financial Corp | 26,526 | -8.50 | 548 | -3.35 | ||||
| 2025-07-28 | NP | IBBQ - Invesco Nasdaq Biotechnology ETF This fund is a listed as child fund of Invesco Ltd. and if that institution has disclosed ownership in this security, then these positions will not be double counted when calculating total shares and total value | 1,655 | 3.63 | 35 | -5.56 | ||||
| 2025-08-13 | 13F | Marshall Wace, Llp | 1,907,284 | -12.57 | 39,404 | -7.75 | ||||
| 2025-05-15 | 13F | Old Mission Capital Llc | 0 | -100.00 | 0 | -100.00 | ||||
| 2025-05-15 | 13F | Aquatic Capital Management LLC | 0 | -100.00 | 0 | |||||
| 2025-08-08 | 13F | Avantax Advisory Services, Inc. | 71,635 | -1.05 | 1,480 | 4.38 | ||||
| 2025-08-07 | 13F | Acadian Asset Management Llc | 0 | -100.00 | 0 | |||||
| 2025-07-21 | 13F | Cromwell Holdings LLC | 648 | 13 | ||||||
| 2025-08-28 | NP | IBB - iShares Nasdaq Biotechnology ETF | 2,512,991 | -15.81 | 51,918 | -11.17 | ||||
| 2025-05-13 | 13F | Employees Retirement System of Texas | 0 | -100.00 | 0 | |||||
| 2025-08-14 | 13F | Sei Investments Co | 62,111 | 1.56 | 1,283 | 7.18 | ||||
| 2025-07-28 | NP | AVDE - Avantis International Equity ETF This fund is a listed as child fund of American Century Companies Inc and if that institution has disclosed ownership in this security, then these positions will not be double counted when calculating total shares and total value | 198,035 | 32.86 | 4,149 | 22.72 | ||||
| 2025-07-14 | 13F | Abound Wealth Management | 7 | 0.00 | 0 | |||||
| 2025-07-31 | 13F | Oppenheimer Asset Management Inc. | 254,551 | 2.04 | 5,259 | 7.68 | ||||
| 2025-08-14 | 13F | Fmr Llc | 680,533 | 40.36 | 14,060 | 48.10 | ||||
| 2025-08-12 | 13F | Proequities, Inc. | 0 | 0 | ||||||
| 2025-08-14 | 13F | Millennium Management Llc | 386,296 | -55.54 | 7,981 | -53.09 | ||||
| 2025-07-25 | 13F | Cwm, Llc | 1,797 | 50.50 | 0 |
Other Listings
| DE:GE91 | € 23.40 |