Mga Batayang Estadistika
| Pemilik Institusional | 188 total, 188 long only, 0 short only, 0 long/short - change of 12.50% MRQ |
| Alokasi Portofolio Rata-rata | 0.4909 % - change of -4.27% MRQ |
| Saham Institusional (Jangka Panjang) | 25,957,432 (ex 13D/G) - change of 4.28MM shares 19.75% MRQ |
| Nilai Institusional (Jangka Panjang) | $ 1,014,617 USD ($1000) |
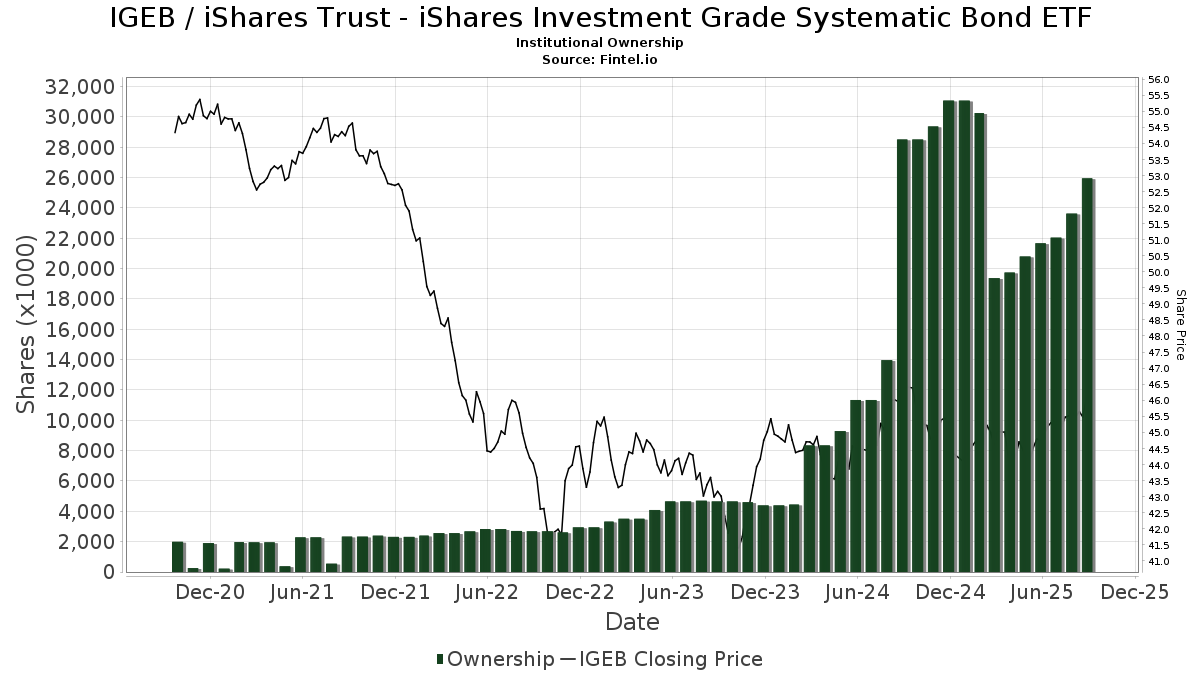
Kepemilikan Institusional dan Pemegang Saham
iShares Trust - iShares Investment Grade Systematic Bond ETF (US:IGEB) memiliki 188 pemilik institusional dan pemegang saham yang telah mengajukan formulir 13D/G atau 13F kepada Komisi Bursa Efek (Securities Exchange Commission/SEC). Lembaga-lembaga ini memegang total 25,957,432 saham. Pemegang saham terbesar meliputi Envestnet Asset Management Inc, LPL Financial LLC, State of New Jersey Common Pension Fund D, Bank Of America Corp /de/, Ameriprise Financial Inc, Fundamentun, Llc, Hennion & Walsh Asset Management, Inc., Cwm, Llc, Mml Investors Services, Llc, and Resources Investment Advisors, LLC. .
Struktur kepemilikan institusional iShares Trust - iShares Investment Grade Systematic Bond ETF (BATS:IGEB) menunjukkan posisi terkini di perusahaan oleh institusi dan dana, serta perubahan terbaru dalam ukuran posisi. Pemegang saham utama dapat mencakup investor individu, reksa dana, dana lindung nilai, atau institusi. Jadwal 13D menunjukkan bahwa investor memegang (atau pernah memegang) lebih dari 5% saham perusahaan dan bermaksud (atau pernah bermaksud) untuk secara aktif mengejar perubahan strategi bisnis. Jadwal 13G menunjukkan investasi pasif lebih dari 5%.
The share price as of September 5, 2025 is 45.91 / share. Previously, on September 6, 2024, the share price was 46.13 / share. This represents a decline of 0.48% over that period.
Skor Sentimen Dana
Skor Sentimen Dana (sebelumnya dikenal sebagai Skor Akumulasi Kepemilikan) menemukan saham-saham yang paling banyak dibeli oleh dana. Ini adalah hasil dari model kuantitatif multi-faktor yang canggih yang mengidentifikasi perusahaan dengan tingkat akumulasi institusional tertinggi. Model penilaian menggunakan kombinasi dari total peningkatan pemilik yang diungkapkan, perubahan dalam alokasi portofolio pada pemilik tersebut, dan metrik lainnya. Angka berkisar dari 0 hingga 100, dengan angka yang lebih tinggi menunjukkan tingkat akumulasi yang lebih tinggi dibandingkan dengan perusahaan sejenisnya, dan 50 adalah rata-ratanya.
Frekuensi Pembaruan: Setiap Hari
Lihat Ownership Explorer, yang menyediakan daftar perusahaan dengan peringkat tertinggi.
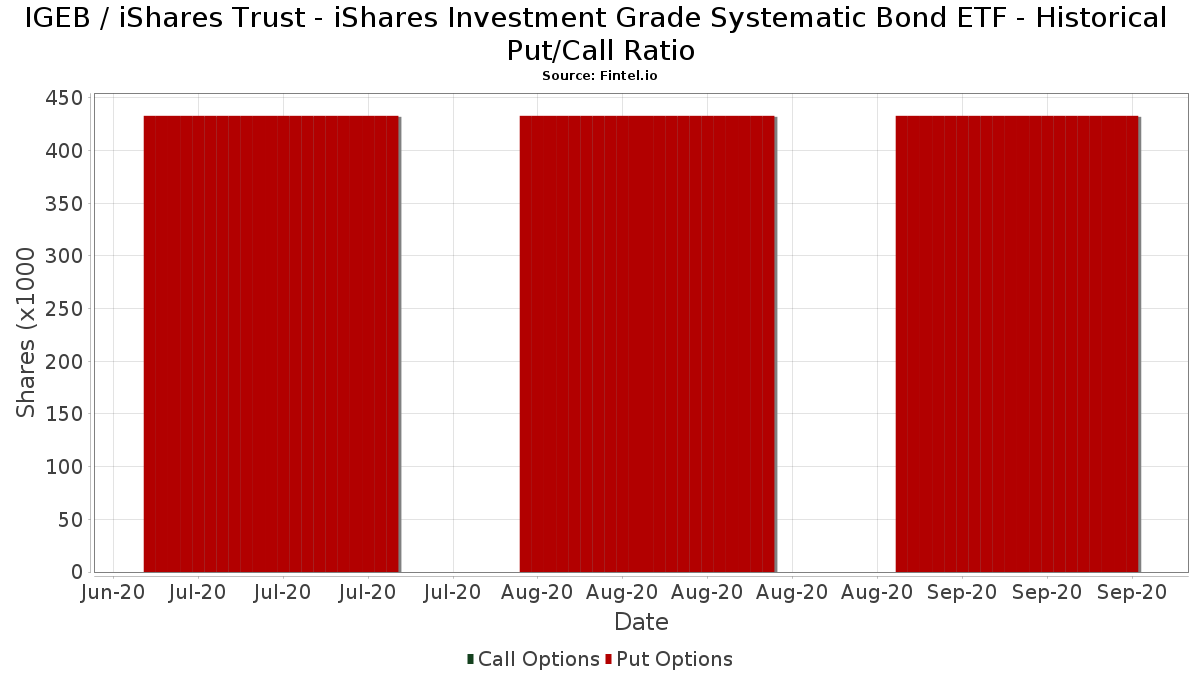
Rasio Put/Call Institusional
Selain melaporkan isu ekuitas dan utang standar, institusi dengan aset di bawah manajemen lebih dari 100 juta dolar AS juga harus mengungkapkan kepemilikan opsi put dan call mereka. Karena opsi put umumnya menunjukkan sentimen negatif, dan opsi call menunjukkan sentimen positif, kita dapat mengetahui sentimen institusional secara keseluruhan dengan memplot rasio put terhadap call. Grafik di sebelah kanan memplot rasio put/call historis untuk instrumen ini.
Menggunakan Rasio Put/Call sebagai indikator sentimen investor mengatasi salah satu kekurangan utama dari penggunaan total kepemilikan institusional, yaitu sejumlah besar aset yang dikelola diinvestasikan secara pasif untuk melacak indeks. Dana yang dikelola secara pasif biasanya tidak membeli opsi, sehingga indikator rasio put/call lebih akurat dalam melacak sentimen dana yang dikelola secara aktif.
Pengajuan 13F dan NPORT
Detail pada pengajuan 13F tersedia gratis. Detail pada pengajuan NP memerlukan keanggotaan premium. Baris berwarna hijau menunjukkan posisi baru. Baris berwarna merah menunjukkan posisi yang sudah ditutup. Klik tautan ini ikon untuk melihat riwayat transaksi selengkapnya.
Tingkatkan
untuk membuka data premium dan mengekspor ke Excel ![]() .
.
| Tanggal File | Sumber | Investor | Ketik | Presyo ng Avg (Silangan) |
Saham | Δ Saham (%) |
Dilaporkan Nilai ($1000) |
Nilai Δ (%) |
Alokasi Port (%) |
|
|---|---|---|---|---|---|---|---|---|---|---|
| 2025-05-12 | 13F | CFS Investment Advisory Services, LLC | 0 | -100.00 | 0 | |||||
| 2025-05-14 | 13F | Oarsman Capital, Inc. | 0 | -100.00 | 0 | |||||
| 2025-07-09 | 13F | Breakwater Capital Group | 94,737 | 8.87 | 4,305 | 9.91 | ||||
| 2025-07-18 | 13F | SigFig Wealth Management, LLC | 5,494 | 249 | ||||||
| 2025-07-28 | 13F | Axxcess Wealth Management, Llc | 10,687 | -11.04 | 486 | -10.19 | ||||
| 2025-08-06 | 13F | North Capital, Inc. | 102 | 0.99 | 5 | 0.00 | ||||
| 2025-07-09 | 13F | Fermata Advisors, LLC | 44,117 | 13.38 | 2,005 | 14.45 | ||||
| 2025-06-26 | NP | FCBD - Frontier Asset Core Bond ETF | 49,966 | -23.85 | 2,233 | -23.66 | ||||
| 2025-07-17 | 13F | Altus Wealth Management, LLC | 43,389 | -1.16 | 1,972 | -0.20 | ||||
| 2025-07-08 | 13F | Parallel Advisors, LLC | 47,549 | -28.89 | 2,161 | -28.22 | ||||
| 2025-08-14 | 13F | Diversify Advisory Services, LLC | 4,967 | 226 | ||||||
| 2025-08-14 | 13F | Susquehanna International Group, Llp | 66,480 | 1,035.83 | 3,021 | 1,048.29 | ||||
| 2025-08-11 | 13F | Copperleaf Capital, LLC | 0 | -100.00 | 0 | |||||
| 2025-07-29 | 13F | Two West Capital Advisors LLC | 22,899 | 13.92 | 1,036 | 18.13 | ||||
| 2025-07-25 | 13F | Cwm, Llc | 783,778 | -1.25 | 36 | 0.00 | ||||
| 2025-04-28 | 13F | Fedenia Advisers LLC | 0 | -100.00 | 0 | |||||
| 2025-08-15 | 13F | Morgan Stanley | 556,092 | 47.41 | 25,269 | 48.81 | ||||
| 2025-08-15 | 13F | High Falls Advisors, Inc | 9,806 | 446 | ||||||
| 2025-05-07 | 13F | Spectrum Wealth Counsel, LLC | 7,255 | 25.71 | 327 | 27.34 | ||||
| 2025-08-12 | 13F | BlackRock, Inc. | 596,006 | 3.66 | 27,083 | 4.64 | ||||
| 2025-08-13 | 13F | Flow Traders U.s. Llc | 0 | -100.00 | 0 | |||||
| 2025-08-14 | 13F | Ancora Advisors, LLC | 52 | -23.53 | 2 | -33.33 | ||||
| 2025-08-19 | 13F | Advisory Services Network, LLC | 53,467 | -0.62 | 2,421 | -0.04 | ||||
| 2025-07-21 | 13F | Ascent Group, LLC | 46,813 | 2.26 | 2,127 | 3.25 | ||||
| 2025-07-31 | 13F | State of New Jersey Common Pension Fund D | 1,621,932 | 0.00 | 73,701 | 0.95 | ||||
| 2025-07-16 | 13F | ORG Partners LLC | 72,939 | 5.73 | 3,314 | 6.94 | ||||
| 2025-08-11 | 13F | United Capital Financial Advisers, Llc | 331,206 | 8.31 | 15,050 | 9.34 | ||||
| 2025-08-06 | 13F | Centerpoint Advisory Group | 15,397 | -2.87 | 700 | -1.96 | ||||
| 2025-07-25 | 13F | Sequoia Financial Advisors, LLC | 4,447 | 202 | ||||||
| 2025-08-05 | 13F | GPS Wealth Strategies Group, LLC | 300 | 0.00 | 14 | 0.00 | ||||
| 2025-08-26 | NP | EVTTX - The E-Valuator Conservative/Moderate (30%-50%) RMS Fund Service Class Shares | 15,812 | 9.40 | 718 | 10.46 | ||||
| 2025-06-26 | NP | FOPC - Frontier Asset Opportunistic Credit ETF | 125,662 | -2.11 | 5,617 | -1.85 | ||||
| 2025-08-05 | 13F | Key FInancial Inc | 75 | 3 | ||||||
| 2025-07-24 | 13F | JB Capital LLC | 32,960 | 1,498 | ||||||
| 2025-08-06 | 13F | AE Wealth Management LLC | 1,042 | 9.45 | 47 | 11.90 | ||||
| 2025-08-26 | NP | EVAGX - The E-Valuator Aggressive Growth (85%-99%) RMS Fund Service Class Shares | 4,794 | -72.72 | 218 | -72.53 | ||||
| 2025-07-29 | 13F | Hoese & Co LLP | 59,519 | 6.90 | 2,704 | 7.90 | ||||
| 2025-08-26 | NP | EVMLX - The E-Valuator Moderate (50%-70%) RMS Fund Service Class Shares | 35,776 | -27.66 | 1,626 | -27.00 | ||||
| 2025-08-26 | NP | EVGLX - The E-Valuator Growth (70%-85%) RMS Fund Service Class Shares | 37,151 | 7.74 | 1,688 | 8.83 | ||||
| 2025-08-14 | 13F | Wells Fargo & Company/mn | 9,250 | 3,004.03 | 420 | 3,130.77 | ||||
| 2025-08-13 | 13F | Argyle Capital Partners, LLC | 9,233 | 0.00 | 420 | 0.96 | ||||
| 2025-08-14 | 13F | Mml Investors Services, Llc | 746,919 | 31.61 | 34 | 32.00 | ||||
| 2025-07-29 | 13F | Riverbend Wealth Management, LLC | 6,587 | 299 | ||||||
| 2025-04-24 | 13F | Kraft, Davis & Associates, LLC | 0 | -100.00 | 0 | |||||
| 2025-08-07 | 13F | Hennion & Walsh Asset Management, Inc. | 794,619 | -29.75 | 36,107 | -29.07 | ||||
| 2025-07-25 | 13F | Investment Advisory Group, LLC | 7,644 | 0.00 | 347 | 0.87 | ||||
| 2025-08-05 | 13F | Scarborough Advisors, LLC | 571 | 26 | ||||||
| 2025-08-14 | 13F | Mariner, LLC | 5,378 | -1.61 | 244 | -0.81 | ||||
| 2025-07-25 | 13F | Envestnet Portfolio Solutions, Inc. | 165,106 | 245.89 | 7,502 | 249.26 | ||||
| 2025-08-14 | 13F | Guardian Wealth Advisors, Llc / Nc | 188 | 0.00 | 9 | 0.00 | ||||
| 2025-07-31 | 13F | Glass Jacobson Investment Advisors llc | 0 | -100.00 | 0 | |||||
| 2025-08-06 | 13F | Commonwealth Equity Services, Llc | 236,912 | 11 | ||||||
| 2025-08-12 | 13F | Steward Partners Investment Advisory, Llc | 60,272 | 19.37 | 2,739 | 20.51 | ||||
| 2025-08-07 | 13F | Shared Vision Wealth Group LLC | 54,119 | 53.47 | 2,450 | 54.38 | ||||
| 2025-08-14 | 13F | Jane Street Group, Llc | 35,406 | -77.23 | 1,609 | -77.03 | ||||
| 2025-09-04 | 13F/A | Advisor Group Holdings, Inc. | 86,348 | 44.21 | 3,924 | 45.55 | ||||
| 2025-07-24 | 13F | MA Private Wealth | 26,874 | 26.60 | 1,221 | 27.85 | ||||
| 2025-07-10 | 13F | Exchange Traded Concepts, Llc | 170,504 | -7.83 | 7,748 | -6.95 | ||||
| 2025-08-04 | 13F | Wealth Management Associates, Inc. | 24,631 | 2.06 | 1,119 | 3.04 | ||||
| 2025-08-14 | 13F | UBS Group AG | 336,739 | 15.54 | 15,301 | 16.65 | ||||
| 2025-07-23 | 13F | Prime Capital Investment Advisors, LLC | 35,134 | -5.17 | 1,596 | -4.26 | ||||
| 2025-08-05 | 13F | Huntington National Bank | 0 | |||||||
| 2025-08-11 | 13F | Nations Financial Group Inc, /ia/ /adv | 14,898 | 27.19 | 677 | 28.27 | ||||
| 2025-07-17 | 13F | Patton Albertson Miller Group, Llc | 25,228 | -40.33 | 1,146 | -39.75 | ||||
| 2025-07-09 | 13F | Keystone Wealth Services, LLC | 25,337 | 0.02 | 1,151 | 0.96 | ||||
| 2025-07-17 | 13F | HB Wealth Management, LLC | 29,676 | -1.75 | 1,348 | -0.81 | ||||
| 2025-05-09 | 13F | Emerald Investment Partners, Llc | 0 | -100.00 | 0 | |||||
| 2025-07-29 | 13F | Fundamentun, Llc | 915,748 | 3.26 | 41,612 | 4.24 | ||||
| 2025-08-14 | 13F | Royal Bank Of Canada | 490,925 | 4.11 | 22,307 | 5.11 | ||||
| 2025-07-23 | 13F | Steel Peak Wealth Management LLC | 12,401 | 5.09 | 564 | 6.03 | ||||
| 2025-07-31 | 13F | Cambridge Investment Research Advisors, Inc. | 442,957 | 6.86 | 20 | 11.11 | ||||
| 2025-08-18 | 13F | Geneos Wealth Management Inc. | 253,227 | 51.42 | 11,507 | 52.86 | ||||
| 2025-07-25 | 13F | NorthRock Partners, LLC | 6,441 | -80.76 | 293 | -80.62 | ||||
| 2025-07-16 | 13F | Eagle Global Advisors Llc | 15,870 | 0.76 | 721 | 1.84 | ||||
| 2025-07-11 | 13F | SILVER OAK SECURITIES, Inc | 32,594 | -1.01 | 1,481 | 0.14 | ||||
| 2025-08-14 | 13F | IHT Wealth Management, LLC | 10,593 | -41.58 | 481 | -41.05 | ||||
| 2025-07-14 | 13F | Caitlin John, LLC | 5,999 | -4.76 | 273 | -3.89 | ||||
| 2025-04-23 | 13F | Keystone Financial Services | 0 | -100.00 | 0 | |||||
| 2025-08-13 | 13F | Kilter Group LLC | 1 | 0 | ||||||
| 2025-08-11 | 13F | Tidemark, LLC | 12,006 | -21.97 | 546 | -21.24 | ||||
| 2025-07-29 | 13F | Liberty Square Wealth Partners Llc | 4,805 | 0.00 | 218 | 0.93 | ||||
| 2025-08-14 | 13F | Icon Wealth Advisors, LLC | 5,710 | 50.86 | 259 | 52.35 | ||||
| 2025-07-17 | 13F | Beacon Capital Management, LLC | 245 | 0.00 | 11 | 0.00 | ||||
| 2025-08-08 | 13F | Pnc Financial Services Group, Inc. | 5,410 | -5.72 | 246 | -5.04 | ||||
| 2025-08-14 | 13F | Integrated Wealth Concepts LLC | 167,173 | 24.61 | 7,596 | 25.80 | ||||
| 2025-04-17 | 13F | KC Investment Advisors, LLC | 0 | -100.00 | 0 | |||||
| 2025-08-12 | 13F | Change Path, LLC | 23,603 | 1,072 | ||||||
| 2025-08-12 | 13F | Global Retirement Partners, LLC | 1,860 | 358.13 | 85 | 366.67 | ||||
| 2025-08-14 | 13F | Ameriprise Financial Inc | 996,346 | 15.25 | 45,267 | 16.35 | ||||
| 2025-08-14 | 13F | Raymond James Financial Inc | 113,763 | -18.17 | 5,169 | -17.39 | ||||
| 2025-08-14 | 13F | Colony Group, LLC | 7,560 | 344 | ||||||
| 2025-08-28 | NP | GPMIX - GuidePath(R) Multi-Asset Income Allocation Fund Service Shares | 30,362 | 1,380 | ||||||
| 2025-08-11 | 13F | Aptus Capital Advisors, LLC | 188 | 0.00 | 9 | 0.00 | ||||
| 2025-08-12 | 13F | FreeGulliver LLC | 53,387 | 1.99 | 2,426 | 2.97 | ||||
| 2025-07-25 | 13F | Atria Wealth Solutions, Inc. | 10,839 | 493 | ||||||
| 2025-05-14 | 13F | WCG Wealth Advisors LLC | 0 | -100.00 | 0 | |||||
| 2025-07-21 | 13F | Ameritas Advisory Services, LLC | 1,123 | 51 | ||||||
| 2025-07-24 | 13F | Us Bancorp \de\ | 6 | 0 | ||||||
| 2025-07-17 | 13F | Janney Montgomery Scott LLC | 508,100 | -1.86 | 23 | 0.00 | ||||
| 2025-04-30 | 13F | Horst & Graben Wealth Management LLC | 0 | -100.00 | 0 | |||||
| 2025-07-21 | 13F | Ameriflex Group, Inc. | 3,285 | 1.26 | 149 | 1.37 | ||||
| 2025-08-11 | 13F | Strategic Wealth Partners, Ltd. | 641 | 29 | ||||||
| 2025-08-13 | 13F | Continuum Advisory, LLC | 0 | -100.00 | 0 | |||||
| 2025-07-25 | 13F | Lion Street Advisors, LLC | 15,000 | -5.08 | 682 | -4.22 | ||||
| 2025-08-13 | 13F | Cerity Partners LLC | 8,614 | -54.76 | 391 | -54.32 | ||||
| 2025-08-07 | 13F | New England Private Wealth Advisors LLC | 6,674 | 1.64 | 303 | 2.71 | ||||
| 2025-06-26 | NP | BYLD - iShares Yield Optimized Bond ETF | 561,855 | 220.78 | 25,115 | 221.56 | ||||
| 2025-07-29 | 13F | Systelligence, LLC | 140,496 | -10.50 | 6,384 | -9.64 | ||||
| 2025-07-22 | 13F | Merit Financial Group, LLC | 248,811 | 29.49 | 11,306 | 30.72 | ||||
| 2025-07-10 | 13F | Sovran Advisors, LLC | 29,726 | 52.90 | 1,336 | 55.17 | ||||
| 2025-04-14 | 13F | Bangor Savings Bank | 0 | -100.00 | 0 | |||||
| 2025-08-06 | 13F | Able Wealth Management LLC | 12,936 | -22.30 | 588 | -21.63 | ||||
| 2025-08-11 | 13F | TD Waterhouse Canada Inc. | 2,167 | -98.14 | 98 | -98.13 | ||||
| 2025-04-24 | 13F | Tsfg, Llc | 0 | -100.00 | 0 | |||||
| 2025-08-14 | 13F | Ausdal Financial Partners, Inc. | 11,288 | 513 | ||||||
| 2025-07-25 | 13F | Apollon Wealth Management, LLC | 19,372 | -2.42 | 880 | -1.46 | ||||
| 2025-04-29 | 13F | Raleigh Capital Management Inc. | 0 | -100.00 | 0 | |||||
| 2025-08-13 | 13F | Vertex Planning Partners, LLC | 13,601 | 3.26 | 618 | 4.39 | ||||
| 2025-08-01 | 13F | Envestnet Asset Management Inc | 3,138,485 | 68.50 | 142,613 | 70.11 | ||||
| 2025-08-12 | 13F | Ade, Llc | 11,294 | 21.30 | 513 | 22.43 | ||||
| 2025-08-13 | 13F | Capital Analysts, Inc. | 1,695 | -10.84 | 0 | |||||
| 2025-08-14 | 13F | Stifel Financial Corp | 145,237 | 7.61 | 6,600 | 8.64 | ||||
| 2025-07-29 | 13F | Swmg, Llc | 42,563 | 2.27 | 1,924 | 3.39 | ||||
| 2025-08-12 | 13F | Integrated Advisors Network LLC | 5,906 | 268 | ||||||
| 2025-08-06 | 13F | Founders Financial Securities Llc | 39,458 | -14.03 | 1,793 | -12.80 | ||||
| 2025-08-11 | 13F | Cornerstone Planning Group LLC | 3 | 0.00 | 0 | |||||
| 2025-05-15 | 13F | Concorde Asset Management, LLC | 0 | -100.00 | 0 | |||||
| 2025-07-24 | 13F | Cyndeo Wealth Partners, LLC | 14,651 | 11.26 | 666 | 12.33 | ||||
| 2025-07-11 | 13F | Farther Finance Advisors, LLC | 29,703 | -19.81 | 1,350 | -18.93 | ||||
| 2025-07-25 | 13F | Midwest Capital Advisors, LLC | 544 | -67.52 | 25 | -68.00 | ||||
| 2025-07-15 | 13F | FLP Wealth Management, LLC | 0 | -100.00 | 0 | |||||
| 2025-08-12 | 13F | Proequities, Inc. | 0 | 0 | ||||||
| 2025-08-14 | 13F | Harwood Advisory Group, LLC | 0 | -100.00 | 0 | |||||
| 2025-08-14 | 13F | Peapack Gladstone Financial Corp | 59,620 | 2.32 | 3 | 0.00 | ||||
| 2025-07-28 | 13F | BRYN MAWR TRUST Co | 725 | 0.00 | 33 | 0.00 | ||||
| 2025-08-12 | 13F | LPL Financial LLC | 2,016,169 | 42.51 | 91,615 | 43.87 | ||||
| 2025-07-28 | 13F | RFG Advisory, LLC | 25,164 | 13.31 | 1,143 | 14.41 | ||||
| 2025-08-08 | 13F | Cetera Investment Advisers | 243,872 | 60.09 | 11,082 | 61.62 | ||||
| 2025-07-08 | 13F | Nbc Securities, Inc. | 594 | 0 | ||||||
| 2025-07-28 | 13F | Harbour Investments, Inc. | 98,181 | 1.75 | 4,461 | 2.74 | ||||
| 2025-08-14 | 13F | Sunbelt Securities, Inc. | 59 | -1.67 | 3 | 0.00 | ||||
| 2025-07-14 | 13F | Park Avenue Securities Llc | 148,338 | 87.24 | 7 | 100.00 | ||||
| 2025-08-26 | NP | EVVLX - The E-Valuator Very Conservative (0%-15%) RMS Fund Service Class Shares | 16,771 | 63.14 | 762 | 64.94 | ||||
| 2025-04-22 | 13F | Synergy Financial Management, LLC | 0 | -100.00 | 0 | |||||
| 2025-07-28 | 13F | Sagespring Wealth Partners, Llc | 27,461 | 24.32 | 1,248 | 25.45 | ||||
| 2025-08-14 | 13F | Atomi Financial Group, Inc. | 0 | -100.00 | 0 | |||||
| 2025-08-14 | 13F | Mercer Global Advisors Inc /adv | 13,249 | -53.32 | 602 | -52.86 | ||||
| 2025-04-01 | 13F | Oliver Lagore Vanvalin Investment Group | 0 | -100.00 | 0 | |||||
| 2025-07-18 | 13F | Precision Wealth Strategies, LLC | 5,063 | 230 | ||||||
| 2025-07-03 | 13F | CPA Asset Management LLC | 129,973 | 8.80 | 5,906 | 9.84 | ||||
| 2025-07-17 | 13F | Kelly Financial Services LLC | 59,595 | 2,708 | ||||||
| 2025-08-08 | 13F | Avantax Advisory Services, Inc. | 6,676 | 26.22 | 303 | 27.31 | ||||
| 2025-08-07 | 13F | 1620 Investment Advisors, Inc. | 14,740 | 5.66 | 670 | 6.70 | ||||
| 2025-08-12 | 13F | BlueStem Wealth Partners, LLC | 171,004 | -37.83 | 7,770 | -37.24 | ||||
| 2025-08-14 | 13F | Citadel Advisors Llc | 127,589 | 353.41 | 5,798 | 357.90 | ||||
| 2025-08-27 | 13F/A | Brinker Capital Investments, LLC | 10,383 | 472 | ||||||
| 2025-07-02 | 13F | Waller Financial Planning Group, Inc | 495,159 | 1.34 | 22,500 | 2.31 | ||||
| 2025-05-08 | 13F | Hoxton Planning & Management, LLC | 0 | -100.00 | 0 | |||||
| 2025-07-17 | 13F | Paradigm Financial Partners, Llc | 60,195 | 10.13 | 2,735 | 11.18 | ||||
| 2025-07-30 | 13F | LGT Financial Advisors LLC | 1,759 | 80 | ||||||
| 2025-07-22 | 13F | Accel Wealth Management | 67,138 | 4.52 | 3,051 | 5.50 | ||||
| 2025-07-23 | 13F | REAP Financial Group, LLC | 687 | 0.00 | 31 | 3.33 | ||||
| 2025-08-14 | 13F | Fmr Llc | 70 | -45.31 | 3 | -40.00 | ||||
| 2025-08-04 | 13F | Pensionmark Financial Group, Llc | 8,660 | 94.39 | 394 | 96.50 | ||||
| 2025-07-17 | 13F | Catalytic Wealth RIA, LLC | 11,709 | 10.32 | 532 | 11.53 | ||||
| 2025-08-14 | 13F | Comerica Bank | 5,562 | 38.91 | 253 | 40.00 | ||||
| 2025-07-31 | 13F | Forte Asset Management Llc | 20,852 | -22.10 | 948 | -21.35 | ||||
| 2025-08-13 | 13F | Mount Yale Investment Advisors, LLC | 510 | 23 | ||||||
| 2025-04-14 | 13F | RWM Asset Management, LLC | 0 | -100.00 | 0 | -100.00 | ||||
| 2025-07-14 | 13F | McGlone Suttner Wealth Management, Inc. | 272,605 | 3.93 | 12,387 | 4.93 | ||||
| 2025-08-06 | 13F | Convergence Financial, LLC | 27,810 | -3.19 | 1,264 | -2.24 | ||||
| 2025-07-24 | 13F | IFP Advisors, Inc | 109,511 | 71.18 | 4,976 | 72.84 | ||||
| 2025-07-23 | 13F | Dohj, Llc | 23,453 | -71.84 | 1,037 | -72.33 | ||||
| 2025-07-29 | 13F | Spirit Of America Management Corp/ny | 5,570 | 0.69 | 252 | 1.21 | ||||
| 2025-08-13 | 13F | GeoWealth Management, LLC | 11,762 | 10.82 | 534 | 11.95 | ||||
| 2025-08-11 | 13F | Principal Securities, Inc. | 2,407 | -17.54 | 109 | -15.50 | ||||
| 2025-08-12 | 13F | Coldstream Capital Management Inc | 0 | -100.00 | 0 | |||||
| 2025-04-30 | 13F | Phillips Financial Management, Llc | 0 | -100.00 | 0 | |||||
| 2025-08-05 | 13F | Dynasty Wealth Management, Llc | 42,514 | -2.53 | 1,932 | -1.63 | ||||
| 2025-07-21 | 13F | Cliftonlarsonallen Wealth Advisors, Llc | 519,201 | -15.08 | 23,592 | -14.26 | ||||
| 2025-08-14 | 13F | Goldman Sachs Group Inc | 86,656 | 1,105.40 | 3,938 | 1,118.89 | ||||
| 2025-08-06 | 13F | First Horizon Advisors, Inc. | 9,856 | 38.19 | 448 | 39.25 | ||||
| 2025-08-13 | 13F | West Wealth Group, LLC | 7,310 | 333 | ||||||
| 2025-08-15 | 13F | Kestra Advisory Services, LLC | 14,748 | 6.73 | 670 | 7.89 | ||||
| 2025-07-28 | 13F | Lunt Capital Management, Inc. | 75,261 | 2.59 | 3,420 | 3.57 | ||||
| 2025-04-15 | 13F | Collier Financial | 0 | -100.00 | 0 | |||||
| 2025-08-14 | 13F | GWM Advisors LLC | 17,609 | 1.74 | 800 | 2.83 | ||||
| 2025-08-04 | 13F | Twin City Private Wealth, Llc | 8,153 | 112.54 | 370 | 115.12 | ||||
| 2025-08-12 | 13F | Park Square Financial Group, LLC | 46 | 2 | ||||||
| 2025-04-23 | 13F | TSA Wealth Managment LLC | 0 | -100.00 | 0 | |||||
| 2025-05-15 | 13F | Sentinus, LLC | 0 | -100.00 | 0 | |||||
| 2025-07-28 | 13F | DORVAL Corp | 231,061 | 13.15 | 10,499 | 13.47 | ||||
| 2025-08-14 | 13F | Tennessee Valley Asset Management Partners | 0 | -100.00 | 0 | |||||
| 2025-08-26 | NP | EVCLX - The E-Valuator Conservative (15%-30%) RMS Fund Service Class Shares | 30,192 | -1.78 | 1,372 | -0.87 | ||||
| 2025-08-18 | 13F/A | National Bank Of Canada /fi/ | 19,547 | 28.99 | 888 | 30.40 | ||||
| 2025-07-29 | 13F | Private Trust Co Na | 419 | -13.79 | 19 | -9.52 | ||||
| 2025-05-08 | 13F | Arkadios Wealth Advisors | 0 | -100.00 | 0 | |||||
| 2025-07-31 | 13F | Leavell Investment Management, Inc. | 4,705 | -3.59 | 214 | -2.74 | ||||
| 2025-08-01 | 13F | Rossby Financial, LCC | 868 | 19.23 | 39 | 21.88 | ||||
| 2025-07-14 | 13F | AdvisorNet Financial, Inc | 553 | 0.00 | 25 | 4.17 | ||||
| 2025-08-19 | 13F | Cape Investment Advisory, Inc. | 97 | -43.60 | 4 | -42.86 | ||||
| 2025-08-05 | 13F | Sigma Planning Corp | 21,600 | -4.80 | 982 | -3.92 | ||||
| 2025-04-28 | 13F | Buffington Mohr McNeal | 5,875 | -83.90 | 264 | -83.69 | ||||
| 2025-07-23 | 13F | Ameliora Wealth Management Ltd. | 548,401 | 5.15 | 24,919 | 6.15 | ||||
| 2025-07-22 | 13F | Miracle Mile Advisors, LLC | 23,322 | 1,060 | ||||||
| 2025-08-04 | 13F | IFG Advisory, LLC | 5,967 | 16.82 | 271 | 18.34 | ||||
| 2025-08-04 | 13F | Atria Investments Llc | 48,626 | 3.56 | 2,210 | 4.54 | ||||
| 2025-08-14 | 13F | Bank Of America Corp /de/ | 1,132,007 | 88.20 | 51,438 | 90.00 | ||||
| 2025-08-05 | 13F | Bank of New York Mellon Corp | 184,007 | 14.58 | 8,361 | 15.68 | ||||
| 2025-08-06 | 13F | Vestmark Advisory Solutions, Inc. | 87,926 | 3,995 | ||||||
| 2025-07-30 | 13F | DecisionMap Wealth Management, LLC | 6,165 | -5.47 | 280 | -4.44 | ||||
| 2025-04-23 | 13F | Mascagni Wealth Management, Inc. | 0 | -100.00 | 0 | -100.00 | ||||
| 2025-08-04 | 13F | Assetmark, Inc | 157,095 | 7,138 | ||||||
| 2025-08-14 | 13F/A | Rockefeller Capital Management L.P. | 37,499 | 136.02 | 1,704 | 138.18 | ||||
| 2025-05-15 | 13F | Hrt Financial Lp | 0 | -100.00 | 0 | |||||
| 2025-08-14 | 13F | Snowden Capital Advisors LLC | 9,352 | -5.99 | 425 | -5.15 | ||||
| 2025-08-13 | 13F | Jones Financial Companies Lllp | 38 | 2 | ||||||
| 2025-08-14 | 13F | Betterment LLC | 687,332 | 8.26 | 31 | 10.71 | ||||
| 2025-04-21 | 13F | Nelson, Van Denburg & Campbell Wealth Management Group, LLC | 0 | -100.00 | 0 | |||||
| 2025-07-24 | 13F | Certus Wealth Management, LLC | 5,997 | -0.23 | 273 | 2.26 | ||||
| 2025-08-11 | 13F | Private Advisor Group, LLC | 234,158 | 3.58 | 10,640 | 4.57 | ||||
| 2025-08-08 | 13F | Capital Investment Advisory Services, LLC | 126 | 1.61 | 6 | 0.00 | ||||
| 2025-08-12 | 13F | Jpmorgan Chase & Co | 317,402 | 47.00 | 14,423 | 48.41 | ||||
| 2025-08-07 | 13F | Resources Investment Advisors, LLC. | 731,608 | 17.14 | 33,244 | 18.26 |
Other Listings
| MX:IGEB |