Mga Batayang Estadistika
| Pemilik Institusional | 182 total, 182 long only, 0 short only, 0 long/short - change of 5.14% MRQ |
| Alokasi Portofolio Rata-rata | 0.2604 % - change of -21.35% MRQ |
| Saham Institusional (Jangka Panjang) | 4,936,891 (ex 13D/G) - change of 0.65MM shares 15.25% MRQ |
| Nilai Institusional (Jangka Panjang) | $ 609,608 USD ($1000) |
Kepemilikan Institusional dan Pemegang Saham
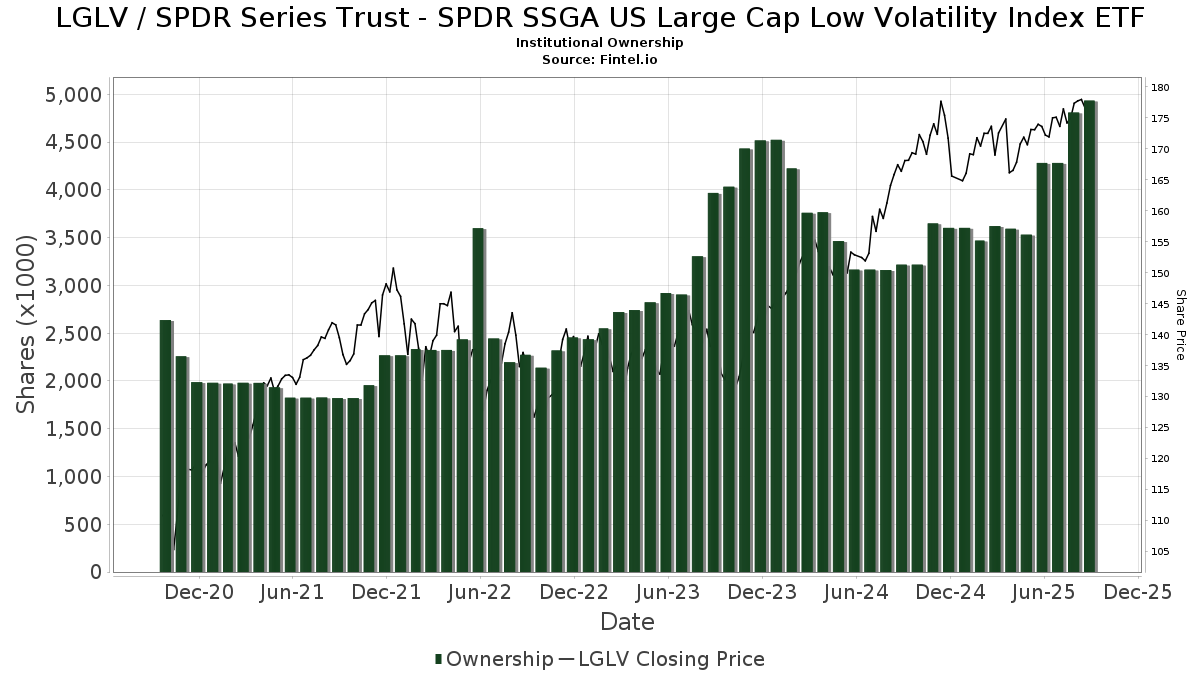
SPDR Series Trust - SPDR SSGA US Large Cap Low Volatility Index ETF (US:LGLV) memiliki 182 pemilik institusional dan pemegang saham yang telah mengajukan formulir 13D/G atau 13F kepada Komisi Bursa Efek (Securities Exchange Commission/SEC). Lembaga-lembaga ini memegang total 4,936,891 saham. Pemegang saham terbesar meliputi Cwm, Llc, Syntegra Private Wealth Group, LLC, Baltimore-Washington Financial Advisors, Inc., Gerber Kawasaki Wealth & Investment Management, LPL Financial LLC, Congress Wealth Management LLC / DE /, Jpmorgan Chase & Co, Morgan Stanley, DORVAL Corp, and State Street Corp .
Struktur kepemilikan institusional SPDR Series Trust - SPDR SSGA US Large Cap Low Volatility Index ETF (ARCA:LGLV) menunjukkan posisi terkini di perusahaan oleh institusi dan dana, serta perubahan terbaru dalam ukuran posisi. Pemegang saham utama dapat mencakup investor individu, reksa dana, dana lindung nilai, atau institusi. Jadwal 13D menunjukkan bahwa investor memegang (atau pernah memegang) lebih dari 5% saham perusahaan dan bermaksud (atau pernah bermaksud) untuk secara aktif mengejar perubahan strategi bisnis. Jadwal 13G menunjukkan investasi pasif lebih dari 5%.
The share price as of September 5, 2025 is 177.30 / share. Previously, on September 6, 2024, the share price was 165.12 / share. This represents an increase of 7.38% over that period.
Skor Sentimen Dana
Skor Sentimen Dana (sebelumnya dikenal sebagai Skor Akumulasi Kepemilikan) menemukan saham-saham yang paling banyak dibeli oleh dana. Ini adalah hasil dari model kuantitatif multi-faktor yang canggih yang mengidentifikasi perusahaan dengan tingkat akumulasi institusional tertinggi. Model penilaian menggunakan kombinasi dari total peningkatan pemilik yang diungkapkan, perubahan dalam alokasi portofolio pada pemilik tersebut, dan metrik lainnya. Angka berkisar dari 0 hingga 100, dengan angka yang lebih tinggi menunjukkan tingkat akumulasi yang lebih tinggi dibandingkan dengan perusahaan sejenisnya, dan 50 adalah rata-ratanya.
Frekuensi Pembaruan: Setiap Hari
Lihat Ownership Explorer, yang menyediakan daftar perusahaan dengan peringkat tertinggi.
Rasio Put/Call Institusional
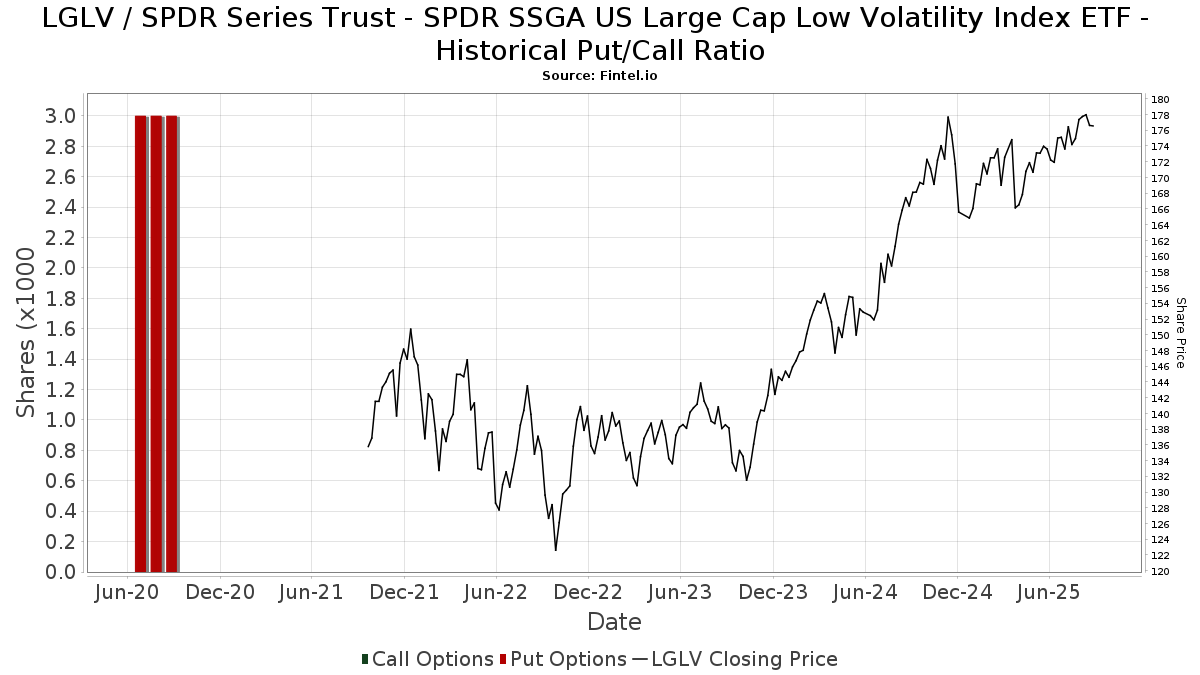
Selain melaporkan isu ekuitas dan utang standar, institusi dengan aset di bawah manajemen lebih dari 100 juta dolar AS juga harus mengungkapkan kepemilikan opsi put dan call mereka. Karena opsi put umumnya menunjukkan sentimen negatif, dan opsi call menunjukkan sentimen positif, kita dapat mengetahui sentimen institusional secara keseluruhan dengan memplot rasio put terhadap call. Grafik di sebelah kanan memplot rasio put/call historis untuk instrumen ini.
Menggunakan Rasio Put/Call sebagai indikator sentimen investor mengatasi salah satu kekurangan utama dari penggunaan total kepemilikan institusional, yaitu sejumlah besar aset yang dikelola diinvestasikan secara pasif untuk melacak indeks. Dana yang dikelola secara pasif biasanya tidak membeli opsi, sehingga indikator rasio put/call lebih akurat dalam melacak sentimen dana yang dikelola secara aktif.
Pengajuan 13F dan NPORT
Detail pada pengajuan 13F tersedia gratis. Detail pada pengajuan NP memerlukan keanggotaan premium. Baris berwarna hijau menunjukkan posisi baru. Baris berwarna merah menunjukkan posisi yang sudah ditutup. Klik tautan ini ikon untuk melihat riwayat transaksi selengkapnya.
Tingkatkan
untuk membuka data premium dan mengekspor ke Excel ![]() .
.
| Tanggal File | Sumber | Investor | Ketik | Presyo ng Avg (Silangan) |
Saham | Δ Saham (%) |
Dilaporkan Nilai ($1000) |
Nilai Δ (%) |
Alokasi Port (%) |
|
|---|---|---|---|---|---|---|---|---|---|---|
| 2025-07-31 | 13F | Sage Mountain Advisors LLC | 18,958 | 0.00 | 3,310 | 0.33 | ||||
| 2025-08-05 | 13F | Hutchens & Kramer Investment Management Group, LLC | 3,209 | -5.09 | 564 | -4.25 | ||||
| 2025-07-16 | 13F/A | CX Institutional | 41 | 0.00 | 0 | |||||
| 2025-08-14 | 13F | Avant Capital LLC | 3,246 | 3.34 | 567 | 3.66 | ||||
| 2025-07-30 | 13F | Paul Damon & Associates, Inc. | 6,183 | -0.48 | 1,080 | -0.19 | ||||
| 2025-08-14 | 13F | Mercer Global Advisors Inc /adv | 1,786 | -5.30 | 312 | -5.18 | ||||
| 2025-07-29 | 13F | Stratos Wealth Partners, LTD. | 2,683 | -4.49 | 469 | -4.10 | ||||
| 2025-08-14 | 13F | Qube Research & Technologies Ltd | 90 | 16 | ||||||
| 2025-08-04 | 13F | Integrity Alliance, Llc. | 57,768 | -35.15 | 10,087 | -34.95 | ||||
| 2025-08-05 | 13F | Tsfg, Llc | 3,718 | -0.99 | 1 | |||||
| 2025-07-22 | 13F | Legacy Trust | 0 | -100.00 | 0 | |||||
| 2025-07-29 | 13F | Private Trust Co Na | 901 | -6.24 | 157 | -5.99 | ||||
| 2025-07-21 | 13F | Ameriflex Group, Inc. | 91 | 0.00 | 16 | 0.00 | ||||
| 2025-07-31 | 13F | Cambridge Investment Research Advisors, Inc. | 12,828 | -42.54 | 2 | -33.33 | ||||
| 2025-08-01 | 13F | Brookwood Investment Group LLC | 1,703 | 0.00 | 297 | 0.34 | ||||
| 2025-07-11 | 13F | SILVER OAK SECURITIES, Inc | 0 | -100.00 | 0 | |||||
| 2025-08-08 | 13F | Avantax Advisory Services, Inc. | 4,751 | -41.97 | 830 | -41.78 | ||||
| 2025-08-11 | 13F | Wealthgarden F.s. Llc | 1,665 | -3.42 | 289 | -4.00 | ||||
| 2025-08-27 | 13F | Barnes Wealth Management Group, Inc | 3,713 | 39.90 | 648 | 40.56 | ||||
| 2025-07-16 | 13F | Signaturefd, Llc | 530 | 0.00 | 93 | 0.00 | ||||
| 2025-07-25 | 13F | Atria Wealth Solutions, Inc. | 1,311 | 229 | ||||||
| 2025-08-14 | 13F | Goldman Sachs Group Inc | 10,760 | -65.02 | 1,879 | -64.92 | ||||
| 2025-08-11 | 13F | Western Wealth Management, LLC | 1,341 | 0.00 | 234 | 0.43 | ||||
| 2025-08-12 | 13F | Financial Advocates Investment Management | 6,961 | -2.81 | 1,215 | -2.49 | ||||
| 2025-07-22 | 13F | Iowa State Bank | 1,660 | -31.09 | 290 | -31.03 | ||||
| 2025-07-29 | 13F | Portland Financial Advisors Inc | 6,062 | 0.00 | 1,058 | 0.28 | ||||
| 2025-08-12 | 13F | Steward Partners Investment Advisory, Llc | 1,501 | -3.22 | 262 | -2.60 | ||||
| 2025-08-11 | 13F | Berkeley, Inc | 2,740 | 0.18 | 478 | 0.42 | ||||
| 2025-05-12 | 13F | Independent Advisor Alliance | 0 | -100.00 | 0 | |||||
| 2025-08-14 | 13F | IHT Wealth Management, LLC | 8,270 | 3.79 | 1,444 | 4.18 | ||||
| 2025-07-16 | 13F | Independent Wealth Network Inc. | 5,970 | -2.56 | 1,042 | -2.25 | ||||
| 2025-08-14 | 13F | Harwood Advisory Group, LLC | 2,254 | -19.64 | 394 | -15.12 | ||||
| 2025-08-13 | 13F | Millington Financial Advisors, LLC | 1,734 | -2.42 | 306 | 3.39 | ||||
| 2025-08-14 | 13F | Bank Of America Corp /de/ | 91,399 | 4.63 | 15,959 | 4.98 | ||||
| 2025-08-06 | 13F | Wedbush Securities Inc | 3,890 | -4.14 | 1 | |||||
| 2025-08-18 | 13F | Geneos Wealth Management Inc. | 369 | 5.43 | 64 | 6.67 | ||||
| 2025-07-31 | 13F | Moloney Securities Asset Management, LLC | 1,379 | -5.87 | 241 | -5.51 | ||||
| 2025-08-26 | 13F/A | Thrivent Financial For Lutherans | 2,261 | 0 | ||||||
| 2025-08-11 | 13F | Vista Cima Wealth Management LLC | 3,044 | 0.00 | 532 | 0.38 | ||||
| 2025-08-14 | 13F | Comerica Bank | 311 | -1.27 | 54 | 0.00 | ||||
| 2025-08-14 | 13F | Daiwa Securities Group Inc. | 9,500 | -5.19 | 2 | 0.00 | ||||
| 2025-08-15 | 13F | Equitable Holdings, Inc. | 0 | -100.00 | 0 | |||||
| 2025-07-30 | 13F | Advantage Trust Co | 219 | 38 | ||||||
| 2025-08-13 | 13F | Fisher Asset Management, LLC | 1,227 | 0.00 | 214 | 0.47 | ||||
| 2025-08-12 | 13F | Jpmorgan Chase & Co | 175,531 | 148.74 | 30,649 | 149.56 | ||||
| 2025-07-09 | 13F | Riversedge Advisors, Llc | 4,936 | -17.86 | 862 | -17.61 | ||||
| 2025-07-17 | 13F | ERn Financial, LLC | 0 | -100.00 | 0 | |||||
| 2025-08-08 | 13F | Fortis Group Advisors, LLC | 7,210 | -2.96 | 1,251 | -3.33 | ||||
| 2025-08-11 | 13F | First American Trust, Fsb | 32,117 | 3.78 | 5,608 | 4.10 | ||||
| 2025-08-06 | 13F | Paladin Advisory Group, LLC | 304 | 0.00 | 53 | 1.92 | ||||
| 2025-08-06 | 13F | Founders Financial Securities Llc | 74,041 | 81.50 | 12,928 | 87.44 | ||||
| 2025-08-14 | 13F | Abound Financial, Llc | 4,558 | -2.25 | 796 | -1.97 | ||||
| 2025-08-14 | 13F | Mariner, LLC | 10,089 | 19.47 | 1,762 | 19.88 | ||||
| 2025-07-09 | 13F | Reyes Financial Architecture, Inc. | 40 | 0.00 | 7 | 0.00 | ||||
| 2025-08-13 | 13F | Jones Financial Companies Lllp | 2,409 | 44.25 | 418 | 45.30 | ||||
| 2025-08-06 | 13F | Atlantic Union Bankshares Corp | 17 | 3 | ||||||
| 2025-07-25 | 13F | Cwm, Llc | 1,380,611 | 69.48 | 241 | 70.92 | ||||
| 2025-08-15 | 13F | Tower Research Capital LLC (TRC) | 472 | -79.97 | 82 | -80.00 | ||||
| 2025-07-28 | 13F | Harbour Investments, Inc. | 4,237 | 2.96 | 740 | 3.21 | ||||
| 2025-08-14 | 13F | Aqr Capital Management Llc | 67,466 | 3.39 | 11,780 | 3.73 | ||||
| 2025-08-14 | 13F | Prestige Wealth Management Group LLC | 0 | -100.00 | 0 | |||||
| 2025-08-14 | 13F | Sei Investments Co | 25,127 | -6.77 | 4,387 | -6.46 | ||||
| 2025-07-22 | 13F | McNaughton Wealth Management, LLC | 15,834 | 4.38 | 2,765 | 4.70 | ||||
| 2025-07-21 | 13F | Investment Planning Advisors, Inc. | 1,300 | 0.00 | 227 | 0.00 | ||||
| 2025-08-12 | 13F | SRS Capital Advisors, Inc. | 619 | 0.49 | 108 | 0.93 | ||||
| 2025-08-14 | 13F | GWM Advisors LLC | 667 | -76.93 | 116 | -76.94 | ||||
| 2025-04-21 | 13F | Nelson, Van Denburg & Campbell Wealth Management Group, LLC | 0 | -100.00 | 0 | |||||
| 2025-08-08 | 13F | Capital Investment Advisory Services, LLC | 17 | 0.00 | 3 | 0.00 | ||||
| 2025-07-28 | 13F | Cypress Wealth Services, LLC | 5,166 | 0.00 | 902 | 0.33 | ||||
| 2025-07-11 | 13F | Mallini Complete Financial Planning LLC | 430 | 2.63 | ||||||
| 2025-08-11 | 13F | Private Advisor Group, LLC | 6,537 | 0.23 | 1,141 | 0.53 | ||||
| 2025-07-24 | 13F | Stonebridge Financial Group, LLC | 1,330 | 232 | ||||||
| 2025-08-01 | 13F | Envestnet Asset Management Inc | 13,241 | 14.52 | 2,312 | 14.91 | ||||
| 2025-08-08 | 13F | Thrive Capital Management, LLC | 5,256 | 918 | ||||||
| 2025-08-14 | 13F | Old Mission Capital Llc | 0 | -100.00 | 0 | |||||
| 2025-08-14 | 13F | Stifel Financial Corp | 1,442 | -66.37 | 252 | -66.35 | ||||
| 2025-08-08 | 13F | Good Life Advisors, LLC | 2,350 | 410 | ||||||
| 2025-05-15 | 13F | Gts Securities Llc | 0 | -100.00 | 0 | |||||
| 2025-08-14 | 13F | Two Sigma Investments, Lp | 21,410 | 3,738 | ||||||
| 2025-04-11 | 13F | Signal Advisors Wealth, LLC | 0 | -100.00 | 0 | |||||
| 2025-08-06 | 13F | Ethos Financial Group, LLC | 37,037 | 88.81 | 6,467 | 89.45 | ||||
| 2025-08-13 | 13F | Gateway Wealth Partners, LLC | 4,710 | 822 | ||||||
| 2025-08-18 | 13F | Front Row Advisors LLC | 60 | 0.00 | 10 | 0.00 | ||||
| 2025-08-14 | 13F | Win Advisors, Inc | 0 | -100.00 | 0 | |||||
| 2025-08-06 | 13F | AE Wealth Management LLC | 2,353 | -4.31 | 411 | -3.98 | ||||
| 2025-08-07 | 13F | Efficient Advisors, LLC | 4,671 | -34.83 | 816 | -34.64 | ||||
| 2025-07-30 | 13F | Caliber Wealth Management, LLC / KS | 11,309 | -22.23 | 1,975 | -21.98 | ||||
| 2025-08-14 | 13F | Federation des caisses Desjardins du Quebec | 100 | 0.00 | 17 | 0.00 | ||||
| 2025-08-14 | 13F | Legacy Advisory Services, LLC | 10,813 | 0.30 | 1,888 | 0.64 | ||||
| 2025-08-14 | 13F | Royal Bank Of Canada | 1,542 | 2.59 | 269 | 3.07 | ||||
| 2025-07-30 | 13F | Bogart Wealth, LLC | 1,067 | -0.74 | 186 | -0.53 | ||||
| 2025-07-22 | 13F | Merit Financial Group, LLC | 1,967 | -0.56 | 343 | -0.29 | ||||
| 2025-07-11 | 13F | Farther Finance Advisors, LLC | 3,171 | -52.56 | 554 | -52.49 | ||||
| 2025-08-12 | 13F | J.w. Cole Advisors, Inc. | 3,518 | 8.48 | 614 | 8.87 | ||||
| 2025-07-25 | 13F | Commonwealth Financial Services, LLC | 2,311 | 0.00 | 403 | 0.25 | ||||
| 2025-05-19 | 13F | Heck Capital Advisors, LLC | 0 | 0 | ||||||
| 2025-07-22 | 13F | Miracle Mile Advisors, LLC | 7,168 | -8.66 | 1,252 | -8.35 | ||||
| 2025-08-11 | 13F | Aptus Capital Advisors, LLC | 2,186 | 0.09 | 382 | 0.26 | ||||
| 2025-07-28 | 13F | Mutual Advisors, LLC | 3,561 | -0.28 | 629 | 4.49 | ||||
| 2025-07-15 | 13F | Norden Group Llc | 8,655 | -3.73 | 1,511 | -3.39 | ||||
| 2025-08-14 | 13F | Wiley Bros.-aintree Capital, Llc | 2,154 | 0.47 | 376 | 2.17 | ||||
| 2025-08-06 | 13F | Commonwealth Equity Services, Llc | 16,447 | -1.82 | 3 | 0.00 | ||||
| 2025-07-10 | 13F | High Net Worth Advisory Group LLC | 2,400 | 0.00 | 419 | 0.48 | ||||
| 2025-08-13 | 13F | VestGen Advisors, LLC | 50,039 | 8,740 | ||||||
| 2025-08-01 | 13F | Advisory Alpha, LLC | 1,362 | -3.75 | 238 | -3.66 | ||||
| 2025-08-12 | 13F | Proequities, Inc. | 0 | 0 | ||||||
| 2025-07-30 | 13F | Insight Advisors, LLC/ PA | 2,740 | -7.40 | 479 | -7.18 | ||||
| 2025-08-14 | 13F | Ieq Capital, Llc | 92,605 | 0.00 | 16,170 | 0.33 | ||||
| 2025-08-14 | 13F | UBS Group AG | 13,564 | 8.24 | 2,368 | 8.62 | ||||
| 2025-07-30 | 13F | Brookstone Capital Management | 2,812 | -10.62 | 491 | -10.24 | ||||
| 2025-08-14 | 13F | CoreCap Advisors, LLC | 31 | 0.00 | 5 | 0.00 | ||||
| 2025-08-08 | 13F | Thoroughbred Financial Services, Llc | 10,139 | -8.15 | 2 | 0.00 | ||||
| 2025-05-15 | 13F | WPG Advisers, LLC | 0 | -100.00 | 0 | |||||
| 2025-07-28 | 13F | Rosenberg Matthew Hamilton | 97 | -17.80 | 17 | -20.00 | ||||
| 2025-08-11 | 13F | Blue Bell Private Wealth Management, Llc | 160 | 0.00 | 28 | 0.00 | ||||
| 2025-07-24 | 13F | Blair William & Co/il | 323 | 56 | ||||||
| 2025-07-30 | 13F | Syntegra Private Wealth Group, LLC | 698,710 | 8.15 | 122,002 | 8.50 | ||||
| 2025-08-14 | 13F | Horizon Investments, LLC | 73,961 | 76.78 | 12,914 | 77.37 | ||||
| 2025-07-30 | 13F | Strategic Blueprint, LLC | 4,915 | -0.95 | 858 | -0.58 | ||||
| 2025-07-15 | 13F | Aspire Capital Advisors LLC | 1,912 | 54.32 | 334 | 54.88 | ||||
| 2025-08-14 | 13F | Ameriprise Financial Inc | 27,248 | 468.38 | 4,623 | 454.20 | ||||
| 2025-07-14 | 13F | Park Avenue Securities Llc | 1,639 | 0 | ||||||
| 2025-07-30 | 13F | Journey Advisory Group, LLC | 21,005 | 2.84 | 3,668 | 3.18 | ||||
| 2025-08-18 | 13F | Arq Wealth Advisors, Llc | 2,742 | 0.00 | 477 | 0.00 | ||||
| 2025-07-14 | 13F | Painted Porch Advisors LLC | 22 | 0.00 | 4 | 0.00 | ||||
| 2025-08-06 | 13F/A | Flagship Private Wealth, LLC | 6,445 | 1.72 | 1,125 | 2.09 | ||||
| 2025-07-30 | 13F | Pacific Sun Financial Corp | 1,150 | 0.00 | 201 | 0.00 | ||||
| 2025-08-12 | 13F | BlackRock, Inc. | 346 | 0.00 | 60 | 0.00 | ||||
| 2025-08-13 | 13F | Vermillion & White Wealth Management Group, LLC | 37 | -21.28 | 7 | -25.00 | ||||
| 2025-07-24 | 13F | Us Bancorp \de\ | 43 | 2.38 | 7 | 0.00 | ||||
| 2025-08-07 | 13F | Hughes Financial Services, LLC | 1,155 | 0.00 | 202 | 0.50 | ||||
| 2025-07-23 | 13F | Valmark Advisers, Inc. | 26,132 | 12.29 | 4,563 | 12.64 | ||||
| 2025-07-30 | 13F | Prosperity Financial Group, Inc. | 1,621 | 283 | ||||||
| 2025-07-29 | 13F | Elevation Capital Advisory, LLC | 0 | -100.00 | 0 | |||||
| 2025-07-25 | 13F | Apollon Financial, LLC | 5,155 | 106.61 | 900 | 107.37 | ||||
| 2025-07-17 | 13F | Janney Montgomery Scott LLC | 1,400 | 0.00 | 0 | |||||
| 2025-09-04 | 13F/A | Advisor Group Holdings, Inc. | 28,001 | 37.27 | 4,890 | 37.71 | ||||
| 2025-08-14 | 13F/A | Skopos Labs, Inc. | 60 | 10 | ||||||
| 2025-08-06 | 13F | RFG - Bristol Wealth Advisors, LLC | 4,960 | 866 | ||||||
| 2025-08-13 | 13F | Milestone Investment Advisors LLC | 8,967 | -4.59 | 1,566 | -4.28 | ||||
| 2025-05-12 | 13F | Sandy Spring Bank | 16 | 0.00 | 3 | 0.00 | ||||
| 2025-07-24 | 13F | Ulland Investment Advisors, LLC | 187 | 289.58 | 0 | |||||
| 2025-08-13 | 13F | BCJ Capital Management, LLC | 1,603 | 0.50 | 280 | 0.72 | ||||
| 2025-08-04 | 13F | Assetmark, Inc | 128 | -5.19 | 22 | -4.35 | ||||
| 2025-08-05 | 13F | Magnolia Capital Advisors Llc | 42,893 | 7,490 | ||||||
| 2025-07-21 | 13F | Empirical Financial Services, LLC d.b.a. Empirical Wealth Management | 3,855 | -1.28 | 673 | -0.88 | ||||
| 2025-07-28 | 13F | DORVAL Corp | 114,883 | 2.61 | 20,060 | 2.50 | ||||
| 2025-07-29 | 13F | Signature Estate & Investment Advisors Llc | 1,438 | -6.32 | 251 | -5.99 | ||||
| 2025-08-13 | 13F | GeoWealth Management, LLC | 0 | -100.00 | 0 | |||||
| 2025-07-10 | 13F | HF Advisory Group, LLC | 30,370 | 4.27 | 5,303 | 4.60 | ||||
| 2025-07-09 | 13F | Pallas Capital Advisors LLC | 11,617 | 2,028 | ||||||
| 2025-08-14 | 13F | Gerber Kawasaki Wealth & Investment Management | 259,539 | -0.60 | 45,318 | -0.28 | ||||
| 2025-07-15 | 13F | Sheets Smith Wealth Management | 4,798 | 0.00 | 838 | 0.24 | ||||
| 2025-07-08 | 13F | Nbc Securities, Inc. | 408 | 0.00 | 0 | |||||
| 2025-08-12 | 13F | O'shaughnessy Asset Management, Llc | 294 | -23.24 | 51 | -22.73 | ||||
| 2025-08-14 | 13F | Citadel Advisors Llc | 1,364 | 238 | ||||||
| 2025-08-15 | 13F | Morgan Stanley | 168,069 | -0.08 | 29,347 | 0.25 | ||||
| 2025-08-14 | 13F | Cardiff Park Advisors, Llc | 2,719 | 0.00 | 475 | 0.21 | ||||
| 2025-08-12 | 13F | Calton & Associates, Inc. | 1,323 | 4.50 | 231 | 4.55 | ||||
| 2025-07-21 | 13F | Ameritas Advisory Services, LLC | 0 | -100.00 | 0 | |||||
| 2025-08-18 | 13F | Second Line Capital, LLC | 2,186 | 0.09 | 382 | 0.26 | ||||
| 2025-08-13 | 13F | EverSource Wealth Advisors, LLC | 9 | 0.00 | 2 | 0.00 | ||||
| 2025-08-15 | 13F | WFA of San Diego, LLC | 6 | -96.15 | 1 | -96.15 | ||||
| 2025-07-22 | 13F | Olistico Wealth, LLC | 57 | 0.00 | 10 | 0.00 | ||||
| 2025-08-13 | 13F | JBR Co Financial Management Inc | 2,531 | 442 | ||||||
| 2025-08-13 | 13F | Baltimore-Washington Financial Advisors, Inc. | 279,627 | 1.46 | 48,826 | 1.79 | ||||
| 2025-08-12 | 13F | Cornerstone Wealth Management, LLC | 1,678 | 8.40 | 293 | 8.55 | ||||
| 2025-08-11 | 13F | HighTower Advisors, LLC | 2,360 | 0.00 | 412 | 0.49 | ||||
| 2025-08-11 | 13F | Tidemark, LLC | 33 | -42.11 | 6 | -44.44 | ||||
| 2025-08-14 | 13F | State Street Corp | 103,795 | 99.15 | 18,124 | 99.81 | ||||
| 2025-07-22 | 13F | Financial Insights, Inc. | 7,219 | -2.97 | 1,261 | -2.63 | ||||
| 2025-08-05 | 13F | Dunhill Financial, LLC | 0 | 0 | ||||||
| 2025-08-08 | 13F | Cornerstone Advisors Asset Management, Inc | 0 | -100.00 | 0 | |||||
| 2025-07-10 | 13F | Wealth Enhancement Advisory Services, Llc | 21,295 | -22.48 | 3,747 | -21.65 | ||||
| 2025-04-15 | 13F | Eagle Capital Management, LLC | 0 | -100.00 | 0 | |||||
| 2025-07-21 | 13F | Barrett & Company, Inc. | 1,054 | 0.00 | 184 | 0.55 | ||||
| 2025-08-05 | 13F | Roffman Miller Associates Inc /pa/ | 12,094 | 0.40 | 2,112 | 0.72 | ||||
| 2025-07-22 | 13F | Accel Wealth Management | 1,375 | 0.00 | 240 | 0.42 | ||||
| 2025-08-14 | 13F | Mml Investors Services, Llc | 2,883 | 21.19 | 1 | |||||
| 2025-08-14 | 13F | Jane Street Group, Llc | 0 | -100.00 | 0 | |||||
| 2025-08-14 | 13F | Mission Creek Capital Partners, Inc. | 5,816 | -4.40 | 1,015 | -4.06 | ||||
| 2025-08-05 | 13F | Flynn Zito Capital Management, Llc | 1,175 | 0.51 | 205 | 0.99 | ||||
| 2025-08-13 | 13F | Northwestern Mutual Wealth Management Co | 6,558 | -3.94 | 1,145 | -3.62 | ||||
| 2025-08-14 | 13F | Wells Fargo & Company/mn | 89 | 36.92 | 15 | 36.36 | ||||
| 2025-05-15 | 13F | Sykon Capital Llc | 0 | -100.00 | 0 | -100.00 | ||||
| 2025-08-08 | 13F | Comprehensive Financial Planning, Inc./PA | 252 | 0.80 | 44 | 0.00 | ||||
| 2025-08-12 | 13F | LPL Financial LLC | 195,209 | 15.43 | 34,085 | 15.81 | ||||
| 2025-08-04 | 13F | Spire Wealth Management | 168 | 32.28 | 29 | 31.82 | ||||
| 2025-08-19 | 13F | Newbridge Financial Services Group, Inc. | 306 | 0.00 | 53 | 0.00 | ||||
| 2025-08-14 | 13F | Susquehanna International Group, Llp | 8,739 | 61.83 | 1,526 | 62.41 | ||||
| 2025-08-08 | 13F | Foundations Investment Advisors, LLC | 0 | -100.00 | 0 | |||||
| 2025-08-14 | 13F | Atomi Financial Group, Inc. | 3,786 | -2.12 | 661 | -1.78 | ||||
| 2025-08-08 | 13F | Cetera Investment Advisers | 13,755 | 55.02 | 2,402 | 55.51 | ||||
| 2025-07-10 | 13F | ARS Wealth Advisors Group, LLC | 2,342 | 0.30 | 409 | 0.49 | ||||
| 2025-08-08 | 13F | Bouchey Financial Group Ltd | 1,400 | 0.00 | 244 | 0.41 | ||||
| 2025-08-14 | 13F | Integrated Wealth Concepts LLC | 4,796 | 0.99 | 837 | 1.33 | ||||
| 2025-04-23 | 13F | Fourth Dimension Wealth, LLC | 0 | -100.00 | 0 | |||||
| 2025-08-14 | 13F | Fmr Llc | 2,525 | 14.15 | 441 | 14.29 | ||||
| 2025-08-14 | 13F | Harvest Investment Services, LLC | 3,272 | 0.62 | 571 | 1.06 | ||||
| 2025-08-07 | 13F | CENTRAL TRUST Co | 378 | 0.00 | 66 | 1.54 | ||||
| 2025-08-14 | 13F | EP Wealth Advisors, Inc. | 1,525 | 7.02 | 266 | 7.26 | ||||
| 2025-08-14 | 13F | Raymond James Financial Inc | 31,507 | 0.83 | 5,501 | 1.16 | ||||
| 2025-08-13 | 13F | Congress Wealth Management LLC / DE / | 187,919 | -9.05 | 32,813 | -8.76 | ||||
| 2025-07-25 | 13F | NorthRock Partners, LLC | 64 | 0.00 | 11 | 0.00 | ||||
| 2025-08-04 | 13F | Creative Financial Designs Inc /adv | 3,531 | -2.99 | 617 | -2.69 | ||||
| 2025-07-14 | 13F | AdvisorNet Financial, Inc | 1,375 | 49.62 | 240 | 50.94 | ||||
| 2025-07-15 | 13F | Regatta Capital Group, Llc | 5,639 | 985 | ||||||
| 2025-05-02 | 13F | Transcendent Capital Group LLC | 0 | -100.00 | 0 | |||||
| 2025-08-13 | 13F | Townsquare Capital Llc | 0 | -100.00 | 0 |