Mga Batayang Estadistika
| Pemilik Institusional | 169 total, 169 long only, 0 short only, 0 long/short - change of 20.42% MRQ |
| Alokasi Portofolio Rata-rata | 0.6696 % - change of 11.22% MRQ |
| Saham Institusional (Jangka Panjang) | 13,348,586 (ex 13D/G) - change of 3.00MM shares 28.97% MRQ |
| Nilai Institusional (Jangka Panjang) | $ 1,414,069 USD ($1000) |
Kepemilikan Institusional dan Pemegang Saham
American Century ETF Trust - American Century U.S. Quality Growth ETF (US:QGRO) memiliki 169 pemilik institusional dan pemegang saham yang telah mengajukan formulir 13D/G atau 13F kepada Komisi Bursa Efek (Securities Exchange Commission/SEC). Lembaga-lembaga ini memegang total 13,348,586 saham. Pemegang saham terbesar meliputi LPL Financial LLC, Mainstay Capital Management Llc /adv, Great Valley Advisor Group, Inc., American Century Companies Inc, Raymond James Financial Inc, Envestnet Asset Management Inc, Larson Financial Group LLC, Bank Of America Corp /de/, Advisor Group Holdings, Inc., and AAARX - Strategic Allocation: Aggressive Fund R Class .
Struktur kepemilikan institusional American Century ETF Trust - American Century U.S. Quality Growth ETF (ARCA:QGRO) menunjukkan posisi terkini di perusahaan oleh institusi dan dana, serta perubahan terbaru dalam ukuran posisi. Pemegang saham utama dapat mencakup investor individu, reksa dana, dana lindung nilai, atau institusi. Jadwal 13D menunjukkan bahwa investor memegang (atau pernah memegang) lebih dari 5% saham perusahaan dan bermaksud (atau pernah bermaksud) untuk secara aktif mengejar perubahan strategi bisnis. Jadwal 13G menunjukkan investasi pasif lebih dari 5%.
The share price as of September 10, 2025 is 112.73 / share. Previously, on September 11, 2024, the share price was 87.02 / share. This represents an increase of 29.54% over that period.

Skor Sentimen Dana
Skor Sentimen Dana (sebelumnya dikenal sebagai Skor Akumulasi Kepemilikan) menemukan saham-saham yang paling banyak dibeli oleh dana. Ini adalah hasil dari model kuantitatif multi-faktor yang canggih yang mengidentifikasi perusahaan dengan tingkat akumulasi institusional tertinggi. Model penilaian menggunakan kombinasi dari total peningkatan pemilik yang diungkapkan, perubahan dalam alokasi portofolio pada pemilik tersebut, dan metrik lainnya. Angka berkisar dari 0 hingga 100, dengan angka yang lebih tinggi menunjukkan tingkat akumulasi yang lebih tinggi dibandingkan dengan perusahaan sejenisnya, dan 50 adalah rata-ratanya.
Frekuensi Pembaruan: Setiap Hari
Lihat Ownership Explorer, yang menyediakan daftar perusahaan dengan peringkat tertinggi.
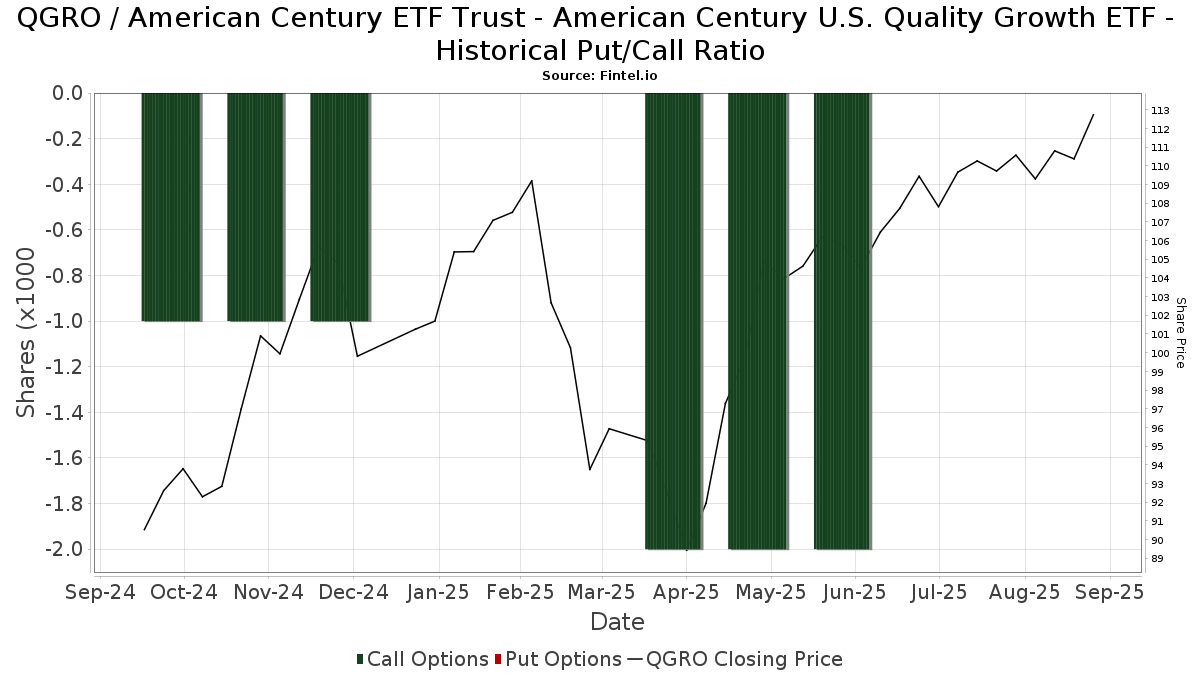
Rasio Put/Call Institusional
Selain melaporkan isu ekuitas dan utang standar, institusi dengan aset di bawah manajemen lebih dari 100 juta dolar AS juga harus mengungkapkan kepemilikan opsi put dan call mereka. Karena opsi put umumnya menunjukkan sentimen negatif, dan opsi call menunjukkan sentimen positif, kita dapat mengetahui sentimen institusional secara keseluruhan dengan memplot rasio put terhadap call. Grafik di sebelah kanan memplot rasio put/call historis untuk instrumen ini.
Menggunakan Rasio Put/Call sebagai indikator sentimen investor mengatasi salah satu kekurangan utama dari penggunaan total kepemilikan institusional, yaitu sejumlah besar aset yang dikelola diinvestasikan secara pasif untuk melacak indeks. Dana yang dikelola secara pasif biasanya tidak membeli opsi, sehingga indikator rasio put/call lebih akurat dalam melacak sentimen dana yang dikelola secara aktif.
Pengajuan 13F dan NPORT
Detail pada pengajuan 13F tersedia gratis. Detail pada pengajuan NP memerlukan keanggotaan premium. Baris berwarna hijau menunjukkan posisi baru. Baris berwarna merah menunjukkan posisi yang sudah ditutup. Klik tautan ini ikon untuk melihat riwayat transaksi selengkapnya.
Tingkatkan
untuk membuka data premium dan mengekspor ke Excel ![]() .
.
| Tanggal File | Sumber | Investor | Ketik | Presyo ng Avg (Silangan) |
Saham | Δ Saham (%) |
Dilaporkan Nilai ($1000) |
Nilai Δ (%) |
Alokasi Port (%) |
|
|---|---|---|---|---|---|---|---|---|---|---|
| 2025-08-04 | 13F | Savvy Advisors, Inc. | 2,119 | -2.17 | 231 | 14.36 | ||||
| 2025-08-05 | 13F | Huntington National Bank | 73 | |||||||
| 2025-08-07 | 13F | Weil Company, Inc. | 40,905 | 4,464 | ||||||
| 2025-08-11 | 13F | Tidemark, LLC | 0 | -100.00 | 0 | |||||
| 2025-08-12 | 13F | O'shaughnessy Asset Management, Llc | 1 | 0 | ||||||
| 2025-07-17 | 13F/A | Capital Investment Advisors, LLC | 69,436 | 65.36 | 7,577 | 92.63 | ||||
| 2025-07-24 | 13F | MFA Wealth Services | 80,954 | 0.71 | 8,834 | 17.32 | ||||
| 2025-06-27 | NP | AAARX - Strategic Allocation: Aggressive Fund R Class This fund is a listed as child fund of American Century Companies Inc and if that institution has disclosed ownership in this security, then these positions will not be double counted when calculating total shares and total value | 374,376 | -1.09 | 36,419 | -8.95 | ||||
| 2025-04-30 | 13F | Sofos Investments, Inc. | 107 | -91.24 | 10 | -90.38 | ||||
| 2025-08-11 | 13F | Private Advisor Group, LLC | 247,941 | 15.10 | 27,055 | 34.08 | ||||
| 2025-07-09 | 13F | Sunpointe, LLC | 7,138 | -2.77 | 779 | 13.25 | ||||
| 2025-08-15 | 13F | Prevail Innovative Wealth Advisors, Llc | 15,418 | 15.46 | 1,682 | 34.56 | ||||
| 2025-05-09 | 13F | Belvedere Trading LLC | Put | 0 | -100.00 | 0 | -100.00 | |||
| 2025-08-13 | 13F | Marshall Wace, Llp | 6,882 | 751 | ||||||
| 2025-08-13 | 13F | WCG Wealth Advisors LLC | 14,195 | 2.09 | 1,549 | 18.89 | ||||
| 2025-08-05 | 13F | Simplex Trading, Llc | 1,236 | 0 | ||||||
| 2025-07-25 | 13F | Pathway Financial Advisors LLC | 63,587 | 7.02 | 6,939 | 24.67 | ||||
| 2025-08-12 | 13F | Global Retirement Partners, LLC | 5,707 | 142.13 | 623 | 165.81 | ||||
| 2025-08-14 | 13F | Bank Of America Corp /de/ | 429,435 | -3.27 | 46,860 | 12.69 | ||||
| 2025-07-24 | 13F | Cyndeo Wealth Partners, LLC | 30,342 | -5.97 | 3,311 | 9.53 | ||||
| 2025-08-04 | 13F | Spire Wealth Management | 2,636 | 1,046.09 | 288 | 1,266.67 | ||||
| 2025-08-13 | 13F | Valued Retirements, Inc. | 18,229 | 78.23 | 1,989 | 107.62 | ||||
| 2025-07-17 | 13F | Oakworth Capital, Inc. | 1,635 | 0.00 | 178 | 16.34 | ||||
| 2025-07-08 | 13F | Parallel Advisors, LLC | 111 | 0.00 | 12 | 20.00 | ||||
| 2025-08-12 | 13F | Bedel Financial Consulting, Inc. | 24,485 | 1.48 | 2,672 | 11.71 | ||||
| 2025-08-07 | 13F | 1620 Investment Advisors, Inc. | 1 | 0 | ||||||
| 2025-04-28 | 13F | D.a. Davidson & Co. | 0 | -100.00 | 0 | |||||
| 2025-08-14 | 13F | Comerica Bank | 1,185 | 34.35 | 129 | 57.32 | ||||
| 2025-08-14 | 13F | GWM Advisors LLC | 216,614 | 4,972.93 | 23,637 | 5,823.81 | ||||
| 2025-08-14 | 13F | Ruggaard & Associates LLC | 142,821 | 2.89 | 15,585 | 19.87 | ||||
| 2025-08-12 | 13F | Ameritas Investment Partners, Inc. | 0 | 0 | ||||||
| 2025-08-14 | 13F | Fmr Llc | 1,118 | 25.06 | 122 | 45.78 | ||||
| 2025-07-30 | 13F | BlueChip Wealth Advisors LLC | 13,501 | 15.53 | 1,473 | 34.64 | ||||
| 2025-08-14 | 13F | Gallagher Fiduciary Advisors, LLC | 3,883 | 424 | ||||||
| 2025-07-24 | 13F | Leo Wealth, LLC | 2,293 | 250 | ||||||
| 2025-08-08 | 13F | Cetera Investment Advisers | 60,659 | 1.08 | 6,619 | 17.75 | ||||
| 2025-08-13 | 13F | Congress Wealth Management LLC / DE / | 4,894 | 91.32 | 534 | 123.43 | ||||
| 2025-07-08 | 13F | Next Level Private LLC | 157,782 | 83.46 | 17,217 | 113.74 | ||||
| 2025-07-22 | 13F | Legacy CG, LLC | 24,233 | -4.66 | 2,644 | 11.09 | ||||
| 2025-08-05 | 13F | Fourth Dimension Wealth, LLC | 18,533 | 10.88 | 2,022 | 29.20 | ||||
| 2025-07-29 | 13F | Fundamentun, Llc | 87,807 | 9,582 | ||||||
| 2025-07-24 | 13F | Us Bancorp \de\ | 365 | 0.00 | 40 | 14.71 | ||||
| 2025-08-13 | 13F | GeoWealth Management, LLC | 0 | -100.00 | 0 | |||||
| 2025-08-13 | 13F | Jones Financial Companies Lllp | 426 | 46 | ||||||
| 2025-07-28 | 13F | RFG Advisory, LLC | 45,199 | 319.48 | 4,932 | 388.80 | ||||
| 2025-08-08 | 13F | Financial Gravity Companies, Inc. | 107 | -86.81 | 12 | -86.25 | ||||
| 2025-04-28 | 13F | Strategic Financial Concepts, LLC | 0 | -100.00 | 0 | -100.00 | ||||
| 2025-07-30 | 13F | Advantage Trust Co | 284 | 31 | ||||||
| 2025-08-11 | 13F | Western Wealth Management, LLC | 50,615 | 1,319.78 | 5,523 | 1,558.56 | ||||
| 2025-08-04 | 13F | Flagship Harbor Advisors, Llc | 45,943 | 7.74 | 5,013 | 25.51 | ||||
| 2025-08-06 | 13F | Commonwealth Equity Services, Llc | 176,171 | 39.47 | 19 | 72.73 | ||||
| 2025-08-08 | 13F | Thoroughbred Financial Services, Llc | 3,398 | 0 | ||||||
| 2025-08-08 | 13F | Avantax Advisory Services, Inc. | 9,683 | 0.82 | 1,057 | 17.46 | ||||
| 2025-07-24 | 13F | Mainstay Capital Management Llc /adv | 1,246,969 | 28.96 | 136,069 | 50.23 | ||||
| 2025-09-10 | 13F | WT Wealth Management | 12,189 | -20.98 | 1,330 | -7.89 | ||||
| 2025-08-12 | 13F | Jpmorgan Chase & Co | 79 | -30.70 | 9 | -20.00 | ||||
| 2025-07-29 | 13F | Private Trust Co Na | 4,170 | 0.65 | 455 | 17.27 | ||||
| 2025-08-04 | 13F | Arkadios Wealth Advisors | 48,134 | 2.25 | 5,252 | 19.12 | ||||
| 2025-08-14 | 13F | Two Sigma Investments, Lp | 110,300 | 12,036 | ||||||
| 2025-07-31 | 13F/A | Avion Wealth | 1,018 | 0 | ||||||
| 2025-08-05 | 13F | GPS Wealth Strategies Group, LLC | 145 | 16.00 | 16 | 36.36 | ||||
| 2025-08-13 | 13F | Smith, Moore & Co. | 2,281 | 249 | ||||||
| 2025-07-28 | 13F | Harbour Investments, Inc. | 2,002 | -15.03 | 218 | -0.91 | ||||
| 2025-08-15 | 13F | Equitable Holdings, Inc. | 140,554 | 9.96 | 15,337 | 28.11 | ||||
| 2025-08-11 | 13F | Independent Advisor Alliance | 4,838 | 528 | ||||||
| 2025-08-05 | 13F | Sigma Planning Corp | 47,367 | 5.11 | 5,169 | 22.44 | ||||
| 2025-08-13 | 13F | Transce3nd, LLC | 3 | 0.00 | 0 | |||||
| 2025-07-08 | 13F | IAM Advisory, LLC | 137,273 | -1.60 | 14,979 | 14.63 | ||||
| 2025-08-12 | 13F | Wealth Advisors of Iowa, LLC | 135,207 | 2,738.69 | 14,754 | 3,207.85 | ||||
| 2025-07-22 | 13F | Beacon Financial Advisory LLC | 6,492 | 70.93 | 708 | 99.44 | ||||
| 2025-08-15 | 13F/A | MONECO Advisors, LLC | 0 | -100.00 | 0 | |||||
| 2025-07-29 | 13F | Stratos Wealth Partners, LTD. | 51,546 | -47.04 | 5,625 | -38.31 | ||||
| 2025-08-14 | 13F/A | Rockefeller Capital Management L.P. | 28,086 | 17.45 | 3,065 | 36.85 | ||||
| 2025-08-14 | 13F | Clark Capital Management Group, Inc. | 2,770 | -31.20 | 302 | -19.89 | ||||
| 2025-07-30 | 13F | Parcion Private Wealth LLC | 52,122 | 3.46 | 5,688 | 20.54 | ||||
| 2025-08-13 | 13F | VestGen Advisors, LLC | 2,296 | 251 | ||||||
| 2025-08-14 | 13F | Garden State Investment Advisory Services LLC | 4,544 | 496 | ||||||
| 2025-07-25 | 13F | Hobbs Group Advisors, LLC | 5,429 | -33.57 | 592 | -22.61 | ||||
| 2025-08-15 | 13F | Captrust Financial Advisors | 34,159 | 10.79 | 3,727 | 29.05 | ||||
| 2025-07-17 | 13F | KWB Wealth | 14,660 | 5.28 | 1,373 | -1.08 | ||||
| 2025-07-25 | 13F | Cwm, Llc | 1,155 | 0 | ||||||
| 2025-07-29 | 13F | Harbor Asset Planning, Inc. | 747 | 81 | ||||||
| 2025-08-04 | 13F | Assetmark, Inc | 409 | 49.27 | 45 | 76.00 | ||||
| 2025-08-14 | 13F | Jane Street Group, Llc | 9,398 | 7.86 | 1,026 | 25.61 | ||||
| 2025-08-08 | 13F | Good Life Advisors, LLC | 68,148 | 2,584.05 | 7,436 | 3,037.55 | ||||
| 2025-08-11 | 13F | NewEdge Wealth, LLC | 14,001 | 60.78 | 1,531 | 87.85 | ||||
| 2025-08-12 | 13F/A | Cozad Asset Management Inc | 12,315 | 159.97 | 1,344 | 203.16 | ||||
| 2025-05-15 | 13F | Vermillion & White Wealth Management Group, LLC | 0 | -100.00 | 0 | |||||
| 2025-08-06 | 13F | Ethos Financial Group, LLC | 7,421 | 810 | ||||||
| 2025-08-08 | 13F | Intrua Financial, LLC | 283,102 | 60.28 | 30,892 | 86.73 | ||||
| 2025-08-11 | 13F | Y.D. More Investments Ltd | 201 | 22 | ||||||
| 2025-08-13 | 13F | Northwestern Mutual Wealth Management Co | 253,503 | 573.14 | 27,662 | 684.29 | ||||
| 2025-08-08 | 13F | Larson Financial Group LLC | 516,628 | 165.33 | 56,374 | 209.10 | ||||
| 2025-08-08 | 13F | Fortis Group Advisors, LLC | 18,930 | 65.67 | 2,070 | 93.46 | ||||
| 2025-08-18 | 13F | Hershey Financial Advisers, LLC | 4,950 | 540 | ||||||
| 2025-05-08 | 13F | IFG Advisory, LLC | 0 | -100.00 | 0 | |||||
| 2025-07-16 | 13F | Dakota Wealth Management | 62,890 | -8.70 | 6,863 | 6.35 | ||||
| 2025-08-07 | 13F | 49 Wealth Management, Llc | 3,021 | -50.32 | 330 | -42.18 | ||||
| 2025-07-15 | 13F | Retireful, LLC | 4,190 | 457 | ||||||
| 2025-08-14 | 13F | IHT Wealth Management, LLC | 30,079 | 6.29 | 3,282 | 23.85 | ||||
| 2025-08-14 | 13F | UBS Group AG | 171,000 | 296.22 | 18,660 | 361.63 | ||||
| 2025-07-22 | 13F | Petros Family Wealth, LLC | 43,275 | 30.07 | 4,722 | 51.54 | ||||
| 2025-08-13 | 13F | Maia Wealth LLC | 0 | -100.00 | 0 | |||||
| 2025-08-14 | 13F | Mercer Global Advisors Inc /adv | 2,112 | -8.53 | 230 | 6.48 | ||||
| 2025-07-31 | 13F | Cambridge Investment Research Advisors, Inc. | 85,618 | 34.73 | 9 | 80.00 | ||||
| 2025-08-05 | 13F | GHP Investment Advisors, Inc. | 1,072 | 0.00 | 117 | 16.00 | ||||
| 2025-07-28 | 13F | Axxcess Wealth Management, Llc | 1,893 | 207 | ||||||
| 2025-08-12 | 13F | Park Square Financial Group, LLC | 1,930 | 111.39 | 211 | 147.06 | ||||
| 2025-08-18 | 13F | Geneos Wealth Management Inc. | 7,295 | -1.07 | 796 | 15.36 | ||||
| 2025-08-11 | 13F | Principal Securities, Inc. | 3,250 | 8.88 | 355 | 19.19 | ||||
| 2025-08-14 | 13F | Mpwm Advisory Solutions, Llc | 6,392 | 23.35 | 697 | 43.71 | ||||
| 2025-08-13 | 13F | Brown Advisory Inc | 5,160 | 10.73 | 563 | 29.13 | ||||
| 2025-07-16 | 13F | Moneywise, Inc. | 35,401 | -9.98 | 3,863 | 4.89 | ||||
| 2025-06-27 | NP | AACRX - Strategic Allocation: Conservative Fund R Class This fund is a listed as child fund of American Century Companies Inc and if that institution has disclosed ownership in this security, then these positions will not be double counted when calculating total shares and total value | 130,789 | 0.00 | 12,723 | -7.94 | ||||
| 2025-04-21 | 13F | PSI Advisors, LLC | 0 | -100.00 | 0 | -100.00 | ||||
| 2025-08-14 | 13F | CoreCap Advisors, LLC | 81 | 5.19 | 9 | 14.29 | ||||
| 2025-08-13 | 13F | Cresset Asset Management, LLC | 28,578 | -0.08 | 3,118 | 16.43 | ||||
| 2025-07-16 | 13F | Freestate Advisors LLC | 9,591 | 1.27 | 1,047 | 17.93 | ||||
| 2025-07-18 | 13F | Midwest Financial Group LLC | 2,376 | 259 | ||||||
| 2025-08-12 | 13F | Steward Partners Investment Advisory, Llc | 14,612 | 44.80 | 1,594 | 68.68 | ||||
| 2025-08-14 | 13F | Stifel Financial Corp | 90,470 | 23.48 | 9,872 | 43.84 | ||||
| 2025-08-14 | 13F | Integrated Wealth Concepts LLC | 15,026 | -0.81 | 1,640 | 15.59 | ||||
| 2025-08-14 | 13F | Win Advisors, Inc | 126,687 | -1.33 | 13,824 | 14.94 | ||||
| 2025-07-24 | 13F | IFP Advisors, Inc | 59,065 | 126.71 | 6,445 | 164.14 | ||||
| 2025-08-01 | 13F | Transcend Wealth Collective, Llc | 0 | -100.00 | 0 | |||||
| 2025-07-09 | 13F | Procyon Private Wealth Partners, LLC | 296,786 | -0.58 | 32,385 | 15.82 | ||||
| 2025-08-06 | 13F | Golden State Wealth Management, LLC | 14,087 | 61.68 | 1,537 | 88.36 | ||||
| 2025-08-14 | 13F | Citadel Advisors Llc | 0 | -100.00 | 0 | |||||
| 2025-06-27 | NP | TWSMX - Strategic Allocation: Moderate Fund Investor Class This fund is a listed as child fund of American Century Companies Inc and if that institution has disclosed ownership in this security, then these positions will not be double counted when calculating total shares and total value | 362,249 | -5.53 | 35,240 | -13.04 | ||||
| 2025-08-28 | NP | TFAFX - Tactical Growth Allocation Fund Class I | 400 | 44 | ||||||
| 2025-09-04 | 13F/A | Advisor Group Holdings, Inc. | 415,538 | 33.26 | 45,344 | 55.24 | ||||
| 2025-07-24 | 13F | Aurora Private Wealth, Inc. | 0 | -100.00 | 0 | |||||
| 2025-08-08 | 13F | Capital Investment Advisory Services, LLC | 300 | 33 | ||||||
| 2025-08-13 | 13F | Per Stirling Capital Management, LLC. | 117,034 | 0.91 | 12,771 | 17.54 | ||||
| 2025-07-25 | 13F | Astoria Portfolio Advisors LLC. | 12,954 | 4.47 | 1,422 | 24.65 | ||||
| 2025-08-14 | 13F | Mml Investors Services, Llc | 67,988 | 157.76 | 7 | 250.00 | ||||
| 2025-08-12 | 13F | Proequities, Inc. | 0 | 0 | ||||||
| 2025-08-12 | 13F | SRS Capital Advisors, Inc. | 26 | 0.00 | 3 | 0.00 | ||||
| 2025-08-14 | 13F | Raymond James Financial Inc | 747,648 | 58.42 | 81,583 | 84.55 | ||||
| 2025-07-21 | 13F | Ameritas Advisory Services, LLC | 34,870 | -54.39 | 3,805 | -49.68 | ||||
| 2025-07-17 | 13F | Janney Montgomery Scott LLC | 20,454 | 24.36 | 2 | 100.00 | ||||
| 2025-08-13 | 13F | Capital Analysts, Inc. | 30,590 | 2.24 | 3 | 50.00 | ||||
| 2025-07-25 | 13F | Apollon Financial, LLC | 2,965 | 0.00 | 324 | 16.61 | ||||
| 2025-08-01 | 13F | Belvedere Trading LLC | Call | 2,300 | 251 | |||||
| 2025-08-05 | 13F | Key FInancial Inc | 17,057 | 55.69 | 1,861 | 81.38 | ||||
| 2025-08-13 | 13F | Truvestments Capital Llc | 36 | 0.00 | 4 | 0.00 | ||||
| 2025-08-07 | 13F | PCG Wealth Advisors, LLC | 0 | -100.00 | 0 | |||||
| 2025-08-01 | 13F | Ashton Thomas Private Wealth, LLC | 4,993 | 80.91 | 545 | 110.85 | ||||
| 2025-08-14 | 13F | Royal Bank Of Canada | 190,677 | 63.26 | 20,806 | 90.18 | ||||
| 2025-08-14 | 13F | Goldman Sachs Group Inc | 2,225 | 0.00 | 243 | 16.35 | ||||
| 2025-07-31 | 13F | Oppenheimer & Co Inc | 4,973 | 543 | ||||||
| 2025-08-01 | 13F | Motco | 960 | 105 | ||||||
| 2025-08-04 | 13F | Atria Investments Llc | 3,644 | -82.41 | 398 | -79.54 | ||||
| 2025-08-14 | 13F | Wells Fargo & Company/mn | 74,507 | 71.72 | 8,130 | 100.05 | ||||
| 2025-08-11 | 13F | Anderson Financial Strategies, LLC | 142,255 | 15,523 | ||||||
| 2025-08-14 | 13F | Synovus Financial Corp | 248,184 | 0.06 | 27,101 | 16.64 | ||||
| 2025-08-06 | 13F | Founders Financial Securities Llc | 30,008 | 3,274 | ||||||
| 2025-07-16 | 13F | St Germain D J Co Inc | 48 | 5 | ||||||
| 2025-08-15 | 13F | Kestra Advisory Services, LLC | 7,931 | 35.32 | 865 | 57.56 | ||||
| 2025-08-14 | 13F | Mariner, LLC | 48,430 | 5,285 | ||||||
| 2025-07-29 | 13F | Stratos Wealth Advisors, LLC | 88,515 | 4.55 | 9,659 | 21.79 | ||||
| 2025-04-21 | 13F | SILVER OAK SECURITIES, Inc | 0 | -100.00 | 0 | |||||
| 2025-08-07 | 13F | Brio Consultants, LLC | 4,124 | 450 | ||||||
| 2025-08-11 | 13F | Strategic Equity Management | 3,877 | -13.48 | 423 | 0.95 | ||||
| 2025-08-12 | 13F | American Century Companies Inc | 783,232 | -12.27 | 85,466 | 2.20 | ||||
| 2025-07-15 | 13F | Unified Investment Management | 12,046 | 0.01 | 1,314 | 16.49 | ||||
| 2025-07-25 | 13F | Atria Wealth Solutions, Inc. | 4,015 | 24.61 | 438 | 45.51 | ||||
| 2025-08-14 | 13F | Warren Averett Asset Management, LLC | 3,599 | -13.98 | 393 | 0.26 | ||||
| 2025-07-30 | 13F/A | KPP Advisory Services LLC | 24,558 | 143.41 | 2,680 | 183.49 | ||||
| 2025-08-12 | 13F | Nemes Rush Group LLC | 625 | 0.00 | 68 | 17.24 | ||||
| 2025-07-30 | 13F | Prosperity Financial Group, Inc. | 29,568 | 1.95 | 3,226 | 18.78 | ||||
| 2025-07-09 | 13F | Exchange Bank | 1,928 | 210 | ||||||
| 2025-08-08 | 13F | Foundations Investment Advisors, LLC | 0 | -100.00 | 0 | |||||
| 2025-07-10 | 13F | Redhawk Wealth Advisors, Inc. | 261,138 | 28,495 | ||||||
| 2025-08-01 | 13F | Envestnet Asset Management Inc | 587,960 | -1.86 | 64,158 | 14.33 | ||||
| 2025-07-23 | 13F | Cannon Wealth Management Services, LLC | 1,900 | 207 | ||||||
| 2025-08-15 | 13F | Morgan Stanley | 1,629 | -52.97 | 178 | -45.37 | ||||
| 2025-04-24 | 13F | Alta Wealth Advisors LLC | 0 | -100.00 | 0 | |||||
| 2025-08-11 | 13F | HighTower Advisors, LLC | 12,625 | 4.12 | 1,378 | 21.32 | ||||
| 2025-08-14 | 13F | Susquehanna International Group, Llp | 0 | -100.00 | 0 | |||||
| 2025-08-07 | 13F | Kestra Private Wealth Services, Llc | 34,695 | 1.99 | 3,786 | 18.80 | ||||
| 2025-07-07 | 13F | Nova Wealth Management, Inc. | 27,221 | 470.31 | 2,969 | 563.98 | ||||
| 2025-07-21 | 13F | DHJJ Financial Advisors, Ltd. | 3 | 0.00 | 0 | |||||
| 2025-08-12 | 13F | Financial Advocates Investment Management | 5,163 | 2.58 | 563 | 19.53 | ||||
| 2025-07-17 | 13F | Park Place Capital Corp | 673 | 73 | ||||||
| 2025-07-21 | 13F | Ameriflex Group, Inc. | 0 | -100.00 | 0 | |||||
| 2025-07-29 | 13F | Mb, Levis & Associates, Llc | 82,416 | 4.28 | 8,993 | 21.48 | ||||
| 2025-08-12 | 13F | LPL Financial LLC | 1,726,534 | 7.33 | 188,399 | 25.04 | ||||
| 2025-07-11 | 13F | Farther Finance Advisors, LLC | 118 | 0.00 | 13 | 9.09 | ||||
| 2025-08-06 | 13F | AE Wealth Management LLC | 14,649 | 21.08 | 1,598 | 41.04 | ||||
| 2025-08-14 | 13F | Great Valley Advisor Group, Inc. | 871,588 | 0.37 | 95,108 | 16.93 |