Mga Batayang Estadistika
| Saham Institusional (Jangka Panjang) | 46,056,369 - 70.34% (ex 13D/G) - change of 0.55MM shares 1.20% MRQ |
| Nilai Institusional (Jangka Panjang) | $ 852,875 USD ($1000) |
Kepemilikan Institusional dan Pemegang Saham
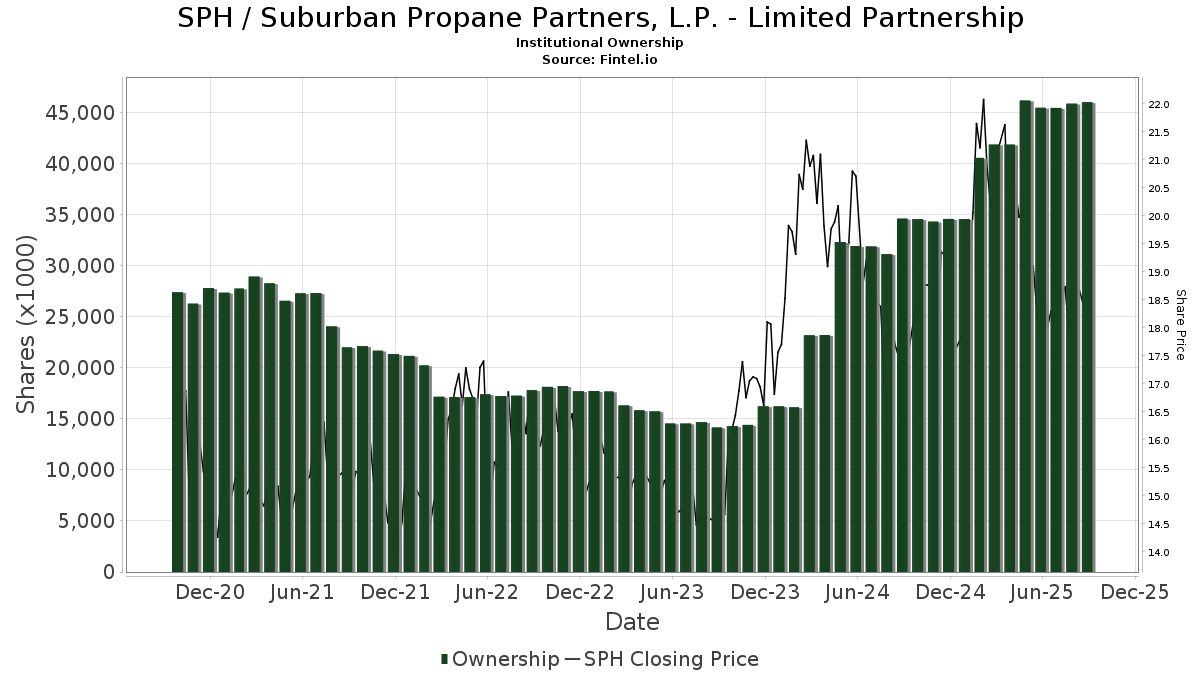
Suburban Propane Partners, L.P. - Limited Partnership (US:SPH) memiliki 158 pemilik institusional dan pemegang saham yang telah mengajukan formulir 13D/G atau 13F kepada Komisi Bursa Efek (Securities Exchange Commission/SEC). Lembaga-lembaga ini memegang total 46,056,369 saham. Pemegang saham terbesar meliputi AMLP - ALERIAN MLP ETF, Alps Advisors Inc, MIRAE ASSET GLOBAL ETFS HOLDINGS Ltd., MLPA - Global X MLP ETF, Goldman Sachs Group Inc, Jpmorgan Chase & Co, GLPAX - Goldman Sachs MLP Energy Infrastructure Fund Class A Shares, Morgan Stanley, Bowen Hanes & Co Inc, and DIV - Global X SuperDividend U.S. ETF .
Struktur kepemilikan institusional Suburban Propane Partners, L.P. - Limited Partnership (NYSE:SPH) menunjukkan posisi terkini di perusahaan oleh institusi dan dana, serta perubahan terbaru dalam ukuran posisi. Pemegang saham utama dapat mencakup investor individu, reksa dana, dana lindung nilai, atau institusi. Jadwal 13D menunjukkan bahwa investor memegang (atau pernah memegang) lebih dari 5% saham perusahaan dan bermaksud (atau pernah bermaksud) untuk secara aktif mengejar perubahan strategi bisnis. Jadwal 13G menunjukkan investasi pasif lebih dari 5%.
The share price as of September 4, 2025 is 18.43 / share. Previously, on September 5, 2024, the share price was 17.41 / share. This represents an increase of 5.86% over that period.
Skor Sentimen Dana
Skor Sentimen Dana (sebelumnya dikenal sebagai Skor Akumulasi Kepemilikan) menemukan saham-saham yang paling banyak dibeli oleh dana. Ini adalah hasil dari model kuantitatif multi-faktor yang canggih yang mengidentifikasi perusahaan dengan tingkat akumulasi institusional tertinggi. Model penilaian menggunakan kombinasi dari total peningkatan pemilik yang diungkapkan, perubahan dalam alokasi portofolio pada pemilik tersebut, dan metrik lainnya. Angka berkisar dari 0 hingga 100, dengan angka yang lebih tinggi menunjukkan tingkat akumulasi yang lebih tinggi dibandingkan dengan perusahaan sejenisnya, dan 50 adalah rata-ratanya.
Frekuensi Pembaruan: Setiap Hari
Lihat Ownership Explorer, yang menyediakan daftar perusahaan dengan peringkat tertinggi.
Rasio Put/Call Institusional
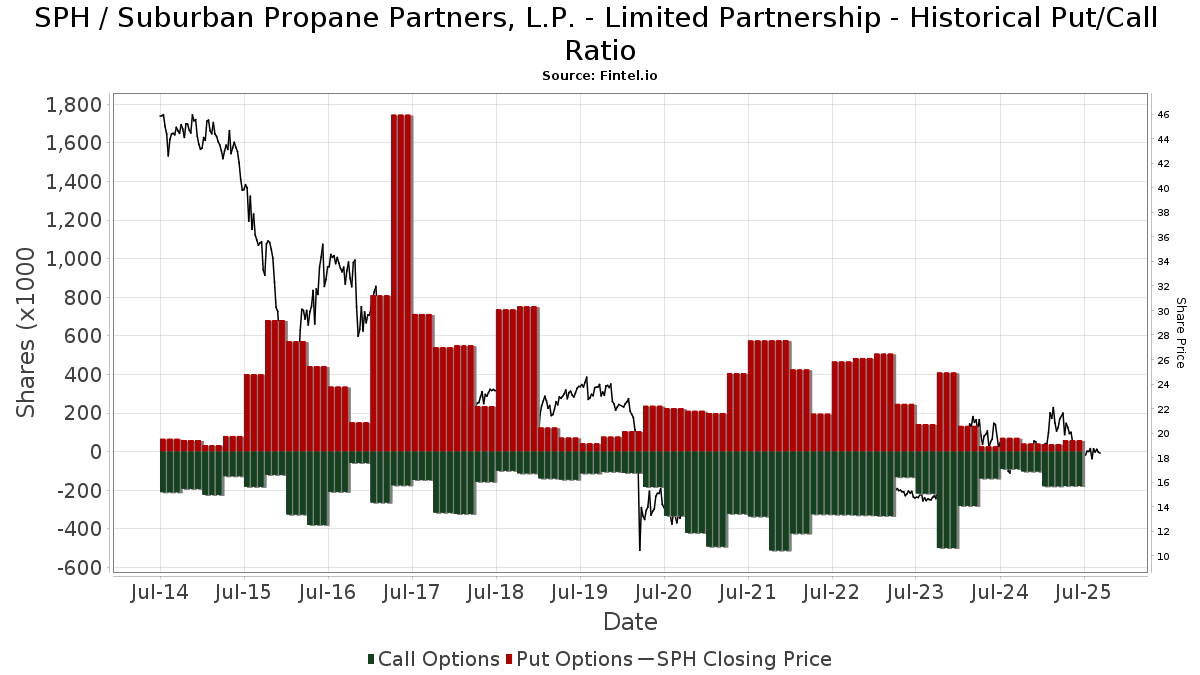
Selain melaporkan isu ekuitas dan utang standar, institusi dengan aset di bawah manajemen lebih dari 100 juta dolar AS juga harus mengungkapkan kepemilikan opsi put dan call mereka. Karena opsi put umumnya menunjukkan sentimen negatif, dan opsi call menunjukkan sentimen positif, kita dapat mengetahui sentimen institusional secara keseluruhan dengan memplot rasio put terhadap call. Grafik di sebelah kanan memplot rasio put/call historis untuk instrumen ini.
Menggunakan Rasio Put/Call sebagai indikator sentimen investor mengatasi salah satu kekurangan utama dari penggunaan total kepemilikan institusional, yaitu sejumlah besar aset yang dikelola diinvestasikan secara pasif untuk melacak indeks. Dana yang dikelola secara pasif biasanya tidak membeli opsi, sehingga indikator rasio put/call lebih akurat dalam melacak sentimen dana yang dikelola secara aktif.
Pengajuan 13D/G
Kami menyajikan pengajuan 13D/G secara terpisah dari pengajuan 13F karena perlakuan yang berbeda oleh SEC. Pengajuan 13D/G dapat diajukan oleh kelompok investor (dengan satu pemimpin), sedangkan pengajuan 13F tidak bisa. Hal ini mengakibatkan situasi di mana seorang investor dapat mengajukan 13D/G yang melaporkan satu nilai untuk total saham (mewakili semua saham yang dimiliki oleh kelompok investor), tetapi kemudian mengajukan 13F yang melaporkan nilai yang berbeda untuk total saham (mewakili kepemilikan mereka sendiri). Ini berarti bahwa kepemilikan saham dari pengajuan 13D/G dan pengajuan 13F seringkali tidak dapat dibandingkan secara langsung, sehingga kami menyajikannya secara terpisah.
Catatan: Mulai 16 Mei 2021, kami tidak lagi menampilkan pemilik yang belum mengajukan 13D/G dalam setahun terakhir. Sebelumnya, kami menampilkan riwayat lengkap pengajuan 13D/G. Secara umum, entitas yang diwajibkan untuk mengajukan pengajuan 13D/G harus mengajukan setidaknya setiap tahun sebelum mengirimkan pengajuan penutupan. Namun, terkadang dana keluar dari posisi tanpa mengirimkan pengajuan penutupan (misalnya, mereka menghentikan operasi), sehingga menampilkan riwayat lengkap terkadang menyebabkan kebingungan tentang kepemilikan saat ini. Untuk mencegah kebingungan, kami sekarang hanya menampilkan pemilik 'saat ini' - yaitu - pemilik yang telah mengajukan dalam setahun terakhir.
Upgrade to unlock premium data.
| Tanggal File | Formulir | Investor | Sebelumnya Saham |
Terbaru Saham |
Δ Saham (Persen) |
Kepemilikan (Persen) |
Δ Pagmamay-ari (Persen) |
|
|---|---|---|---|---|---|---|---|---|
| 2025-07-09 | ALPS ADVISORS INC | 14,142,616 | 13,893,278 | -1.76 | 21.39 | -2.46 | ||
| 2025-05-15 | Global X Management CO LLC | 3,344,151 | 4,249,304 | 27.07 | 6.54 | 25.29 |
Pengajuan 13F dan NPORT
Detail pada pengajuan 13F tersedia gratis. Detail pada pengajuan NP memerlukan keanggotaan premium. Baris berwarna hijau menunjukkan posisi baru. Baris berwarna merah menunjukkan posisi yang sudah ditutup. Klik tautan ini ikon untuk melihat riwayat transaksi selengkapnya.
Tingkatkan
untuk membuka data premium dan mengekspor ke Excel ![]() .
.
| Tanggal File | Sumber | Investor | Ketik | Presyo ng Avg (Silangan) |
Saham | Δ Saham (%) |
Dilaporkan Nilai ($1000) |
Nilai Δ (%) |
Alokasi Port (%) |
|
|---|---|---|---|---|---|---|---|---|---|---|
| 2025-08-12 | 13F | LPL Financial LLC | 115,774 | 1.14 | 2,145 | -10.81 | ||||
| 2025-07-15 | 13F | FLP Wealth Management, LLC | 0 | -100.00 | 0 | |||||
| 2025-07-15 | 13F | Main Street Group, LTD | 0 | -100.00 | 0 | |||||
| 2025-07-29 | 13F | Stratos Wealth Partners, LTD. | 11,754 | 0.32 | 218 | -11.79 | ||||
| 2025-06-27 | NP | DIV - Global X SuperDividend U.S. ETF This fund is a listed as child fund of Mirae Asset Global Investments Co., Ltd. and if that institution has disclosed ownership in this security, then these positions will not be double counted when calculating total shares and total value | 605,723 | -4.30 | 12,096 | -9.56 | ||||
| 2025-08-05 | 13F | Levin Capital Strategies, L.p. | 156,498 | -0.07 | 2,900 | -11.88 | ||||
| 2025-08-15 | 13F | CI Private Wealth, LLC | 29,176 | 101.19 | 541 | 77.63 | ||||
| 2025-05-08 | 13F | Tandem Financial, LLC | 0 | -100.00 | 0 | -100.00 | ||||
| 2025-07-24 | NP | FSDIX - Fidelity Strategic Dividend & Income Fund This fund is a listed as child fund of Fmr Llc and if that institution has disclosed ownership in this security, then these positions will not be double counted when calculating total shares and total value | 27,630 | 3.44 | 521 | -6.14 | ||||
| 2025-07-08 | 13F | Nbc Securities, Inc. | 922 | 0.00 | 0 | |||||
| 2025-08-08 | 13F | Cetera Investment Advisers | 58,668 | -1.50 | 1,087 | -13.11 | ||||
| 2025-07-29 | 13F | Spirit Of America Management Corp/ny | 8,000 | 0.00 | 148 | -11.90 | ||||
| 2025-08-19 | 13F | State of Wyoming | 27,053 | 734.20 | 501 | 636.76 | ||||
| 2025-07-25 | 13F | Allspring Global Investments Holdings, LLC | 26,300 | 6.48 | 487 | -5.98 | ||||
| 2025-08-07 | 13F | CENTRAL TRUST Co | 1,275 | 0.00 | 24 | -11.54 | ||||
| 2025-08-15 | 13F | Tower Research Capital LLC (TRC) | 0 | -100.00 | 0 | |||||
| 2025-07-10 | 13F | Wealth Enhancement Advisory Services, Llc | 20,063 | 7.85 | 369 | -5.64 | ||||
| 2025-08-11 | 13F | October Effect Ltd | 22,500 | 417 | ||||||
| 2025-07-25 | 13F | LRI Investments, LLC | 11,270 | -9.73 | 209 | -20.61 | ||||
| 2025-08-14 | 13F | Wells Fargo & Company/mn | 68,607 | -27.90 | 1,271 | -36.42 | ||||
| 2025-08-11 | 13F | Principal Securities, Inc. | 8,221 | 152 | ||||||
| 2025-07-31 | 13F | Optimum Investment Advisors | 604 | 0.00 | 11 | -8.33 | ||||
| 2025-06-17 | NP | GSRAX - Goldman Sachs Rising Dividend Growth Fund Class A | 41,193 | -10.77 | 823 | -15.69 | ||||
| 2025-07-22 | NP | STIAX - Federated Strategic Income Fund Class A Shares | 3,816 | -81.98 | 72 | -83.83 | ||||
| 2025-07-24 | 13F | Us Bancorp \de\ | 500 | 0.00 | 9 | -10.00 | ||||
| 2025-07-10 | 13F | Oliver Lagore Vanvalin Investment Group | 1,951 | 0.00 | 41 | 21.21 | ||||
| 2025-07-10 | 13F | Secure Asset Management, LLC | 0 | -100.00 | 0 | -100.00 | ||||
| 2025-07-18 | 13F | Trust Co Of Vermont | 322 | 0.00 | 6 | -16.67 | ||||
| 2025-08-14 | 13F | Fmr Llc | 63,330 | 137.10 | 1,174 | 109.09 | ||||
| 2025-08-14 | 13F | UBS Group AG | 362,914 | -6.51 | 6,725 | -17.55 | ||||
| 2025-08-14 | 13F | Group One Trading, L.p. | Call | 18,600 | 33.81 | 345 | 17.81 | |||
| 2025-08-14 | 13F | Group One Trading, L.p. | Put | 500 | -54.55 | 9 | -60.87 | |||
| 2025-08-25 | 13F/A | Neuberger Berman Group LLC | 14,500 | 0.00 | 269 | -11.84 | ||||
| 2025-08-14 | 13F | Raymond James Financial Inc | 193,387 | -2.00 | 3,583 | -13.58 | ||||
| 2025-08-13 | 13F | Federated Hermes, Inc. | 71,756 | -34.20 | 1,330 | -41.99 | ||||
| 2025-07-22 | NP | FHYTX - FEDERATED HIGH YIELD TRUST Service Shares | 49,341 | -22.45 | 930 | -29.62 | ||||
| 2025-08-08 | 13F | Avantax Advisory Services, Inc. | 0 | -100.00 | 0 | |||||
| 2025-05-12 | 13F | C2P Capital Advisory Group, LLC d.b.a. Prosperity Capital Advisors | 0 | -100.00 | 0 | -100.00 | ||||
| 2025-08-26 | NP | GOP - Unusual Whales Subversive Republican Trading ETF | 13,376 | -8.57 | 248 | -19.54 | ||||
| 2025-08-12 | 13F | BlackRock, Inc. | 0 | -100.00 | 0 | |||||
| 2025-08-14 | 13F | Jane Street Group, Llc | 122,910 | 2,278 | ||||||
| 2025-08-14 | 13F | Toroso Investments, LLC | 13,376 | -7.25 | 248 | -18.21 | ||||
| 2025-08-12 | 13F | Virtu Financial LLC | 19,315 | 0 | ||||||
| 2025-08-08 | 13F | Creative Planning | 31,421 | 0.91 | 582 | -11.01 | ||||
| 2025-05-19 | 13F | Smith Asset Management Co., LLC | 47,358 | -0.36 | 995 | 21.66 | ||||
| 2025-08-14 | 13F | Aster Capital Management (DIFC) Ltd | 0 | -100.00 | 0 | |||||
| 2025-04-17 | 13F | Copia Wealth Management | 0 | -100.00 | 0 | |||||
| 2025-08-14 | 13F | Van Eck Associates Corp | 0 | -100.00 | 0 | |||||
| 2025-08-14 | 13F | Vivaldi Capital Management, LLC | 0 | -100.00 | 0 | |||||
| 2025-08-13 | 13F | Guggenheim Capital Llc | 10,461 | -0.50 | 194 | -12.27 | ||||
| 2025-08-01 | 13F | Bessemer Group Inc | 0 | -100.00 | 0 | |||||
| 2025-08-14 | 13F | Citadel Advisors Llc | Call | 114,700 | 5.62 | 2,125 | -6.84 | |||
| 2025-08-06 | 13F | Rialto Wealth Management, LLC | 60 | 0.00 | 1 | 0.00 | ||||
| 2025-08-14 | 13F | Citadel Advisors Llc | Put | 24,300 | 17.39 | 450 | 3.69 | |||
| 2025-08-12 | 13F | Wood Tarver Financial Group, LLC | 7,000 | 0.00 | 0 | -100.00 | ||||
| 2025-08-14 | 13F | Gould Capital, LLC | 3,685 | 1.66 | 68 | -10.53 | ||||
| 2025-07-25 | 13F | Community Bank, N.A. | 660 | 0.00 | 12 | -7.69 | ||||
| 2025-08-14 | 13F | Hrt Financial Lp | 54,239 | 1 | ||||||
| 2025-04-29 | 13F | Hm Payson & Co | 2,200 | -81.97 | 46 | -77.99 | ||||
| 2025-08-11 | 13F | Alps Advisors Inc | 13,893,278 | -1.76 | 257,442 | -13.36 | ||||
| 2025-08-01 | 13F | MorganRosel Wealth Management, LLC | 115 | 0.00 | 2 | 0.00 | ||||
| 2025-04-29 | 13F | Lee Danner & Bass Inc | 0 | -100.00 | 0 | -100.00 | ||||
| 2025-08-05 | 13F | Simplex Trading, Llc | Put | 7,900 | -7.06 | 0 | ||||
| 2025-08-05 | 13F | Simplex Trading, Llc | Call | 15,100 | -19.25 | 0 | ||||
| 2025-08-11 | 13F | Delta Asset Management Llc/tn | 61 | 0.00 | 1 | 0.00 | ||||
| 2025-04-23 | 13F | Mascagni Wealth Management, Inc. | 0 | -100.00 | 0 | |||||
| 2025-08-15 | 13F | Morgan Stanley | 1,069,199 | 14.46 | 19,812 | 0.95 | ||||
| 2025-08-05 | 13F | Huntington National Bank | 201 | 0.00 | 4 | -25.00 | ||||
| 2025-07-24 | 13F | Costello Asset Management, INC | 941 | 1.62 | 17 | -10.53 | ||||
| 2025-08-08 | 13F | WASHINGTON TRUST Co | 0 | -100.00 | 0 | |||||
| 2025-05-14 | 13F | Rockefeller Capital Management L.P. | 0 | -100.00 | 0 | |||||
| 2025-07-31 | 13F | Oppenheimer & Co Inc | 0 | -100.00 | 0 | |||||
| 2025-07-23 | 13F | Nbt Bank N A /ny | 300 | 0.00 | 6 | -16.67 | ||||
| 2025-08-13 | 13F | Invesco Ltd. | 46,545 | 8.08 | 862 | -4.65 | ||||
| 2025-08-14 | 13F | Stifel Financial Corp | 27,043 | 36.22 | 501 | 20.14 | ||||
| 2025-07-16 | 13F | Strategic Investment Solutions, Inc. /IL | 154 | 1.32 | 3 | -33.33 | ||||
| 2025-04-22 | 13F | Duncker Streett & Co Inc | 0 | -100.00 | 0 | |||||
| 2025-07-25 | 13F | Concord Wealth Partners | 233 | 0.00 | 4 | 0.00 | ||||
| 2025-08-04 | 13F | Spire Wealth Management | 2,306 | 1.72 | 43 | -10.64 | ||||
| 2025-08-15 | 13F | Kestra Advisory Services, LLC | 15,749 | 20.15 | 292 | 5.82 | ||||
| 2025-08-13 | 13F | Colonial Trust Co / SC | 1,000 | 0.00 | 19 | -14.29 | ||||
| 2025-07-10 | 13F | Legacy Financial Strategies, LLC | 14,000 | 0.00 | 259 | -11.90 | ||||
| 2025-08-01 | 13F | Gwn Securities Inc. | 0 | -100.00 | 0 | |||||
| 2025-08-14 | 13F | Susquehanna International Group, Llp | Put | 27,500 | 177.78 | 510 | 145.89 | |||
| 2025-08-14 | 13F | Susquehanna International Group, Llp | 14,830 | -31.25 | 275 | -39.51 | ||||
| 2025-08-14 | 13F | Susquehanna International Group, Llp | Call | 29,200 | -20.87 | 541 | -30.19 | |||
| 2025-08-14 | 13F | Wealth Advisors of Tampa Bay, LLC | 13,455 | 0.00 | 249 | -11.70 | ||||
| 2025-08-07 | 13F | Kestra Private Wealth Services, Llc | 13,033 | 25.92 | 242 | 11.06 | ||||
| 2025-08-18 | 13F | Front Row Advisors LLC | 481 | 9 | ||||||
| 2025-08-07 | 13F | Allworth Financial LP | 11,514 | 44.70 | 213 | 29.88 | ||||
| 2025-08-14 | 13F | MIRAE ASSET GLOBAL ETFS HOLDINGS Ltd. | 3,985,447 | -6.21 | 73,850 | -17.28 | ||||
| 2025-08-18 | 13F | Geneos Wealth Management Inc. | 2,650 | 0.00 | 49 | -10.91 | ||||
| 2025-08-14 | 13F | Moneta Group Investment Advisors Llc | 63,508 | 1.10 | 1,177 | -10.84 | ||||
| 2025-04-24 | 13F | Wingate Wealth Advisors, Inc. | 0 | -100.00 | 0 | -100.00 | ||||
| 2025-08-12 | 13F | Country Trust Bank | 0 | -100.00 | 0 | |||||
| 2025-08-14 | 13F | Goldman Sachs Group Inc | 1,415,231 | 3.26 | 26,224 | -8.93 | ||||
| 2025-07-31 | 13F | Cambridge Investment Research Advisors, Inc. | 58,847 | -2.35 | 1 | 0.00 | ||||
| 2025-08-14 | 13F | Bank Of America Corp /de/ | 98,158 | 65.75 | 1,819 | 46.14 | ||||
| 2025-07-30 | 13F | Greenup Street Wealth Management Llc | 21,706 | 23.99 | 402 | 9.54 | ||||
| 2025-08-08 | 13F | Pnc Financial Services Group, Inc. | 45,354 | 1.59 | 840 | -10.45 | ||||
| 2025-08-11 | 13F | Citigroup Inc | 3,000 | 56 | ||||||
| 2025-07-21 | 13F | F&V Capital Management, LLC | 0 | -100.00 | 0 | |||||
| 2025-08-13 | 13F | Aristides Capital LLC | 20,294 | -27.78 | 376 | -36.27 | ||||
| 2025-08-25 | NP | ICTUX - ICON UTILITIES AND INCOME FUND Institutional Class | 24,214 | -29.21 | 449 | -37.60 | ||||
| 2025-05-14 | 13F | Bnp Paribas Arbitrage, Sa | 0 | -100.00 | 0 | |||||
| 2025-07-01 | 13F | Harbor Investment Advisory, Llc | 130 | 1.56 | 2 | 0.00 | ||||
| 2025-08-12 | 13F | Bowen Hanes & Co Inc | 816,000 | 0.00 | 15,120 | -11.81 | ||||
| 2025-05-02 | 13F | Capital A Wealth Management, LLC | 0 | -100.00 | 0 | -100.00 | ||||
| 2025-08-12 | 13F | Steward Partners Investment Advisory, Llc | 7,011 | -0.85 | 130 | -12.84 | ||||
| 2025-08-12 | 13F | Proequities, Inc. | Put | 0 | 0 | |||||
| 2025-08-12 | 13F | Proequities, Inc. | Call | 0 | 0 | |||||
| 2025-08-14 | 13F | Blackstone Group Inc | 414,171 | 0.51 | 7,675 | -11.35 | ||||
| 2025-08-12 | 13F | Proequities, Inc. | 0 | 0 | ||||||
| 2025-08-12 | 13F | Jpmorgan Chase & Co | 1,266,303 | 18.72 | 23,465 | 4.71 | ||||
| 2025-08-14 | 13F/A | Barclays Plc | 4,228 | 37.05 | 0 | |||||
| 2025-08-13 | 13F | Summit Financial, LLC | 54,049 | 0.00 | 1,002 | -11.81 | ||||
| 2025-08-14 | 13F | AllSquare Wealth Management LLC | 0 | -100.00 | 0 | |||||
| 2025-07-30 | NP | AMLP - ALERIAN MLP ETF | 14,395,521 | 7.90 | 271,212 | -2.08 | ||||
| 2025-05-27 | NP | RNEW - VanEck Green Infrastructure ETF | 653 | 0.15 | 14 | 18.18 | ||||
| 2025-08-14 | 13F | Evercore Wealth Management, LLC | 45,438 | 0.00 | 842 | -11.84 | ||||
| 2025-08-26 | NP | GAFCX - Virtus AlphaSimplex Global Alternatives Fund Class C | 12,873 | 12.38 | 239 | -0.83 | ||||
| 2025-06-25 | NP | AMZA - InfraCap MLP ETF | 43,224 | 1.32 | 863 | -4.22 | ||||
| 2025-07-18 | 13F | Founders Capital Management | 1,200 | 0.00 | 22 | -12.00 | ||||
| 2025-08-11 | 13F | Private Advisor Group, LLC | 64,326 | 6.05 | 1,192 | -6.51 | ||||
| 2025-08-12 | 13F | Global Retirement Partners, LLC | 400 | 33.33 | 7 | 40.00 | ||||
| 2025-08-14 | 13F | Wiley Bros.-aintree Capital, Llc | 11,523 | 0.69 | 214 | -12.35 | ||||
| 2025-07-08 | 13F | Parallel Advisors, LLC | 1,677 | 0.00 | 31 | -11.43 | ||||
| 2025-07-29 | 13F | Oxbow Advisors, LLC | 11,263 | 0.00 | 209 | -11.86 | ||||
| 2025-08-07 | 13F | Montag A & Associates Inc | 166 | 0.00 | 3 | 0.00 | ||||
| 2025-07-24 | 13F | Wealthstar Advisors, Llc | 36,771 | 7.72 | 681 | -5.02 | ||||
| 2025-07-11 | 13F | Farther Finance Advisors, LLC | 1,363 | 0.00 | 25 | -13.79 | ||||
| 2025-08-15 | 13F | Resources Management Corp /ct/ /adv | 930 | 0.00 | 0 | |||||
| 2025-07-07 | 13F | Fractal Investments LLC | 214,864 | 0.00 | 3,981 | -11.81 | ||||
| 2025-07-25 | 13F | Cwm, Llc | 510 | 0.00 | 0 | |||||
| 2025-08-06 | 13F | Commonwealth Equity Services, Llc | 200,747 | -2.78 | 4 | -25.00 | ||||
| 2025-08-07 | 13F | Commerce Bank | 11,871 | 0.00 | 220 | -12.05 | ||||
| 2025-08-14 | 13F | Infrastructure Capital Advisors, Llc | 43,224 | 17.81 | 801 | -89.12 | ||||
| 2025-08-14 | 13F | Mariner, LLC | 42,272 | 4.60 | 783 | -7.77 | ||||
| 2025-07-30 | NP | MLPA - Global X MLP ETF This fund is a listed as child fund of Mirae Asset Global Investments Co., Ltd. and if that institution has disclosed ownership in this security, then these positions will not be double counted when calculating total shares and total value | 3,340,811 | -7.86 | 62,941 | -16.39 | ||||
| 2025-08-08 | 13F | Compass Wealth Management LLC | 0 | -100.00 | 0 | |||||
| 2025-07-17 | 13F | Sound Income Strategies, LLC | 7,061 | 0.00 | 131 | -12.16 | ||||
| 2025-06-30 | NP | CVY - Invesco Zacks Multi-Asset Income ETF This fund is a listed as child fund of Invesco Ltd. and if that institution has disclosed ownership in this security, then these positions will not be double counted when calculating total shares and total value | 36,600 | -23.77 | 731 | -28.01 | ||||
| 2025-07-15 | 13F | Fifth Third Bancorp | 121 | 0.00 | 2 | 0.00 | ||||
| 2025-07-17 | 13F | Beacon Capital Management, LLC | 59 | 1.72 | 1 | 0.00 | ||||
| 2025-07-29 | 13F | Mb, Levis & Associates, Llc | 211 | 1.44 | 4 | -25.00 | ||||
| 2025-07-25 | 13F | We Are One Seven, LLC | 18,651 | 1.63 | 346 | -10.39 | ||||
| 2025-07-16 | 13F | Signature Resources Capital Management, LLC | 482 | 0.00 | 9 | -20.00 | ||||
| 2025-07-23 | 13F | PARK CIRCLE Co | 33,000 | 0.00 | 611 | -11.83 | ||||
| 2025-07-24 | 13F | IFP Advisors, Inc | 1,000 | 0.00 | 19 | -14.29 | ||||
| 2025-08-14 | 13F | Federation des caisses Desjardins du Quebec | 700 | 0.00 | 13 | -14.29 | ||||
| 2025-08-13 | 13F | Transce3nd, LLC | 0 | -100.00 | 0 | |||||
| 2025-08-14 | 13F | GWM Advisors LLC | 4,836 | 0.62 | 90 | -11.00 | ||||
| 2025-07-30 | 13F | Cullen/frost Bankers, Inc. | 0 | -100.00 | 0 | |||||
| 2025-07-30 | 13F | Princeton Global Asset Management LLC | 4,716 | 0.15 | 87 | -11.22 | ||||
| 2025-08-14 | 13F | Sunbelt Securities, Inc. | 300 | 0.00 | 5 | -16.67 | ||||
| 2025-04-21 | 13F | Nelson, Van Denburg & Campbell Wealth Management Group, LLC | 0 | -100.00 | 0 | |||||
| 2025-07-15 | 13F | Permanent Capital Management, LP | 12,614 | 234 | ||||||
| 2025-07-30 | 13F | Whittier Trust Co Of Nevada Inc | 2,319 | 0.00 | 43 | -12.50 | ||||
| 2025-04-14 | 13F | Cetera Trust Company, N.A | 0 | -100.00 | 0 | -100.00 | ||||
| 2025-07-30 | NP | SOAEX - Spirit of America Energy Fund Class A | 8,000 | 0.00 | 151 | -9.64 | ||||
| 2025-08-13 | 13F | Northwestern Mutual Wealth Management Co | 607 | -64.02 | 11 | -68.57 | ||||
| 2025-07-07 | 13F | Nova Wealth Management, Inc. | 60 | 0.00 | 1 | 0.00 | ||||
| 2025-08-14 | 13F | Royal Bank Of Canada | 22,646 | 1.62 | 420 | -10.45 | ||||
| 2025-07-09 | 13F | WealthCare Investment Partners, LLC | 12,011 | 1.65 | 221 | -7.17 | ||||
| 2025-08-14 | 13F | Safeguard Investment Advisory Group, LLC | 10,890 | 11.17 | 202 | -1.95 | ||||
| 2025-07-29 | NP | MLPEX - Invesco Oppenheimer SteelPath MLP Select 40 Fund Class C | 5,962 | 0.00 | 112 | -8.94 | ||||
| 2025-07-16 | 13F | Signaturefd, Llc | 0 | -100.00 | 0 | |||||
| 2025-08-15 | 13F | Captrust Financial Advisors | 16,414 | -8.85 | 304 | -19.58 | ||||
| 2025-07-10 | 13F | Farmers & Merchants Trust Co of Chambersburg PA | 5,000 | 0.00 | 0 | |||||
| 2025-08-12 | 13F | CIBC Private Wealth Group, LLC | 3,698 | 0.00 | 69 | -4.23 | ||||
| 2025-08-12 | 13F | Bokf, Na | 5,883 | 0.00 | 109 | -11.38 | ||||
| 2025-08-12 | 13F | MAI Capital Management | 4,823 | 0.00 | 89 | -11.88 | ||||
| 2025-07-22 | 13F | Aspire Private Capital, LLC | 15,106 | 0.58 | 280 | -11.43 | ||||
| 2025-08-13 | 13F | Jones Financial Companies Lllp | 8,786 | 23.82 | 164 | 8.67 | ||||
| 2025-08-12 | 13F | Archer Investment Corp | 11,150 | 0.00 | 207 | -11.97 | ||||
| 2025-08-12 | 13F | Pathstone Holdings, LLC | 51,854 | 0.00 | 961 | -11.85 | ||||
| 2025-08-06 | 13F | Ethos Financial Group, LLC | 21,833 | 6.56 | 405 | -6.05 | ||||
| 2025-07-24 | 13F | Trust Co Of Toledo Na /oh/ | 5,556 | 103 | ||||||
| 2025-08-14 | 13F | Glen Eagle Advisors, LLC | 132 | 0.00 | 2 | 0.00 | ||||
| 2025-08-19 | 13F | Newbridge Financial Services Group, Inc. | 32 | 1 | ||||||
| 2025-06-26 | NP | GYLD - Arrow Dow Jones Global Yield ETF | 6,390 | -19.04 | 128 | -23.49 | ||||
| 2025-08-13 | 13F | Lido Advisors, LLC | 169,923 | 0.05 | 3,149 | -11.77 | ||||
| 2025-07-16 | 13F | PFS Partners, LLC | 1,118 | 0.00 | 21 | -13.04 | ||||
| 2025-08-04 | 13F | Assetmark, Inc | 300 | 100.00 | 6 | 66.67 | ||||
| 2025-07-29 | 13F | Koshinski Asset Management, Inc. | 11,000 | 0.00 | 204 | -12.12 | ||||
| 2025-08-05 | 13F | Fourth Dimension Wealth, LLC | 27 | 0.00 | 0 | |||||
| 2025-08-06 | 13F | Ing Groep Nv | 79,000 | 1,464 | ||||||
| 2025-09-04 | 13F/A | Advisor Group Holdings, Inc. | 61,748 | 88.10 | 1,144 | 66.04 | ||||
| 2025-08-13 | 13F | Icon Advisers Inc/co | 24,214 | -29.21 | 449 | -37.60 | ||||
| 2025-05-08 | 13F | Hopwood Financial Services, Inc. | 0 | -100.00 | 0 | -100.00 | ||||
| 2025-07-07 | 13F | Thurston, Springer, Miller, Herd & Titak, Inc. | 500 | 0.00 | 9 | -10.00 | ||||
| 2025-05-13 | 13F | Clearbridge Investments, LLC | 0 | -100.00 | 0 | |||||
| 2025-07-17 | 13F | Independence Bank of Kentucky | 3,000 | 0.00 | 56 | -12.70 | ||||
| 2025-08-08 | 13F | Cherokee Insurance Co | 16,000 | 0.00 | 296 | -11.90 | ||||
| 2025-07-17 | 13F | Janney Montgomery Scott LLC | 55,404 | 9.77 | 1 | 0.00 | ||||
| 2025-08-01 | 13F | Vision Financial Markets Llc | 2,000 | 0.00 | 37 | -11.90 | ||||
| 2025-08-11 | 13F | HighTower Advisors, LLC | 13,769 | 31.61 | 255 | 16.44 | ||||
| 2025-07-21 | NP | GLPAX - Goldman Sachs MLP Energy Infrastructure Fund Class A Shares | 1,098,253 | -4.10 | 20,691 | -12.97 | ||||
| 2025-06-30 | NP | Two Roads Shared Trust - Conductor Global Equity Value ETF | 62,522 | 42.10 | 1,249 | 34.34 |