Mga Batayang Estadistika
| Pemilik Institusional | 128 total, 128 long only, 0 short only, 0 long/short - change of 4.92% MRQ |
| Alokasi Portofolio Rata-rata | 1.4937 % - change of -5.84% MRQ |
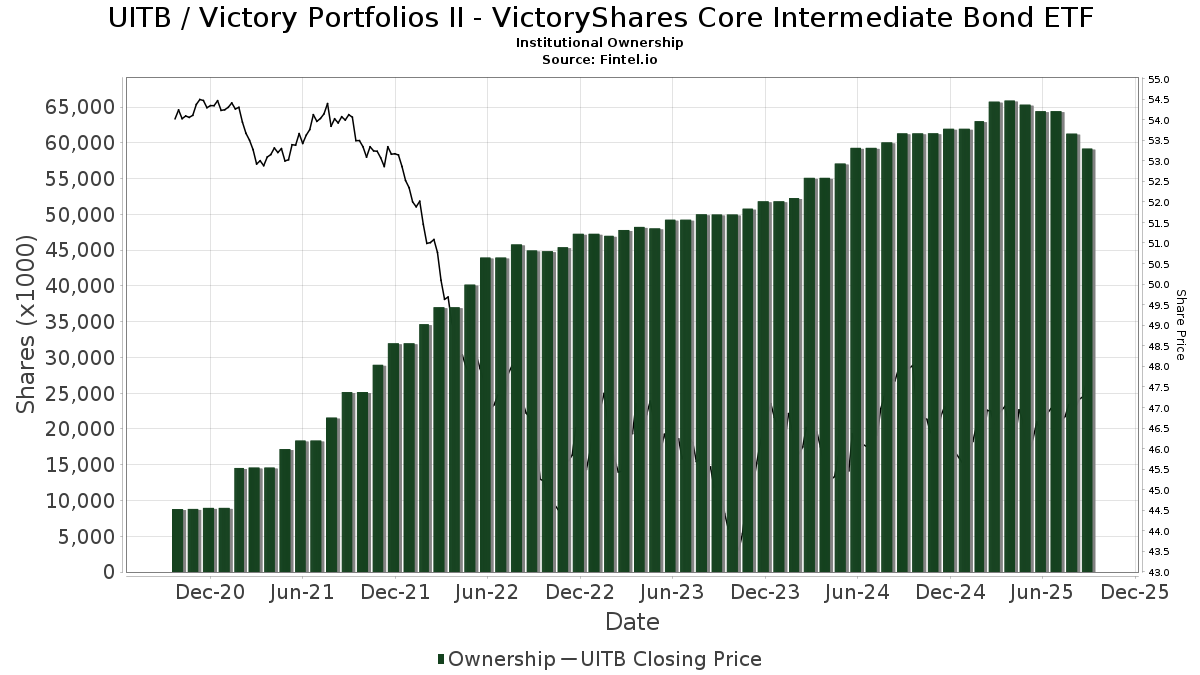
| Saham Institusional (Jangka Panjang) | 59,245,964 (ex 13D/G) - change of -5.20MM shares -8.07% MRQ |
| Nilai Institusional (Jangka Panjang) | $ 2,766,119 USD ($1000) |
Kepemilikan Institusional dan Pemegang Saham
Victory Portfolios II - VictoryShares Core Intermediate Bond ETF (US:UITB) memiliki 128 pemilik institusional dan pemegang saham yang telah mengajukan formulir 13D/G atau 13F kepada Komisi Bursa Efek (Securities Exchange Commission/SEC). Lembaga-lembaga ini memegang total 59,245,964 saham. Pemegang saham terbesar meliputi Victory Capital Management Inc, USCRX - Cornerstone Moderately Aggressive Fund, Charles Schwab Investment Management Inc, USBSX - Cornerstone Moderate Fund, Morgan Stanley, United Services Automobile Association, LPL Financial LLC, Bogart Wealth, LLC, Bank Of America Corp /de/, and Raymond James Financial Inc .
Struktur kepemilikan institusional Victory Portfolios II - VictoryShares Core Intermediate Bond ETF (NasdaqGM:UITB) menunjukkan posisi terkini di perusahaan oleh institusi dan dana, serta perubahan terbaru dalam ukuran posisi. Pemegang saham utama dapat mencakup investor individu, reksa dana, dana lindung nilai, atau institusi. Jadwal 13D menunjukkan bahwa investor memegang (atau pernah memegang) lebih dari 5% saham perusahaan dan bermaksud (atau pernah bermaksud) untuk secara aktif mengejar perubahan strategi bisnis. Jadwal 13G menunjukkan investasi pasif lebih dari 5%.
The share price as of September 5, 2025 is 47.64 / share. Previously, on September 9, 2024, the share price was 48.18 / share. This represents a decline of 1.12% over that period.
Skor Sentimen Dana
Skor Sentimen Dana (sebelumnya dikenal sebagai Skor Akumulasi Kepemilikan) menemukan saham-saham yang paling banyak dibeli oleh dana. Ini adalah hasil dari model kuantitatif multi-faktor yang canggih yang mengidentifikasi perusahaan dengan tingkat akumulasi institusional tertinggi. Model penilaian menggunakan kombinasi dari total peningkatan pemilik yang diungkapkan, perubahan dalam alokasi portofolio pada pemilik tersebut, dan metrik lainnya. Angka berkisar dari 0 hingga 100, dengan angka yang lebih tinggi menunjukkan tingkat akumulasi yang lebih tinggi dibandingkan dengan perusahaan sejenisnya, dan 50 adalah rata-ratanya.
Frekuensi Pembaruan: Setiap Hari
Lihat Ownership Explorer, yang menyediakan daftar perusahaan dengan peringkat tertinggi.
Rasio Put/Call Institusional
Selain melaporkan isu ekuitas dan utang standar, institusi dengan aset di bawah manajemen lebih dari 100 juta dolar AS juga harus mengungkapkan kepemilikan opsi put dan call mereka. Karena opsi put umumnya menunjukkan sentimen negatif, dan opsi call menunjukkan sentimen positif, kita dapat mengetahui sentimen institusional secara keseluruhan dengan memplot rasio put terhadap call. Grafik di sebelah kanan memplot rasio put/call historis untuk instrumen ini.
Menggunakan Rasio Put/Call sebagai indikator sentimen investor mengatasi salah satu kekurangan utama dari penggunaan total kepemilikan institusional, yaitu sejumlah besar aset yang dikelola diinvestasikan secara pasif untuk melacak indeks. Dana yang dikelola secara pasif biasanya tidak membeli opsi, sehingga indikator rasio put/call lebih akurat dalam melacak sentimen dana yang dikelola secara aktif.
Pengajuan 13F dan NPORT
Detail pada pengajuan 13F tersedia gratis. Detail pada pengajuan NP memerlukan keanggotaan premium. Baris berwarna hijau menunjukkan posisi baru. Baris berwarna merah menunjukkan posisi yang sudah ditutup. Klik tautan ini ikon untuk melihat riwayat transaksi selengkapnya.
Tingkatkan
untuk membuka data premium dan mengekspor ke Excel ![]() .
.
| Tanggal File | Sumber | Investor | Ketik | Presyo ng Avg (Silangan) |
Saham | Δ Saham (%) |
Dilaporkan Nilai ($1000) |
Nilai Δ (%) |
Alokasi Port (%) |
|
|---|---|---|---|---|---|---|---|---|---|---|
| 2025-07-25 | NP | USCRX - Cornerstone Moderately Aggressive Fund | 8,400,445 | -20.38 | 390,539 | -21.36 | ||||
| 2025-07-31 | 13F | Insight Wealth Partners, LLC | 103,599 | 7.84 | 4,876 | 8.14 | ||||
| 2025-08-12 | 13F | Proequities, Inc. | 0 | 0 | ||||||
| 2025-08-12 | 13F | LPL Financial LLC | 1,893,921 | 20.75 | 89,147 | 21.09 | ||||
| 2025-04-15 | 13F | Redhawk Wealth Advisors, Inc. | 0 | -100.00 | 0 | |||||
| 2025-08-08 | 13F | Pnc Financial Services Group, Inc. | 0 | -100.00 | 0 | |||||
| 2025-05-01 | 13F | Riversedge Advisors, Llc | 0 | -100.00 | 0 | |||||
| 2025-08-15 | 13F | Equitable Holdings, Inc. | 10,210 | 481 | ||||||
| 2025-03-12 | 13F/A | Private Capital Management Llc | 39,102 | 1,799 | ||||||
| 2025-08-26 | 13F/A | Thrivent Financial For Lutherans | 18,330 | -50.57 | 1 | -100.00 | ||||
| 2025-07-15 | 13F | Axis Wealth Partners, LLC | 60,704 | 19.42 | 2,857 | 19.74 | ||||
| 2025-08-14 | 13F | Susquehanna International Group, Llp | 0 | -100.00 | 0 | |||||
| 2025-07-31 | 13F | Pinnacle Wealth Management Group, Inc. | 175,963 | 4.21 | 8,283 | 4.49 | ||||
| 2025-09-04 | 13F/A | Advisor Group Holdings, Inc. | 143,528 | 40.00 | 6,757 | 40.37 | ||||
| 2025-08-14 | 13F | Wiley Bros.-aintree Capital, Llc | 38,998 | 697.83 | 1,836 | 704.82 | ||||
| 2025-07-22 | 13F | MBL Wealth, LLC | 596,398 | 1.60 | 28,072 | 1.89 | ||||
| 2025-08-04 | 13F | Assetmark, Inc | 13 | 1 | ||||||
| 2025-07-17 | 13F | Alliance Wealth Advisors, LLC | 510,335 | 1.83 | 24,021 | 2.12 | ||||
| 2025-08-12 | 13F | Personal Cfo Solutions, Llc | 10,419 | -13.94 | 490 | -13.73 | ||||
| 2025-08-06 | 13F | HORAN Wealth, LLC | 348,017 | 16,381 | ||||||
| 2025-08-19 | 13F | Advisory Services Network, LLC | 16,257 | -8.41 | 761 | -8.76 | ||||
| 2025-08-14 | 13F | Royal Bank Of Canada | 171,837 | 7.05 | 8,089 | 7.35 | ||||
| 2025-08-01 | 13F | Envestnet Asset Management Inc | 57,491 | 23.78 | 2,706 | 24.13 | ||||
| 2025-07-25 | NP | UCMCX - Cornerstone Moderately Conservative Fund | 805,047 | -22.97 | 37,427 | -23.92 | ||||
| 2025-07-30 | 13F | Smith Thornton Advisors LLC | 122,753 | 1.19 | 5,778 | 1.46 | ||||
| 2025-07-18 | 13F | Newman Dignan & Sheerar, Inc. | 443,544 | 10.00 | 20,878 | 10.30 | ||||
| 2025-08-05 | 13F | Sigma Planning Corp | 17,045 | 4.61 | 802 | 4.97 | ||||
| 2025-07-31 | 13F | Cambridge Investment Research Advisors, Inc. | 131,949 | -32.40 | 6 | -33.33 | ||||
| 2025-08-06 | 13F | Horan Securities, Inc. | 19,672 | 2.60 | 926 | 2.78 | ||||
| 2025-07-14 | 13F | AdvisorNet Financial, Inc | 38,185 | -73.57 | 1,797 | -73.50 | ||||
| 2025-07-14 | 13F | Toth Financial Advisory Corp | 151,484 | 0.97 | 7,130 | 1.25 | ||||
| 2025-07-21 | 13F | Patriot Financial Group Insurance Agency, LLC | 26,620 | 11.01 | 1,253 | 11.38 | ||||
| 2025-08-11 | 13F | Private Advisor Group, LLC | 89,984 | 1.50 | 4,236 | 1.78 | ||||
| 2025-07-25 | NP | USCCX - Cornerstone Conservative Fund | 438,782 | 0.00 | 20,399 | -1.23 | ||||
| 2025-07-29 | 13F | Signature Estate & Investment Advisors Llc | 10,324 | 486 | ||||||
| 2025-08-15 | 13F | United Services Automobile Association | 2,421,191 | 0.00 | 113,965 | 0.28 | ||||
| 2025-08-08 | 13F | Larson Financial Group LLC | 258 | 30.96 | 12 | 33.33 | ||||
| 2025-08-11 | 13F | Principal Securities, Inc. | 0 | -100.00 | 0 | |||||
| 2025-08-08 | 13F | IMA Wealth, Inc. | 192,100 | 5.00 | 9,042 | 5.30 | ||||
| 2025-08-27 | 13F/A | Brinker Capital Investments, LLC | 153,563 | 1,024.59 | 7,228 | 1,029.38 | ||||
| 2025-07-01 | 13F | Harbor Investment Advisory, Llc | 528 | 0.00 | 25 | 0.00 | ||||
| 2025-08-07 | 13F | Kestra Private Wealth Services, Llc | 37,563 | -0.52 | 1,768 | -0.23 | ||||
| 2025-08-12 | 13F | J.w. Cole Advisors, Inc. | 5,034 | 237 | ||||||
| 2025-08-14 | 13F | Integrated Wealth Concepts LLC | 43,937 | 29.50 | 2,068 | 29.90 | ||||
| 2025-05-14 | 13F | Jane Street Group, Llc | 0 | -100.00 | 0 | |||||
| 2025-07-29 | 13F | Private Trust Co Na | 2,914 | 137 | ||||||
| 2025-08-12 | 13F | Gladstone Institutional Advisory LLC | 113,511 | 0.36 | 5,343 | 0.62 | ||||
| 2025-08-01 | 13F | Planning Directions Inc | 227,341 | -0.65 | 10,701 | -0.37 | ||||
| 2025-05-15 | 13F/A | Orion Portfolio Solutions, LLC | 13,655 | -99.12 | 641 | -99.10 | ||||
| 2025-08-14 | 13F | Comerica Bank | 11,391 | -0.80 | 536 | -0.56 | ||||
| 2025-08-14 | 13F | UBS Group AG | 108,368 | 7.49 | 5,101 | 7.78 | ||||
| 2025-08-04 | 13F | Pensionmark Financial Group, Llc | 14,699 | -5.40 | 692 | -5.21 | ||||
| 2025-07-15 | 13F | Fifth Third Bancorp | 4,085 | 73.09 | 192 | 74.55 | ||||
| 2025-08-13 | 13F | Flow Traders U.s. Llc | 0 | -100.00 | 0 | |||||
| 2025-07-28 | 13F | Harbour Investments, Inc. | 87,608 | -2.23 | 4,124 | -1.97 | ||||
| 2025-07-17 | 13F | Cyr Financial Inc. | 187,335 | 10.08 | 8,818 | 10.38 | ||||
| 2025-08-13 | 13F | Northwestern Mutual Wealth Management Co | 46,947 | 6.05 | 2,210 | 6.36 | ||||
| 2025-08-06 | 13F | ZEGA Investments, LLC | 9,442 | 444 | ||||||
| 2025-08-14 | 13F | Certified Advisory Corp | 4,905 | 231 | ||||||
| 2025-07-30 | 13F | Whittier Trust Co Of Nevada Inc | 350 | 0.00 | 16 | 0.00 | ||||
| 2025-07-22 | 13F | Marks Group Wealth Management, Inc | 9,379 | -12.15 | 441 | -11.98 | ||||
| 2025-05-15 | 13F | Mercer Global Advisors Inc /adv | 0 | -100.00 | 0 | |||||
| 2025-08-13 | 13F | Keystone Financial Group | 9,634 | 1.62 | 453 | 2.03 | ||||
| 2025-08-14 | 13F | Ieq Capital, Llc | 7,100 | 0.00 | 334 | 0.30 | ||||
| 2025-07-15 | 13F | Aspire Capital Advisors LLC | 9,470 | 446 | ||||||
| 2025-07-16 | 13F | Novem Group | 12,852 | 12.03 | 605 | 12.27 | ||||
| 2025-09-04 | 13F | ZynergyRetirementPlanningLLC | 0 | -100.00 | 0 | |||||
| 2025-07-16 | 13F | Perigon Wealth Management, LLC | 7,922 | 28.75 | 373 | 29.17 | ||||
| 2025-08-07 | 13F | Meeder Advisory Services, Inc. | 563,374 | 26,518 | ||||||
| 2025-05-07 | 13F | Foundations Investment Advisors, LLC | 0 | -100.00 | 0 | |||||
| 2025-08-14 | 13F | Mpwm Advisory Solutions, Llc | 3,952 | 0.00 | 186 | 0.54 | ||||
| 2025-07-30 | 13F | Princeton Global Asset Management LLC | 9,118 | -8.14 | 429 | -7.74 | ||||
| 2025-08-14 | 13F | Wells Fargo & Company/mn | 795,501 | 32.89 | 37,444 | 33.26 | ||||
| 2025-04-17 | 13F | Sound Income Strategies, LLC | 0 | -100.00 | 0 | |||||
| 2025-08-01 | 13F | Ferguson Shapiro LLC | 22,426 | -0.60 | 1,056 | -0.38 | ||||
| 2025-07-25 | NP | USBSX - Cornerstone Moderate Fund | 4,534,400 | -18.44 | 210,806 | -19.44 | ||||
| 2025-08-14 | 13F | Gotham Asset Management, LLC | 30,732 | 0.00 | 1,447 | 0.28 | ||||
| 2025-08-07 | 13F | Allworth Financial LP | 545,834 | 1.05 | 25,692 | 2.13 | ||||
| 2025-08-12 | 13F | Allen Capital Group, LLC | 862,897 | 11.20 | 40,617 | 11.51 | ||||
| 2025-07-25 | 13F | Pathway Financial Advisors LLC | 360,500 | 127.44 | 16,969 | 128.06 | ||||
| 2025-08-04 | 13F | Daymark Wealth Partners, Llc | 36,702 | -14.68 | 1,728 | -14.46 | ||||
| 2025-08-12 | 13F | Steward Partners Investment Advisory, Llc | 200 | 0.00 | 9 | 0.00 | ||||
| 2025-07-15 | 13F | Avaii Wealth Management, Llc | 10,081 | 11.59 | 475 | 11.79 | ||||
| 2025-05-15 | 13F | Tower Research Capital LLC (TRC) | 0 | -100.00 | 0 | |||||
| 2025-08-12 | 13F | CIBC Private Wealth Group, LLC | 0 | -100.00 | 0 | |||||
| 2025-07-30 | 13F | Atlantic Edge Private Wealth Management, LLC | 263,954 | 3.69 | 12,424 | 3.98 | ||||
| 2025-08-14 | 13F | Bank Of America Corp /de/ | 1,108,736 | 26.19 | 52,188 | 26.54 | ||||
| 2025-05-15 | 13F | Creative Planning | 0 | -100.00 | 0 | |||||
| 2025-05-09 | 13F | Thoroughbred Financial Services, Llc | 0 | -100.00 | 0 | |||||
| 2025-08-15 | 13F | Captrust Financial Advisors | 4,684 | 220 | ||||||
| 2025-07-30 | 13F | Brookstone Capital Management | 27,011 | -1.42 | 1,271 | -1.17 | ||||
| 2025-08-08 | 13F | Cetera Investment Advisers | 898,532 | 40.23 | 42,294 | 40.62 | ||||
| 2025-07-14 | 13F | Strategic Planning Group, Llc | 36,683 | 7.13 | 1,727 | 7.41 | ||||
| 2025-07-21 | 13F | Ameritas Advisory Services, LLC | 6,797 | 42.08 | 320 | 42.41 | ||||
| 2025-07-11 | 13F | Pinnacle Bancorp, Inc. | 3,084 | 0.00 | 145 | 0.69 | ||||
| 2025-08-12 | 13F | WealthTrak Capital Management LLC | 2,661 | 0.00 | 125 | 0.81 | ||||
| 2025-07-25 | 13F | Sovereign Financial Group, Inc. | 11,919 | 0.57 | 561 | 0.90 | ||||
| 2025-07-16 | 13F | Fortune Financial Advisors, LLC | 4,604 | -10.76 | 217 | -10.74 | ||||
| 2025-07-23 | 13F | Valmark Advisers, Inc. | 24,939 | -23.37 | 1,174 | -23.18 | ||||
| 2025-08-14 | 13F | Mml Investors Services, Llc | 51,808 | 26.91 | 2 | 100.00 | ||||
| 2025-08-04 | 13F | Creative Financial Designs Inc /adv | 315,653 | 71.51 | 14,858 | 72.00 | ||||
| 2025-08-13 | 13F | Victory Capital Management Inc | 14,727,145 | -18.51 | 693,207 | -18.28 | ||||
| 2025-08-14 | 13F | Citadel Advisors Llc | 111,472 | 5,247 | ||||||
| 2025-07-15 | 13F | James J. Burns & Company, LLC | 69,951 | -0.81 | 3,293 | -0.54 | ||||
| 2025-08-12 | 13F | Northeast Planning Associates, Inc. / Nh / | 166,626 | 5.38 | 7,843 | 5.69 | ||||
| 2025-08-12 | 13F | Charles Schwab Investment Management Inc | 5,075,676 | -9.45 | 238,912 | -9.20 | ||||
| 2025-08-11 | 13F | Aptus Capital Advisors, LLC | 128,662 | -19.86 | 6,056 | -19.63 | ||||
| 2025-07-10 | 13F | Envision Financial LLC | 149,516 | 3.98 | 7,038 | 4.27 | ||||
| 2025-08-13 | 13F | Congress Wealth Management LLC / DE / | 35,638 | 3.01 | 1,677 | 3.33 | ||||
| 2025-08-14 | 13F | Sargent Investment Group, LLC | 343,153 | 2.00 | 16,150 | 2.27 | ||||
| 2025-07-09 | 13F | Fjell Capital, LLC | 140,596 | 1.38 | 6,618 | 1.64 | ||||
| 2025-07-11 | 13F | Farther Finance Advisors, LLC | 3,586 | 169 | ||||||
| 2025-07-25 | 13F | Wealth Advisory Team LLC | 128,176 | 6,033 | ||||||
| 2025-08-06 | 13F | Commonwealth Equity Services, Llc | 53,862 | -10.16 | 3 | 0.00 | ||||
| 2025-07-10 | 13F | Focus Financial Network, Inc. | 25,742 | 1.86 | 1,212 | 2.11 | ||||
| 2025-08-06 | 13F | SOUTH STATE Corp | 688,649 | -10.77 | 32,415 | -10.52 | ||||
| 2025-08-14 | 13F | Aqr Capital Management Llc | 7,100 | 0.00 | 334 | 0.30 | ||||
| 2025-08-05 | 13F | GPS Wealth Strategies Group, LLC | 150 | -9.09 | 7 | 0.00 | ||||
| 2025-07-21 | 13F | Greenwood Capital Associates Llc | 56,956 | 124.32 | 2,681 | 125.02 | ||||
| 2025-04-16 | 13F | IAG Wealth Partners, LLC | 0 | -100.00 | 0 | |||||
| 2025-08-12 | 13F | Cornerstone Wealth Management, LLC | 16,037 | -6.65 | 755 | -6.45 | ||||
| 2025-08-13 | 13F | Nicolet Advisory Services, Llc | 346,573 | 0.43 | 16,353 | 2.85 | ||||
| 2025-07-25 | NP | UCAGX - Cornerstone Aggressive Fund | 548,471 | -20.33 | 25,499 | -21.32 | ||||
| 2025-08-04 | 13F | Bay Colony Advisory Group, Inc d/b/a Bay Colony Advisors | 4,400 | 1.15 | 207 | 1.97 | ||||
| 2025-07-14 | 13F | Chris Bulman Inc | 22,534 | 6.23 | 1,061 | 6.53 | ||||
| 2025-08-12 | 13F | Jpmorgan Chase & Co | 136,331 | 1.98 | 6,417 | 2.26 | ||||
| 2025-07-21 | 13F | Financial Services Advisory Inc | 129,130 | -8.60 | 6,078 | -8.34 | ||||
| 2025-08-15 | 13F | Morgan Stanley | 3,237,329 | 8.96 | 152,381 | 9.26 | ||||
| 2025-07-17 | 13F | Janney Montgomery Scott LLC | 33,694 | -2.39 | 2 | 0.00 | ||||
| 2025-07-30 | 13F | Klingenstein Fields & Co Lp | 38,727 | 1.05 | 1,823 | 1.28 | ||||
| 2025-08-04 | 13F | Flagship Harbor Advisors, Llc | 0 | -100.00 | 0 | |||||
| 2025-04-17 | 13F | Mission Wealth Management, Lp | 0 | -100.00 | 0 | |||||
| 2025-08-12 | 13F | BlackRock, Inc. | 28,840 | -0.09 | 1,357 | 0.15 | ||||
| 2025-08-14 | 13F | GWM Advisors LLC | 245 | 0.00 | 12 | 0.00 | ||||
| 2025-08-11 | 13F | Citigroup Inc | 19 | 1 | ||||||
| 2025-08-13 | 13F | Capital Analysts, Inc. | 1,081 | 1.03 | 0 | |||||
| 2025-08-12 | 13F | Global Retirement Partners, LLC | 4,964 | 571.72 | 234 | 606.06 | ||||
| 2025-08-14 | 13F | Betterment LLC | 5,565 | -4.33 | 0 | |||||
| 2025-07-10 | 13F | Wealth Enhancement Advisory Services, Llc | 11,956 | 12.28 | 560 | 12.22 | ||||
| 2025-08-14 | 13F | Stifel Financial Corp | 34,340 | -2.03 | 1,616 | -1.76 | ||||
| 2025-07-18 | 13F | Truist Financial Corp | 206,109 | -3.16 | 9,702 | -2.89 | ||||
| 2025-07-29 | 13F | Goldstein Advisors, LLC | 8,026 | -15.98 | 378 | -15.85 | ||||
| 2025-05-07 | 13F | Horan Capital Advisors, LLC. | 339,420 | 1.25 | 15,932 | 3.41 | ||||
| 2025-07-30 | 13F | Sloy Dahl & Holst, LLC | 99,250 | 7.72 | 4,672 | 8.02 | ||||
| 2025-07-30 | 13F | Bogart Wealth, LLC | 1,874,284 | 4.03 | 88,223 | 4.32 | ||||
| 2025-08-11 | 13F | NewEdge Wealth, LLC | 41,588 | -11.99 | 1,957 | -11.77 | ||||
| 2025-08-14 | 13F | Raymond James Financial Inc | 993,575 | 6.23 | 46,768 | 6.52 | ||||
| 2025-05-01 | 13F | Cwm, Llc | 0 | -100.00 | 0 |