Mga Batayang Estadistika
| Pemilik Institusional | 261 total, 261 long only, 0 short only, 0 long/short - change of 4.82% MRQ |
| Alokasi Portofolio Rata-rata | 0.2531 % - change of -9.53% MRQ |
| Saham Institusional (Jangka Panjang) | 49,727,902 (ex 13D/G) - change of 1.80MM shares 3.76% MRQ |
| Nilai Institusional (Jangka Panjang) | $ 1,119,967 USD ($1000) |
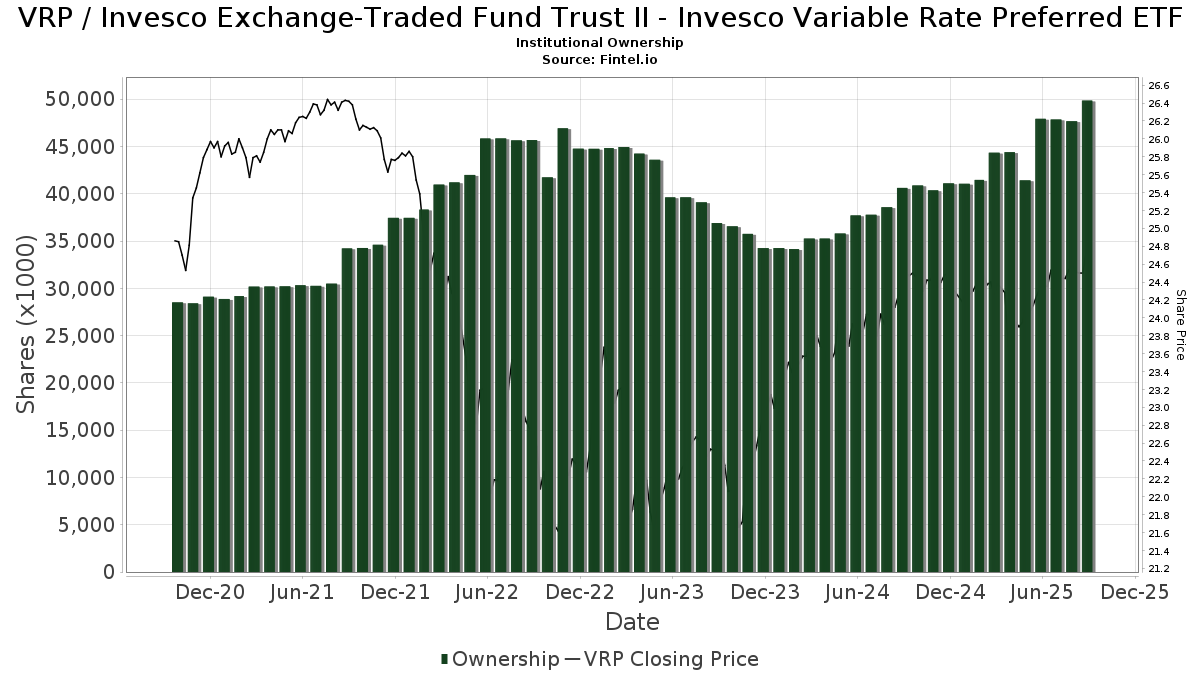
Kepemilikan Institusional dan Pemegang Saham
Invesco Exchange-Traded Fund Trust II - Invesco Variable Rate Preferred ETF (US:VRP) memiliki 261 pemilik institusional dan pemegang saham yang telah mengajukan formulir 13D/G atau 13F kepada Komisi Bursa Efek (Securities Exchange Commission/SEC). Lembaga-lembaga ini memegang total 49,727,902 saham. Pemegang saham terbesar meliputi Bank Of America Corp /de/, Morgan Stanley, Wells Fargo & Company/mn, UBS Group AG, LPL Financial LLC, Proficio Capital Partners LLC, Envestnet Asset Management Inc, Stephens Inc /ar/, Advisors Capital Management, LLC, and Jpmorgan Chase & Co .
Struktur kepemilikan institusional Invesco Exchange-Traded Fund Trust II - Invesco Variable Rate Preferred ETF (ARCA:VRP) menunjukkan posisi terkini di perusahaan oleh institusi dan dana, serta perubahan terbaru dalam ukuran posisi. Pemegang saham utama dapat mencakup investor individu, reksa dana, dana lindung nilai, atau institusi. Jadwal 13D menunjukkan bahwa investor memegang (atau pernah memegang) lebih dari 5% saham perusahaan dan bermaksud (atau pernah bermaksud) untuk secara aktif mengejar perubahan strategi bisnis. Jadwal 13G menunjukkan investasi pasif lebih dari 5%.
The share price as of September 3, 2025 is 24.50 / share. Previously, on September 4, 2024, the share price was 24.25 / share. This represents an increase of 1.03% over that period.
Skor Sentimen Dana
Skor Sentimen Dana (sebelumnya dikenal sebagai Skor Akumulasi Kepemilikan) menemukan saham-saham yang paling banyak dibeli oleh dana. Ini adalah hasil dari model kuantitatif multi-faktor yang canggih yang mengidentifikasi perusahaan dengan tingkat akumulasi institusional tertinggi. Model penilaian menggunakan kombinasi dari total peningkatan pemilik yang diungkapkan, perubahan dalam alokasi portofolio pada pemilik tersebut, dan metrik lainnya. Angka berkisar dari 0 hingga 100, dengan angka yang lebih tinggi menunjukkan tingkat akumulasi yang lebih tinggi dibandingkan dengan perusahaan sejenisnya, dan 50 adalah rata-ratanya.
Frekuensi Pembaruan: Setiap Hari
Lihat Ownership Explorer, yang menyediakan daftar perusahaan dengan peringkat tertinggi.
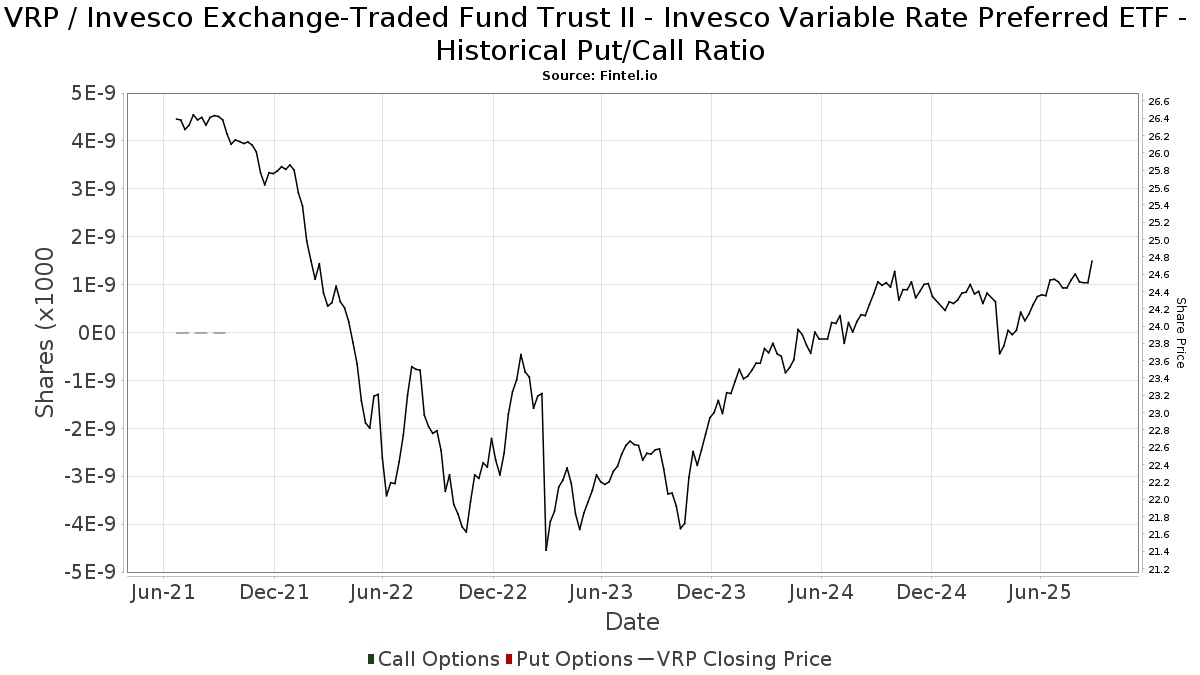
Rasio Put/Call Institusional
Selain melaporkan isu ekuitas dan utang standar, institusi dengan aset di bawah manajemen lebih dari 100 juta dolar AS juga harus mengungkapkan kepemilikan opsi put dan call mereka. Karena opsi put umumnya menunjukkan sentimen negatif, dan opsi call menunjukkan sentimen positif, kita dapat mengetahui sentimen institusional secara keseluruhan dengan memplot rasio put terhadap call. Grafik di sebelah kanan memplot rasio put/call historis untuk instrumen ini.
Menggunakan Rasio Put/Call sebagai indikator sentimen investor mengatasi salah satu kekurangan utama dari penggunaan total kepemilikan institusional, yaitu sejumlah besar aset yang dikelola diinvestasikan secara pasif untuk melacak indeks. Dana yang dikelola secara pasif biasanya tidak membeli opsi, sehingga indikator rasio put/call lebih akurat dalam melacak sentimen dana yang dikelola secara aktif.
Pengajuan 13F dan NPORT
Detail pada pengajuan 13F tersedia gratis. Detail pada pengajuan NP memerlukan keanggotaan premium. Baris berwarna hijau menunjukkan posisi baru. Baris berwarna merah menunjukkan posisi yang sudah ditutup. Klik tautan ini ikon untuk melihat riwayat transaksi selengkapnya.
Tingkatkan
untuk membuka data premium dan mengekspor ke Excel ![]() .
.
| Tanggal File | Sumber | Investor | Ketik | Presyo ng Avg (Silangan) |
Saham | Δ Saham (%) |
Dilaporkan Nilai ($1000) |
Nilai Δ (%) |
Alokasi Port (%) |
|
|---|---|---|---|---|---|---|---|---|---|---|
| 2025-07-28 | 13F | Harbour Investments, Inc. | 4,828 | 7.53 | 118 | 9.26 | ||||
| 2025-08-14 | 13F | Wiley Bros.-aintree Capital, Llc | 10,570 | 258 | ||||||
| 2025-07-24 | 13F | Eastern Bank | 25 | 0.00 | 1 | |||||
| 2025-08-11 | 13F | Westover Capital Advisors, LLC | 345,102 | 8,438 | ||||||
| 2025-05-14 | 13F | Susquehanna International Group, Llp | 0 | -100.00 | 0 | |||||
| 2025-07-28 | 13F | Courier Capital Llc | 25,954 | 0.55 | 635 | 1.44 | ||||
| 2025-07-30 | 13F | First Citizens Bank & Trust Co | 39,652 | 969 | ||||||
| 2025-06-03 | 13F | Invst, LLC | 20,238 | -3.76 | 491 | -3.54 | ||||
| 2025-07-21 | 13F | Synergy Financial Management, LLC | 20,995 | 48.54 | 513 | 50.00 | ||||
| 2025-08-14 | 13F | Gotham Asset Management, LLC | 47,270 | 86.13 | 1,156 | 87.80 | ||||
| 2025-07-17 | 13F | Coastline Trust Co | 4,870 | 0.00 | 119 | 0.85 | ||||
| 2025-07-25 | 13F | Cwm, Llc | 81,349 | 37.08 | 2 | 0.00 | ||||
| 2025-04-25 | 13F | Smallwood Wealth Investment Management, LLC | 1,435 | 35 | ||||||
| 2025-07-21 | 13F | Ameritas Advisory Services, LLC | 55,109 | -16.10 | 1,347 | -15.39 | ||||
| 2025-08-12 | 13F | Fca Corp /tx | 189,326 | 4.52 | 4,629 | 5.44 | ||||
| 2025-08-12 | 13F | Franklin Resources Inc | 169,066 | 57,016.89 | 4,134 | 58,942.86 | ||||
| 2025-08-14 | 13F | Ausdal Financial Partners, Inc. | 48,853 | -14.59 | 1,194 | -13.85 | ||||
| 2025-08-13 | 13F | Advisor Group Holdings, Inc. | 592,875 | -5.66 | 14,416 | -5.37 | ||||
| 2025-07-14 | 13F | Seed Wealth Management, Inc. | 103,610 | 0.00 | 2,533 | 0.88 | ||||
| 2025-07-25 | 13F | Community Bank, N.A. | 1,000 | 24 | ||||||
| 2025-08-07 | 13F | Kestra Private Wealth Services, Llc | 65,730 | -4.73 | 1,607 | -3.89 | ||||
| 2025-08-18 | 13F | Finward Bancorp | 10,585 | -4.51 | 259 | -3.73 | ||||
| 2025-08-08 | 13F | Emerald Investment Partners, Llc | 20,421 | -1.57 | 499 | -0.60 | ||||
| 2025-08-12 | 13F | Stelac Advisory Services LLC | 55,932 | 0.00 | 1,367 | 0.89 | ||||
| 2025-08-06 | 13F | New Millennium Group LLC | 124,305 | 2.63 | 3,039 | 3.54 | ||||
| 2025-08-14 | 13F | Warren Averett Asset Management, LLC | 72,060 | -4.45 | 1,762 | -3.67 | ||||
| 2025-07-09 | 13F | Dynamic Advisor Solutions LLC | 16,748 | 0.88 | 409 | 1.74 | ||||
| 2025-08-12 | 13F | Global Retirement Partners, LLC | 44,282 | 10.75 | 1,083 | 11.89 | ||||
| 2025-08-08 | 13F | Cetera Investment Advisers | 152,778 | -2.48 | 3,735 | -1.63 | ||||
| 2025-08-15 | 13F | Morgan Stanley | 7,984,519 | -6.31 | 195,222 | -5.50 | ||||
| 2025-07-22 | 13F | Partners Wealth Management, Llc | 8,776 | 0.00 | 213 | 0.00 | ||||
| 2025-07-24 | 13F | Blair William & Co/il | 6,485 | 0.00 | 159 | 0.64 | ||||
| 2025-07-17 | 13F | Janney Montgomery Scott LLC | 315,760 | 5.20 | 8 | 0.00 | ||||
| 2025-08-11 | 13F | HighTower Advisors, LLC | 1,043,609 | 2.22 | 25,516 | 3.11 | ||||
| 2025-08-15 | 13F | CI Private Wealth, LLC | 36,992 | 1.43 | 904 | 2.26 | ||||
| 2025-07-14 | 13F | McMahon Financial Advisors, LLC | 22,241 | -6.24 | 544 | -5.40 | ||||
| 2025-08-15 | 13F | Kestra Advisory Services, LLC | 111,400 | 157.00 | 2,724 | 159.33 | ||||
| 2025-08-08 | 13F | Advisors Capital Management, LLC | 1,208,994 | 8.76 | 29,560 | 9.70 | ||||
| 2025-07-21 | 13F | Ntv Asset Management Llc | 100,915 | 23.19 | 2,467 | 24.28 | ||||
| 2025-07-17 | 13F | HB Wealth Management, LLC | 20,474 | 0.56 | 501 | 1.42 | ||||
| 2025-07-31 | 13F | Pacitti Group Inc. | 81,735 | 7.36 | 1,998 | 8.29 | ||||
| 2025-07-24 | 13F | Etesian Wealth Advisors, Inc. | 11,351 | -0.10 | 278 | 0.73 | ||||
| 2025-05-14 | 13F | Van Hulzen Asset Management, LLC | 0 | -100.00 | 0 | -100.00 | ||||
| 2025-07-11 | 13F | SILVER OAK SECURITIES, Inc | 23,410 | -4.29 | 572 | -3.54 | ||||
| 2025-08-04 | 13F | Keybank National Association/oh | 9,837 | 241 | ||||||
| 2025-08-12 | 13F | Jpmorgan Chase & Co | 1,176,181 | 30.18 | 28,758 | 31.30 | ||||
| 2025-08-19 | 13F | Advisory Services Network, LLC | 33,324 | 1.66 | 815 | 2.64 | ||||
| 2025-07-08 | 13F | Everpar Advisors Llc | 10,551 | 0.00 | 258 | 0.78 | ||||
| 2025-07-24 | 13F | Aurora Private Wealth, Inc. | 0 | -100.00 | 0 | |||||
| 2025-08-01 | 13F | Rossby Financial, LCC | 966 | 0.00 | 24 | 0.00 | ||||
| 2025-08-14 | 13F/A | Rockefeller Capital Management L.P. | 156,879 | 2.51 | 3,836 | 3.40 | ||||
| 2025-08-14 | 13F | Comerica Bank | 54,717 | -4.01 | 1,338 | -3.19 | ||||
| 2025-08-08 | 13F | Advisory Resource Group | 73,128 | 4.21 | 1,788 | 5.12 | ||||
| 2025-07-22 | 13F | Old National Bancorp /in/ | 30,542 | -7.71 | 747 | -6.98 | ||||
| 2025-07-25 | 13F | Atria Wealth Solutions, Inc. | 30,406 | 1.79 | 745 | 2.76 | ||||
| 2025-08-06 | 13F | First Horizon Advisors, Inc. | 16,265 | -1.08 | 398 | -0.25 | ||||
| 2025-07-18 | 13F | PFG Investments, LLC | 21,925 | -4.94 | 536 | -4.11 | ||||
| 2025-08-08 | 13F | Evolution Wealth Advisors, LLC | 447,797 | -0.69 | 10,949 | 0.16 | ||||
| 2025-08-01 | 13F | Advisory Alpha, LLC | 185,769 | -36.39 | 4,542 | -35.66 | ||||
| 2025-08-15 | 13F | Alaethes Wealth LLC | 13,402 | 0.00 | 328 | 0.93 | ||||
| 2025-08-14 | 13F | Bnp Paribas Arbitrage, Sa | 0 | -100.00 | 0 | |||||
| 2025-07-15 | 13F | StoneCrest Wealth Management, Inc. | 76,574 | 1,872 | ||||||
| 2025-07-17 | 13F | Investment Research & Advisory Group, Inc. | 9,028 | 0.45 | 221 | 1.38 | ||||
| 2025-08-13 | 13F | Colonial Trust Co / SC | 879 | 0.00 | 21 | 0.00 | ||||
| 2025-08-13 | 13F | Vermillion & White Wealth Management Group, LLC | 997 | 0.00 | 24 | 0.00 | ||||
| 2025-07-17 | 13F | Northwest Wealth Management, Llc | 31,174 | -43.22 | 762 | -42.71 | ||||
| 2025-07-18 | 13F | Cooper Financial Group | 16,489 | -6.01 | 403 | -5.18 | ||||
| 2025-08-08 | 13F | Thoroughbred Financial Services, Llc | 11,533 | 0.00 | 0 | |||||
| 2025-07-11 | 13F | Matthew Goff Investment Advisor, LLC | 433,695 | -32.52 | 10,604 | -31.94 | ||||
| 2025-07-11 | 13F | Farther Finance Advisors, LLC | 14,486 | -5.98 | 354 | -5.09 | ||||
| 2025-04-23 | 13F | International Assets Investment Management, Llc | 0 | -100.00 | 0 | -100.00 | ||||
| 2025-08-08 | 13F | Pnc Financial Services Group, Inc. | 1,367 | 0.00 | 33 | 0.00 | ||||
| 2025-08-08 | 13F | Spectrum Asset Management, Inc. | 342,707 | 336.84 | 8,379 | 340.77 | ||||
| 2025-07-10 | 13F | High Net Worth Advisory Group LLC | 10,800 | 0.00 | 264 | 1.15 | ||||
| 2025-05-15 | 13F | Citadel Advisors Llc | 0 | -100.00 | 0 | |||||
| 2025-07-17 | 13F | Patton Albertson Miller Group, Llc | 10,941 | -4.33 | 268 | -3.61 | ||||
| 2025-08-11 | 13F | Citigroup Inc | 175,937 | 1.95 | 4,302 | 2.85 | ||||
| 2025-07-14 | 13F | Westend Capital Management LLC | 4,430 | 0.00 | 108 | 0.93 | ||||
| 2025-08-06 | 13F | Pekin Hardy Strauss, Inc. | 31,935 | 0.00 | 781 | 0.78 | ||||
| 2025-08-12 | 13F | Insigneo Advisory Services, Llc | 14,457 | -25.90 | 353 | -25.21 | ||||
| 2025-08-14 | 13F | Aft, Forsyth & Company, Inc. | 14,362 | -20.93 | 351 | -20.23 | ||||
| 2025-07-14 | 13F | Clear Harbor Asset Management, LLC | 33,535 | -5.63 | 820 | -4.88 | ||||
| 2025-07-24 | 13F | IFP Advisors, Inc | 64,938 | 3.77 | 1,588 | 4.68 | ||||
| 2025-08-11 | 13F | Beta Wealth Group, Inc. | 93,078 | 6.47 | 2,276 | 7.36 | ||||
| 2025-08-12 | 13F | CIBC Private Wealth Group, LLC | 9,370 | 0.00 | 229 | 5.05 | ||||
| 2025-08-13 | 13F | Boston Family Office Llc | 243,581 | 4.41 | 6 | 0.00 | ||||
| 2025-08-14 | 13F | Diversify Wealth Management, Llc | 27,411 | 54.45 | 673 | 58.35 | ||||
| 2025-08-11 | 13F | Principal Securities, Inc. | 179,153 | 4.19 | 4,380 | 5.31 | ||||
| 2025-05-15 | 13F | First Manhattan Co | 0 | -100.00 | 0 | |||||
| 2025-08-13 | 13F | Jones Financial Companies Lllp | 44,156 | 37.44 | 1,077 | 38.13 | ||||
| 2025-08-06 | 13F | Hallmark Capital Management Inc | 14,612 | -2.48 | 357 | -1.65 | ||||
| 2025-08-07 | 13F | Midwest Trust Co | 45,782 | 1,119 | ||||||
| 2025-08-14 | 13F | Wells Fargo & Company/mn | 3,083,255 | 21.31 | 75,386 | 22.36 | ||||
| 2025-08-04 | 13F | Kovack Advisors, Inc. | 12,103 | -4.09 | 296 | -3.28 | ||||
| 2025-07-08 | 13F | Nbc Securities, Inc. | 1,715 | 0 | ||||||
| 2025-07-29 | 13F | Woodard & Co Asset Management Group Inc /adv | 302 | 0.00 | 7 | 0.00 | ||||
| 2025-07-16 | 13F | Brown, Lisle/cummings, Inc. | 49,218 | -1.17 | 1,203 | -0.33 | ||||
| 2025-08-14 | 13F | Pine Harbor Wealth Management, LLC | 17,749 | -6.10 | 434 | -5.46 | ||||
| 2025-07-29 | 13F | Stephens Inc /ar/ | 1,384,622 | 0.47 | 33,854 | 1.35 | ||||
| 2025-08-04 | 13F | AlphaStar Capital Management, LLC | 20,035 | -90.76 | 490 | -90.69 | ||||
| 2025-07-17 | 13F | Delta Capital Management Llc | 37,405 | 0.00 | 1 | |||||
| 2025-04-24 | 13F | Wright Fund Managment, LLC | 0 | -100.00 | 0 | |||||
| 2025-08-07 | 13F | CENTRAL TRUST Co | 14 | 0 | ||||||
| 2025-08-07 | 13F | LFA - Lugano Financial Advisors SA | 2,140 | 0.00 | 52 | 1.96 | ||||
| 2025-08-14 | 13F/A | Skopos Labs, Inc. | 127 | 3 | ||||||
| 2025-08-11 | 13F | Estate Counselors, LLC | 0 | -100.00 | 0 | |||||
| 2025-08-11 | 13F | Elequin Capital Lp | 25,952 | 635 | ||||||
| 2025-08-27 | 13F/A | Brinker Capital Investments, LLC | 90,273 | 1.29 | 2,207 | 2.18 | ||||
| 2025-07-08 | 13F | Atwood & Palmer Inc | 1,895 | -43.77 | 46 | -43.21 | ||||
| 2025-08-11 | 13F | Private Advisor Group, LLC | 158,839 | 2.38 | 3,884 | 3.27 | ||||
| 2025-04-29 | 13F | Hm Payson & Co | 1,388 | 0.00 | 34 | 0.00 | ||||
| 2025-08-12 | 13F | Calton & Associates, Inc. | 11,546 | 282 | ||||||
| 2025-08-14 | 13F | AllSquare Wealth Management LLC | 15,700 | 0.00 | 384 | 0.79 | ||||
| 2025-08-18 | 13F/A | National Bank Of Canada /fi/ | 2,662 | 0.00 | 65 | 1.56 | ||||
| 2025-08-14 | 13F | McIlrath & Eck, LLC | 800 | 0.00 | 20 | 0.00 | ||||
| 2025-07-15 | 13F | Unified Investment Management | 15,504 | 0.30 | 379 | 1.34 | ||||
| 2025-08-13 | 13F | Baird Financial Group, Inc. | 242,998 | -35.32 | 5,941 | -34.76 | ||||
| 2025-08-08 | NP | QALTX - Quantified Alternative Investment Fund Investor Class Shares | 1,666 | -92.97 | 41 | -93.03 | ||||
| 2025-08-06 | 13F | Wedbush Securities Inc | 72,698 | -6.81 | 2 | 0.00 | ||||
| 2025-07-17 | 13F | Raleigh Capital Management Inc. | 0 | -100.00 | 0 | |||||
| 2025-08-27 | NP | ACTIX - Advisors Capital Tactical Fixed Income Fund | 625,900 | 16.90 | 15,303 | 17.91 | ||||
| 2025-08-14 | 13F | Jane Street Group, Llc | 0 | -100.00 | 0 | |||||
| 2025-07-17 | 13F | SeaBridge Investment Advisors LLC | 259,445 | 19.99 | 6,343 | 21.03 | ||||
| 2025-08-11 | 13F | Brown Brothers Harriman & Co | 6,038 | 0.00 | 148 | 0.68 | ||||
| 2025-08-15 | 13F | Prevail Innovative Wealth Advisors, Llc | 47,308 | 29.24 | 1,157 | 30.33 | ||||
| 2025-08-08 | 13F | Ironwood Investment Counsel, LLC | 14,733 | -13.59 | 360 | -12.83 | ||||
| 2025-08-14 | 13F | UBS Group AG | 2,235,509 | -5.15 | 54,658 | -4.33 | ||||
| 2025-07-29 | 13F | Private Trust Co Na | 941 | 12.97 | 23 | 15.00 | ||||
| 2025-07-29 | 13F | Koshinski Asset Management, Inc. | 9,441 | 0.00 | 231 | 0.88 | ||||
| 2025-08-15 | 13F | Equitable Holdings, Inc. | 13,371 | -21.55 | 327 | -21.07 | ||||
| 2025-07-16 | 13F | Northern Oak Wealth Management Inc | 18,625 | 0.10 | 455 | 0.89 | ||||
| 2025-07-21 | 13F | Pflug Koory, LLC | 2,267 | 1.34 | 55 | 1.85 | ||||
| 2025-08-08 | 13F | Avantax Advisory Services, Inc. | 24,216 | -2.20 | 592 | -1.33 | ||||
| 2025-07-11 | 13F | Windsor Capital Management, LLC | 333,082 | -0.31 | 8,144 | 0.56 | ||||
| 2025-07-16 | 13F | ORG Partners LLC | 5,900 | 0.00 | 144 | 0.70 | ||||
| 2025-08-04 | 13F | Assetmark, Inc | 91 | 0.00 | 2 | 0.00 | ||||
| 2025-07-11 | 13F | Diversified Trust Co | 15,372 | 376 | ||||||
| 2025-08-11 | 13F | Addison Capital Co | 95,587 | 5.51 | 2,337 | 6.42 | ||||
| 2025-08-14 | 13F | Mercer Global Advisors Inc /adv | 10,438 | -51.67 | 255 | -51.24 | ||||
| 2025-07-22 | 13F | Diligent Investors, LLC | 52,622 | 0.19 | 1,287 | 1.02 | ||||
| 2025-05-06 | 13F | Boyd Watterson Asset Management Llc/oh | 0 | -100.00 | 0 | |||||
| 2025-05-28 | 13F | Wealth Management Associates, Inc. | 0 | -100.00 | 0 | -100.00 | ||||
| 2025-08-11 | 13F | Nordwand Advisors, LLC | 1,600 | 39 | ||||||
| 2025-08-14 | 13F | Qube Research & Technologies Ltd | 14,721 | 33.62 | 360 | 34.46 | ||||
| 2025-05-15 | 13F/A | Orion Portfolio Solutions, LLC | 89,125 | -16.33 | 2,160 | -16.15 | ||||
| 2025-07-25 | 13F | Hazlett, Burt & Watson, Inc. | 1,926 | -35.09 | 0 | |||||
| 2025-07-28 | 13F | Elmwood Wealth Management, Inc. | 141,824 | -4.30 | 3,468 | -3.48 | ||||
| 2025-08-06 | 13F | Commonwealth Equity Services, Llc | 233,194 | -8.56 | 6 | -16.67 | ||||
| 2025-08-12 | 13F | BlackRock, Inc. | 476 | 0.00 | 12 | 0.00 | ||||
| 2025-08-25 | 13F/A | Neuberger Berman Group LLC | 13,346 | 29.13 | 326 | 30.40 | ||||
| 2025-08-11 | 13F | Rothschild Investment Llc | 150 | 0.00 | 4 | 0.00 | ||||
| 2025-05-20 | 13F/A | Colony Group, LLC | 0 | -100.00 | 0 | -100.00 | ||||
| 2025-07-22 | 13F | Wealthcare Advisory Partners LLC | 203,814 | 2,329.25 | 4,983 | 2,354.68 | ||||
| 2025-07-29 | 13F | Cottonwood Capital Advisors, Llc | 137,175 | -0.61 | 3,354 | 0.24 | ||||
| 2025-08-06 | 13F | Texas Yale Capital Corp. | 12,623 | 32.59 | 309 | 33.91 | ||||
| 2025-08-08 | 13F | King Wealth | 39,833 | -6.35 | 1 | -100.00 | ||||
| 2025-08-14 | 13F | Dearborn Partners Llc | 68,988 | -15.69 | 1,687 | -14.98 | ||||
| 2025-08-01 | 13F | Chilton Capital Management Llc | 9,874 | -2.09 | 241 | -1.23 | ||||
| 2025-08-08 | 13F | Capital Investment Advisory Services, LLC | 47,490 | 4.42 | 1,161 | 5.35 | ||||
| 2025-07-22 | 13F | Accel Wealth Management | 21,617 | 129.04 | 529 | 131.58 | ||||
| 2025-08-05 | 13F | Cherry Tree Wealth Management, LLC | 89,983 | -0.50 | 2,200 | 0.36 | ||||
| 2025-08-14 | 13F | Mml Investors Services, Llc | 341,574 | -2.83 | 8 | 0.00 | ||||
| 2025-08-07 | 13F | Proficio Capital Partners LLC | 1,935,255 | 22,363.78 | 1,946 | 835.58 | ||||
| 2025-08-14 | 13F | Raymond James Financial Inc | 580,324 | 26.41 | 14,189 | 27.50 | ||||
| 2025-07-17 | 13F | Sound Income Strategies, LLC | 0 | -100.00 | 0 | |||||
| 2025-08-14 | 13F | Redwood Financial Network Corp | 10,020 | -18.11 | 245 | -17.57 | ||||
| 2025-04-15 | 13F | Zhang Financial LLC | 0 | -100.00 | 0 | -100.00 | ||||
| 2025-08-12 | 13F | Proequities, Inc. | 0 | 0 | ||||||
| 2025-07-14 | 13F | AdvisorNet Financial, Inc | 221 | 5 | ||||||
| 2025-07-18 | 13F | Truist Financial Corp | 10,043 | -28.52 | 246 | -27.94 | ||||
| 2025-08-12 | 13F | AlphaCore Capital LLC | 32,202 | 0.00 | 787 | 0.90 | ||||
| 2025-07-08 | 13F | Goldstone Financial Group, LLC | 74,809 | 10.45 | 1,833 | 11.64 | ||||
| 2025-08-05 | 13F | Bank Of Montreal /can/ | 0 | -100.00 | 0 | |||||
| 2025-07-07 | 13F | Trust Co Of Oklahoma | 10,106 | 0.00 | 247 | 1.23 | ||||
| 2025-07-21 | 13F | Mechanics Financial Corp | 1,100 | 0.00 | 27 | 0.00 | ||||
| 2025-08-11 | 13F | Strategic Wealth Partners, Ltd. | 1,078 | 26 | ||||||
| 2025-08-14 | 13F | Prelude Capital Management, Llc | 0 | -100.00 | 0 | |||||
| 2025-07-31 | 13F | Oppenheimer & Co Inc | 24,084 | -3.10 | 589 | -2.33 | ||||
| 2025-07-09 | 13F | Byrne Asset Management LLC | 80 | 0.00 | 2 | 0.00 | ||||
| 2025-08-14 | 13F | TCG Advisory Services, LLC | 88,519 | -12.52 | 2,164 | -11.75 | ||||
| 2025-05-09 | 13F | CoreCap Advisors, LLC | 0 | -100.00 | 0 | |||||
| 2025-08-11 | 13F | Walter & Keenan Financial Consulting Co /mi/ /adv | 33,526 | -16.99 | 820 | -16.26 | ||||
| 2025-08-07 | 13F | Allworth Financial LP | 19 | 0 | ||||||
| 2025-07-10 | 13F | Wealth Enhancement Advisory Services, Llc | 171,968 | -8.69 | 4,213 | -7.71 | ||||
| 2025-08-14 | 13F | GWM Advisors LLC | 19,496 | 16.11 | 477 | 16.95 | ||||
| 2025-07-30 | 13F | Whittier Trust Co Of Nevada Inc | 29,224 | -26.57 | 715 | -25.93 | ||||
| 2025-07-09 | 13F | WealthCare Investment Partners, LLC | 56,461 | -10.53 | 1,383 | -7.86 | ||||
| 2025-07-30 | 13F | Whittier Trust Co | 168,935 | -2.71 | 4,130 | -1.83 | ||||
| 2025-07-31 | 13F | Burke & Herbert Bank & Trust Co | 62,980 | 0.00 | 1,540 | 0.85 | ||||
| 2025-08-07 | 13F | Pinnacle Wealth Management Advisory Group, LLC | 17,404 | 0.00 | 426 | 0.95 | ||||
| 2025-07-28 | 13F | Duncker Streett & Co Inc | 100,088 | -0.79 | 2,447 | 0.08 | ||||
| 2025-08-05 | 13F | Bank of New York Mellon Corp | 21,683 | -13.23 | 530 | -12.40 | ||||
| 2025-08-12 | 13F | Horizon Financial Services, Llc | 872 | 0.00 | 21 | 0.00 | ||||
| 2025-08-13 | 13F | First Trust Advisors Lp | 18,000 | 440 | ||||||
| 2025-08-04 | 13F | Migdal Insurance & Financial Holdings Ltd. | 400,000 | 0.00 | 10 | 0.00 | ||||
| 2025-08-19 | 13F | National Asset Management, Inc. | 0 | -100.00 | 0 | |||||
| 2025-08-13 | 13F | RPg Family Wealth Advisory, LLC | 174,708 | 3.84 | 4,272 | 4.73 | ||||
| 2025-08-12 | 13F | Steward Partners Investment Advisory, Llc | 40,302 | -7.39 | 985 | -6.55 | ||||
| 2025-07-16 | 13F | Signaturefd, Llc | 42 | -46.84 | 1 | 0.00 | ||||
| 2025-07-31 | 13F | Glass Jacobson Investment Advisors llc | 0 | -100.00 | 0 | |||||
| 2025-08-01 | 13F | Financial Counselors Inc | 0 | -100.00 | 0 | |||||
| 2025-08-14 | 13F | Goldman Sachs Group Inc | 91,743 | 10.08 | 2,243 | 11.04 | ||||
| 2025-07-15 | 13F | Graypoint LLC | 50,591 | -7.13 | 1,237 | -6.36 | ||||
| 2025-08-14 | 13F | MGB Wealth Management, LLC | 22,080 | 15.85 | 540 | 16.67 | ||||
| 2025-08-05 | 13F | Marion Wealth Management | 11,755 | -1.91 | 287 | -1.03 | ||||
| 2025-08-14 | 13F | Royal Bank Of Canada | 551,527 | 4.00 | 13,486 | 4.91 | ||||
| 2025-08-08 | 13F | Meridian Wealth Management, LLC | 226,054 | -6.19 | 5,527 | -5.38 | ||||
| 2025-04-23 | 13F | Western Wealth Management, LLC | 0 | -100.00 | 0 | -100.00 | ||||
| 2025-07-21 | 13F | Barrett & Company, Inc. | 2,675 | 0.00 | 65 | 1.56 | ||||
| 2025-07-25 | 13F | Endowment Wealth Management, Inc. | 12,827 | 9.74 | 314 | 10.60 | ||||
| 2025-08-04 | 13F | Integrity Alliance, Llc. | 17,877 | -91.88 | 437 | -91.81 | ||||
| 2025-08-01 | 13F | Ashton Thomas Private Wealth, LLC | 391,247 | 4.20 | 9,566 | 5.10 | ||||
| 2025-08-12 | 13F | Gladstone Institutional Advisory LLC | 40,568 | 4.28 | 992 | 5.09 | ||||
| 2025-07-07 | 13F | Wesbanco Bank Inc | 70,279 | 1,718 | ||||||
| 2025-08-01 | 13F | Envestnet Asset Management Inc | 1,462,600 | 11.63 | 35,761 | 12.59 | ||||
| 2025-07-14 | 13F | UMA Financial Services, Inc. | 265 | 6 | ||||||
| 2025-07-15 | 13F | Fifth Third Bancorp | 4,200 | 0.00 | 103 | 0.99 | ||||
| 2025-08-06 | 13F | AE Wealth Management LLC | 156 | -74.21 | 4 | -78.57 | ||||
| 2025-08-18 | 13F | Old North State Trust, LLC | 9,087 | 0.00 | 0 | |||||
| 2025-08-14 | 13F | Benjamin Edwards Inc | 530,289 | -9.00 | 12,966 | -8.22 | ||||
| 2025-07-31 | 13F | Cambridge Investment Research Advisors, Inc. | 103,903 | -51.35 | 3 | -60.00 | ||||
| 2025-08-14 | 13F | Coastal Bridge Advisors, LLC | 12,029 | 0.30 | 294 | 1.38 | ||||
| 2025-07-08 | 13F | Parallel Advisors, LLC | 770 | 19 | ||||||
| 2025-07-24 | 13F | Us Bancorp \de\ | 0 | -100.00 | 0 | |||||
| 2025-08-14 | 13F | Mariner, LLC | 15,565 | 381 | ||||||
| 2025-07-08 | 13F | First National Corp /ma/ /adv | 114,306 | 10.41 | 2,795 | 11.36 | ||||
| 2025-08-05 | 13F | Transatlantique Private Wealth Llc | 14,001 | 0.00 | 342 | 0.88 | ||||
| 2025-08-14 | 13F | Ancora Advisors, LLC | 7,541 | 41.88 | 184 | 43.75 | ||||
| 2025-07-14 | 13F | Park Avenue Securities Llc | 160,647 | 4 | ||||||
| 2025-08-07 | 13F | Commerce Bank | 8,881 | 0.00 | 217 | 0.93 | ||||
| 2025-08-11 | 13F | United Capital Financial Advisers, Llc | 11,944 | -33.49 | 292 | -32.87 | ||||
| 2025-08-13 | 13F | Transce3nd, LLC | 136 | -39.56 | 3 | -40.00 | ||||
| 2025-07-29 | 13F | Stratos Wealth Partners, LTD. | 8,877 | 1.32 | 217 | 2.36 | ||||
| 2025-07-30 | 13F | D.a. Davidson & Co. | 46,200 | 5.90 | 1,130 | 6.81 | ||||
| 2025-07-15 | 13F | RVW Wealth, LLC | 11,314 | 0.00 | 277 | 0.73 | ||||
| 2025-08-14 | 13F | Bank Of America Corp /de/ | 7,993,469 | 4.88 | 195,440 | 5.79 | ||||
| 2025-08-07 | 13F | Palouse Capital Management, Inc. | 22,344 | -2.04 | 546 | -1.09 | ||||
| 2025-07-28 | 13F | BRYN MAWR TRUST Co | 0 | -100.00 | 0 | |||||
| 2025-08-14 | 13F | Stifel Financial Corp | 564,230 | -1.08 | 13,795 | -0.22 | ||||
| 2025-08-05 | 13F | Key FInancial Inc | 2,111 | 0.00 | 52 | 0.00 | ||||
| 2025-08-13 | 13F | Northwestern Mutual Wealth Management Co | 146,993 | 20.11 | 3,594 | 21.14 | ||||
| 2025-07-11 | 13F | Williams Financial, LLC | 0 | -100.00 | 0 | |||||
| 2025-08-05 | 13F | Advisors Preferred, LLC | 1,666 | -92.97 | 41 | -93.03 | ||||
| 2025-08-05 | 13F | Sigma Planning Corp | 9,265 | 227 | ||||||
| 2025-08-18 | 13F | Geneos Wealth Management Inc. | 12,432 | 9.17 | 304 | 9.78 | ||||
| 2025-04-24 | 13F | Family Investment Center, Inc. | 0 | -100.00 | 0 | |||||
| 2025-08-14 | 13F | Diversify Advisory Services, LLC | 8,964 | 220 | ||||||
| 2025-08-14 | 13F | Ameriprise Financial Inc | 564,744 | -3.23 | 13,808 | -1.85 | ||||
| 2025-07-29 | 13F | Activest Wealth Management | 52,466 | 0.33 | 1,283 | 1.18 | ||||
| 2025-07-29 | 13F | Vectors Research Management, LLC | 29,923 | 1.22 | 732 | 2.09 | ||||
| 2025-07-17 | 13F | Vermillion Wealth Management, Inc. | 982 | 0.00 | 24 | 4.35 | ||||
| 2025-07-17 | 13F | Venture Visionary Partners LLC | 19,707 | 0.00 | 482 | 0.84 | ||||
| 2025-07-31 | 13F | Nilsine Partners, LLC | 226,080 | 4.51 | 5,528 | 5.42 | ||||
| 2025-08-13 | 13F | Fort Sheridan Advisors Llc | 18,700 | -9.66 | 457 | -8.78 | ||||
| 2025-08-13 | 13F | Renaissance Technologies Llc | 264,159 | 61.81 | 6,459 | 63.20 | ||||
| 2025-07-31 | 13F | Jackson Hole Capital Partners, LLC | 71,743 | -0.26 | 1,754 | 0.63 | ||||
| 2025-08-12 | 13F | O'shaughnessy Asset Management, Llc | 1 | 0.00 | 0 | |||||
| 2025-08-04 | 13F | Pinnacle Associates Ltd | 36,652 | -2.53 | 896 | -1.65 | ||||
| 2025-08-08 | 13F | Citizens Financial Group Inc/ri | 10,000 | 244 | ||||||
| 2025-08-11 | 13F | Oder Investment Management, LLC | 100,937 | 4.19 | 2,468 | 5.07 | ||||
| 2025-07-10 | 13F | SK Wealth Management, LLC | 24,563 | -4.85 | 603 | -1.95 | ||||
| 2025-07-31 | 13F | Buckingham Strategic Partners | 31,406 | -42.80 | 768 | -42.33 | ||||
| 2025-08-14 | 13F | Fmr Llc | 2,343 | 136.19 | 57 | 137.50 | ||||
| 2025-08-08 | 13F | Principal Financial Group Inc | 50,671 | 1,239 | ||||||
| 2025-08-05 | 13F | J. W. Coons Advisors, LLC | 32,645 | -3.70 | 798 | -2.80 | ||||
| 2025-08-19 | 13F | Newbridge Financial Services Group, Inc. | 79 | 0.00 | 2 | 0.00 | ||||
| 2025-08-04 | 13F | Atria Investments Llc | 98,313 | 975.99 | 2,404 | 987.33 | ||||
| 2025-08-13 | 13F | Invesco Ltd. | 257,976 | -2.65 | 6,308 | -1.81 | ||||
| 2025-08-11 | 13F | Howard Wealth Management, Llc | 81,496 | 11.51 | 1,993 | 12.48 | ||||
| 2025-07-29 | 13F | Disciplined Investments, LLC | 12,905 | 0.05 | 316 | 0.96 | ||||
| 2025-07-24 | 13F | Comprehensive Money Management Services LLC | 16,212 | -4.42 | 396 | -3.65 | ||||
| 2025-08-01 | 13F | James Investment Research Inc | 60,479 | 0.00 | 1,479 | 0.82 | ||||
| 2025-08-05 | 13F | GPS Wealth Strategies Group, LLC | 375 | 9 | ||||||
| 2025-07-25 | 13F | Envestnet Portfolio Solutions, Inc. | 115,026 | 22.58 | 2,812 | 23.66 | ||||
| 2025-08-13 | 13F | StoneX Group Inc. | 8,309 | -4.68 | 203 | -3.79 | ||||
| 2025-08-13 | 13F | Cary Street Partners Financial Llc | 66,372 | 0.91 | 1,623 | 1.76 | ||||
| 2025-07-30 | 13F | Roman Butler Fullerton & Co | 20,002 | 0.22 | 489 | 3.16 | ||||
| 2025-08-12 | 13F | Segall Bryant & Hamill, Llc | 20,813 | 0.09 | 509 | 0.79 | ||||
| 2025-08-12 | 13F | Tradition Wealth Management, LLC | 19,642 | -1.52 | 480 | -0.62 | ||||
| 2025-07-30 | 13F | Klingman & Associates, LLC | 24,324 | -1.82 | 595 | -1.00 | ||||
| 2025-08-12 | 13F | MAI Capital Management | 331,837 | -7.32 | 8,113 | -6.52 | ||||
| 2025-08-15 | 13F | Tower Research Capital LLC (TRC) | 10 | 0 | ||||||
| 2025-08-12 | 13F | Deutsche Bank Ag\ | 10,248 | 0.00 | 251 | 0.81 | ||||
| 2025-08-01 | 13F | Transcend Wealth Collective, Llc | 0 | -100.00 | 0 | |||||
| 2025-07-18 | 13F | QTR Family Wealth, LLC | 9,000 | 0.00 | 220 | 0.92 | ||||
| 2025-07-29 | 13F | Salomon & Ludwin, LLC | 425 | 0.00 | 10 | 0.00 | ||||
| 2025-08-12 | 13F | LPL Financial LLC | 2,097,358 | -7.68 | 51,280 | -6.88 | ||||
| 2025-07-23 | 13F | Foresight Capital Management Advisors, Inc. | 64,907 | -5.95 | 1,587 | -5.14 | ||||
| 2025-07-30 | 13F | Financial Perspectives, Inc | 505 | 0.00 | 12 | 0.00 | ||||
| 2025-07-24 | 13F | Capital Advisors, Ltd. LLC | 5,060 | 0.74 | 0 |