Mga Batayang Estadistika
| Pemilik Institusional | 126 total, 125 long only, 0 short only, 1 long/short - change of -4.51% MRQ |
| Alokasi Portofolio Rata-rata | 0.1824 % - change of 14.54% MRQ |
| Saham Institusional (Jangka Panjang) | 27,601,565 (ex 13D/G) - change of -1.52MM shares -5.23% MRQ |
| Nilai Institusional (Jangka Panjang) | $ 594,753 USD ($1000) |
Kepemilikan Institusional dan Pemegang Saham
iShares S&P GSCI Commodity-Indexed Trust (US:GSG) memiliki 126 pemilik institusional dan pemegang saham yang telah mengajukan formulir 13D/G atau 13F kepada Komisi Bursa Efek (Securities Exchange Commission/SEC). Lembaga-lembaga ini memegang total 27,601,565 saham. Pemegang saham terbesar meliputi BlackRock, Inc., USA Financial Portformulas Corp, Morgan Stanley, Strategic Investment Management, Llc, Quent Capital, LLC, Bank Of America Corp /de/, Wells Fargo & Company/mn, Quadrature Capital Ltd, Deutsche Bank Ag\, and Goldman Sachs Group Inc .
Struktur kepemilikan institusional iShares S&P GSCI Commodity-Indexed Trust (ARCA:GSG) menunjukkan posisi terkini di perusahaan oleh institusi dan dana, serta perubahan terbaru dalam ukuran posisi. Pemegang saham utama dapat mencakup investor individu, reksa dana, dana lindung nilai, atau institusi. Jadwal 13D menunjukkan bahwa investor memegang (atau pernah memegang) lebih dari 5% saham perusahaan dan bermaksud (atau pernah bermaksud) untuk secara aktif mengejar perubahan strategi bisnis. Jadwal 13G menunjukkan investasi pasif lebih dari 5%.
The share price as of September 5, 2025 is 22.55 / share. Previously, on September 6, 2024, the share price was 20.09 / share. This represents an increase of 12.24% over that period.

Skor Sentimen Dana
Skor Sentimen Dana (sebelumnya dikenal sebagai Skor Akumulasi Kepemilikan) menemukan saham-saham yang paling banyak dibeli oleh dana. Ini adalah hasil dari model kuantitatif multi-faktor yang canggih yang mengidentifikasi perusahaan dengan tingkat akumulasi institusional tertinggi. Model penilaian menggunakan kombinasi dari total peningkatan pemilik yang diungkapkan, perubahan dalam alokasi portofolio pada pemilik tersebut, dan metrik lainnya. Angka berkisar dari 0 hingga 100, dengan angka yang lebih tinggi menunjukkan tingkat akumulasi yang lebih tinggi dibandingkan dengan perusahaan sejenisnya, dan 50 adalah rata-ratanya.
Frekuensi Pembaruan: Setiap Hari
Lihat Ownership Explorer, yang menyediakan daftar perusahaan dengan peringkat tertinggi.
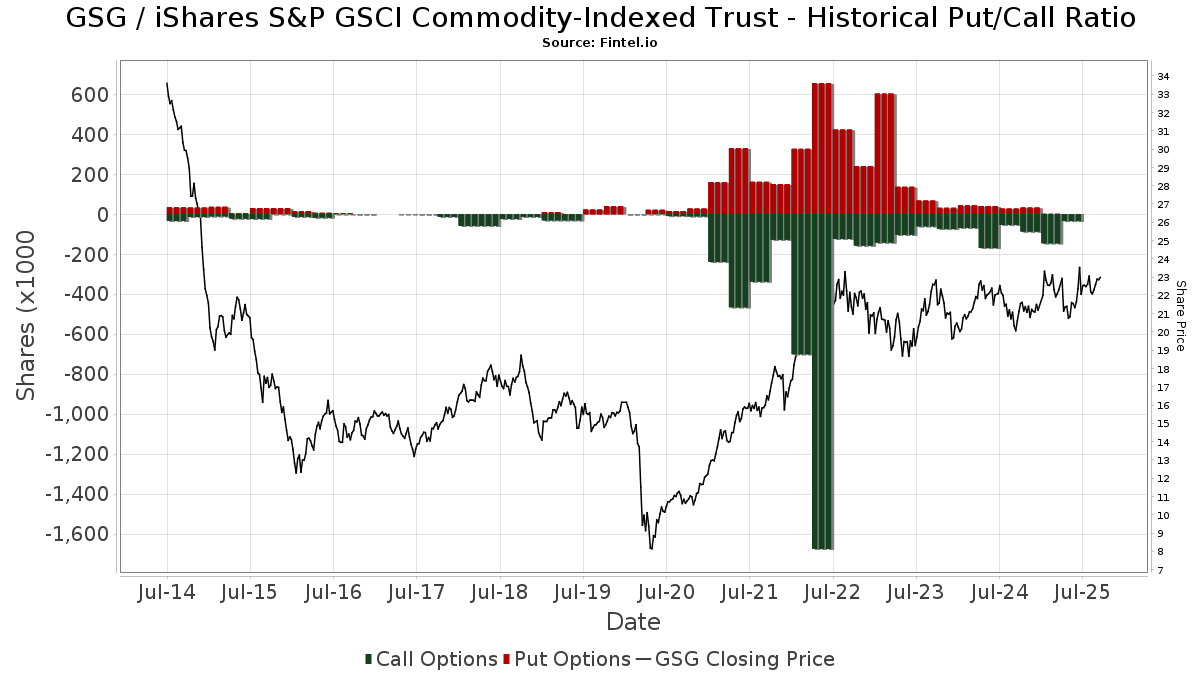
Rasio Put/Call Institusional
Selain melaporkan isu ekuitas dan utang standar, institusi dengan aset di bawah manajemen lebih dari 100 juta dolar AS juga harus mengungkapkan kepemilikan opsi put dan call mereka. Karena opsi put umumnya menunjukkan sentimen negatif, dan opsi call menunjukkan sentimen positif, kita dapat mengetahui sentimen institusional secara keseluruhan dengan memplot rasio put terhadap call. Grafik di sebelah kanan memplot rasio put/call historis untuk instrumen ini.
Menggunakan Rasio Put/Call sebagai indikator sentimen investor mengatasi salah satu kekurangan utama dari penggunaan total kepemilikan institusional, yaitu sejumlah besar aset yang dikelola diinvestasikan secara pasif untuk melacak indeks. Dana yang dikelola secara pasif biasanya tidak membeli opsi, sehingga indikator rasio put/call lebih akurat dalam melacak sentimen dana yang dikelola secara aktif.
Pengajuan 13F dan NPORT
Detail pada pengajuan 13F tersedia gratis. Detail pada pengajuan NP memerlukan keanggotaan premium. Baris berwarna hijau menunjukkan posisi baru. Baris berwarna merah menunjukkan posisi yang sudah ditutup. Klik tautan ini ikon untuk melihat riwayat transaksi selengkapnya.
Tingkatkan
untuk membuka data premium dan mengekspor ke Excel ![]() .
.
| Tanggal File | Sumber | Investor | Ketik | Presyo ng Avg (Silangan) |
Saham | Δ Saham (%) |
Dilaporkan Nilai ($1000) |
Nilai Δ (%) |
Alokasi Port (%) |
|
|---|---|---|---|---|---|---|---|---|---|---|
| 2025-08-14 | 13F | Citadel Advisors Llc | Call | 19,400 | 2.11 | 428 | -1.16 | |||
| 2025-08-14 | 13F | Raymond James Financial Inc | 40,484 | -8.70 | 892 | -11.60 | ||||
| 2025-05-09 | 13F | Atria Wealth Solutions, Inc. | 0 | -100.00 | 0 | |||||
| 2025-05-15 | 13F | Rakuten Investment Management, Inc. | 107,840 | 8.24 | 2,415 | 15.06 | ||||
| 2025-07-15 | 13F | Cordant, Inc. | 3,058 | 0.00 | 67 | -2.90 | ||||
| 2025-08-08 | 13F | Capstone Financial Advisors, Inc. | 9,600 | 0.00 | 212 | -3.21 | ||||
| 2025-07-08 | 13F | Nbc Securities, Inc. | 2,172 | 0.56 | 0 | |||||
| 2025-08-13 | 13F | EverSource Wealth Advisors, LLC | 22 | 0.00 | 0 | |||||
| 2025-08-13 | 13F | Amundi | 0 | -100.00 | 0 | |||||
| 2025-08-12 | 13F | Southeast Asset Advisors Inc. | 18,514 | 31.65 | 408 | 27.50 | ||||
| 2025-08-19 | 13F | Advisory Services Network, LLC | 47,817 | -0.10 | 1,090 | 0.09 | ||||
| 2025-08-08 | 13F | Chandler Asset Management, Inc. | 23,595 | 0.00 | 520 | -3.17 | ||||
| 2025-08-13 | 13F | Avestar Capital, LLC | 25,250 | 0.00 | 557 | -3.14 | ||||
| 2025-07-18 | 13F | USA Financial Portformulas Corp | 1,009,519 | 22,250 | ||||||
| 2025-07-08 | 13F | Arlington Trust Co LLC | 6,250 | 0.00 | 138 | -3.52 | ||||
| 2025-07-31 | 13F | Optimum Investment Advisors | 50 | 0.00 | 1 | 0.00 | ||||
| 2025-08-13 | 13F | Scotia Capital Inc. | 17,076 | -74.37 | 376 | -75.21 | ||||
| 2025-08-04 | 13F | Assetmark, Inc | 0 | -100.00 | 0 | |||||
| 2025-08-12 | 13F | Steward Partners Investment Advisory, Llc | 664 | 0.00 | 15 | -6.67 | ||||
| 2025-08-01 | 13F | First National Trust Co | 15,476 | 3.17 | 341 | 0.00 | ||||
| 2025-08-14 | 13F | Citadel Advisors Llc | 45,188 | 996 | ||||||
| 2025-05-05 | 13F | St. Louis Trust Co | 0 | -100.00 | 0 | |||||
| 2025-07-30 | 13F | Strategic Investment Management, Llc | 873,720 | 0.00 | 19,257 | -3.21 | ||||
| 2025-08-14 | 13F | Bnp Paribas Arbitrage, Sa | 34,330 | 30,551.79 | 757 | 37,700.00 | ||||
| 2025-08-13 | 13F | Continuum Advisory, LLC | 0 | -100.00 | 0 | |||||
| 2025-05-16 | 13F | Coppell Advisory Solutions LLC | 0 | -100.00 | 0 | |||||
| 2025-08-06 | 13F | Aspect Partners, LLC | 23,795 | 524 | ||||||
| 2025-08-04 | 13F | Creative Financial Designs Inc /adv | 700 | 0.00 | 15 | 0.00 | ||||
| 2025-08-13 | 13F | Flow Traders U.s. Llc | 0 | -100.00 | 0 | |||||
| 2025-04-10 | 13F | Sugar Maple Asset Management, LLC | 0 | -100.00 | 0 | |||||
| 2025-08-13 | 13F | Northwestern Mutual Wealth Management Co | 37,271 | -0.60 | 821 | -3.75 | ||||
| 2025-08-05 | 13F | Simplex Trading, Llc | Put | 100 | 0 | |||||
| 2025-05-14 | 13F | Group One Trading, L.p. | Put | 0 | -100.00 | 0 | -100.00 | |||
| 2025-08-05 | 13F | Simplex Trading, Llc | Call | 1,000 | 25.00 | 0 | ||||
| 2025-08-08 | 13F | Avantax Advisory Services, Inc. | 22,695 | 8.37 | 500 | 5.04 | ||||
| 2025-08-12 | 13F | Coldstream Capital Management Inc | 0 | -100.00 | 0 | |||||
| 2025-04-22 | 13F | Heartland Bank & Trust Co | 0 | -100.00 | 0 | |||||
| 2025-08-04 | 13F | Pinnacle Associates Ltd | 55,301 | 0.00 | 1,219 | -3.26 | ||||
| 2025-04-18 | 13F | Global Trust Asset Management, LLC | 0 | -100.00 | 0 | |||||
| 2025-08-13 | 13F/A | StoneX Group Inc. | 28,715 | 0.40 | 610 | 3.57 | ||||
| 2025-04-21 | 13F | Beacon Capital Management, LLC | 0 | -100.00 | 0 | |||||
| 2025-08-13 | 13F | Congress Wealth Management LLC / DE / | 17,930 | 0.00 | 395 | -3.19 | ||||
| 2025-07-17 | 13F | Fifth Third Securities, Inc. | 10,783 | 19.56 | 238 | 15.61 | ||||
| 2025-08-14 | 13F | Citadel Advisors Llc | Put | 0 | -100.00 | 0 | ||||
| 2025-08-15 | 13F | Equitable Holdings, Inc. | 12,932 | 285 | ||||||
| 2025-07-28 | 13F | Private Wealth Asset Management, LLC | 5,000 | 0.00 | 110 | -2.65 | ||||
| 2025-08-12 | 13F | Proequities, Inc. | Put | 0 | 0 | |||||
| 2025-05-12 | 13F | Citigroup Inc | 0 | -100.00 | 0 | |||||
| 2025-08-12 | 13F | Proequities, Inc. | Call | 0 | 0 | |||||
| 2025-05-14 | 13F | Oarsman Capital, Inc. | 0 | -100.00 | 0 | -100.00 | ||||
| 2025-08-11 | 13F | GW&K Investment Management, LLC | 14,000 | 0.00 | 0 | |||||
| 2025-08-05 | 13F | Bank of New York Mellon Corp | 141,256 | -27.47 | 3,113 | -29.79 | ||||
| 2025-05-12 | 13F | Sandy Spring Bank | 17 | 0.00 | 0 | |||||
| 2025-07-08 | 13F | Rise Advisors, LLC | 300 | 0.00 | 7 | 0.00 | ||||
| 2025-07-08 | 13F | Parallel Advisors, LLC | 9,630 | 0.00 | 212 | -3.20 | ||||
| 2025-07-23 | 13F | West Paces Advisors Inc. | 0 | -100.00 | 0 | |||||
| 2025-08-13 | 13F | Transce3nd, LLC | 42 | 366.67 | 1 | |||||
| 2025-08-13 | 13F | Bank Of Nova Scotia | 14,240 | 0.00 | 314 | -3.40 | ||||
| 2025-08-14 | 13F | State Street Corp | 66,900 | -48.38 | 1,474 | -50.03 | ||||
| 2025-08-06 | 13F | Golden State Wealth Management, LLC | 3,409 | -20.33 | 75 | -22.68 | ||||
| 2025-08-12 | 13F | Boreal Capital Management LLC | 670 | 15 | ||||||
| 2025-08-07 | 13F | Pinnacle Wealth Management Advisory Group, LLC | 55,000 | 0.00 | 1,212 | -3.19 | ||||
| 2025-08-14 | 13F | Susquehanna International Group, Llp | Call | 12,600 | 278 | |||||
| 2025-08-14 | 13F | Susquehanna International Group, Llp | 44,549 | -51.92 | 982 | -53.49 | ||||
| 2025-08-05 | 13F | Simplex Trading, Llc | 0 | -100.00 | 0 | |||||
| 2025-08-11 | 13F | TD Waterhouse Canada Inc. | 550 | 0.00 | 12 | 0.00 | ||||
| 2025-07-21 | 13F | Quent Capital, LLC | 676,447 | 22.06 | 14,909 | 18.15 | ||||
| 2025-07-31 | 13F | Cambridge Investment Research Advisors, Inc. | 12,422 | -18.89 | 0 | |||||
| 2025-08-13 | 13F | MONECO Advisors, LLC | 95,648 | 0.22 | 2,108 | -2.99 | ||||
| 2025-05-01 | 13F | Cwm, Llc | 0 | -100.00 | 0 | |||||
| 2025-05-15 | 13F | Human Investing LLC | 0 | -100.00 | 0 | |||||
| 2025-08-06 | 13F | Prospera Financial Services Inc | 64,531 | -0.74 | 1,422 | -3.92 | ||||
| 2025-08-14 | 13F | Royal Bank Of Canada | 51,892 | -5.56 | 1,144 | -8.48 | ||||
| 2025-08-01 | 13F | Envestnet Asset Management Inc | 75,091 | -23.69 | 1,655 | -26.12 | ||||
| 2025-07-16 | 13F | Castleview Partners, Llc | 0 | -100.00 | 0 | |||||
| 2025-08-13 | 13F | Quadrature Capital Ltd | 360,943 | 422.05 | 7,961 | 405.72 | ||||
| 2025-08-12 | 13F | Inscription Capital, LLC | 199,182 | -17.78 | 4,390 | -17.87 | ||||
| 2025-08-14 | 13F | Mariner, LLC | 33,064 | -29.12 | 729 | -31.45 | ||||
| 2025-07-16 | 13F | Highline Wealth Partners Llc | 1,700 | 0.00 | 37 | -2.63 | ||||
| 2025-08-11 | 13F | Strategic Wealth Partners, Ltd. | 800 | 18 | ||||||
| 2025-07-29 | 13F | Empirical Asset Management, LLC | 114,908 | 4.10 | 2,533 | 0.76 | ||||
| 2025-08-14 | 13F | GWM Advisors LLC | 619 | 0.00 | 14 | -7.14 | ||||
| 2025-08-12 | 13F | OneAscent Financial Services LLC | 44,778 | -26.93 | 1 | -100.00 | ||||
| 2025-08-06 | 13F | Moors & Cabot, Inc. | 36,972 | -3.23 | 815 | -6.33 | ||||
| 2025-08-11 | 13F | Sierra Capital LLC | 18,098 | -16.40 | 0 | |||||
| 2025-08-13 | 13F | Generation Capital Management LLC | 0 | -100.00 | 0 | |||||
| 2025-08-05 | 13F | Sumitomo Life Insurance Co | 0 | -100.00 | 0 | |||||
| 2025-08-15 | 13F | Morgan Stanley | 917,140 | -0.70 | 20,214 | -3.88 | ||||
| 2025-07-21 | 13F | Barrett & Company, Inc. | 150 | 0.00 | 3 | 0.00 | ||||
| 2025-05-14 | 13F | Mml Investors Services, Llc | 0 | -100.00 | 0 | |||||
| 2025-07-09 | 13F | Intelligence Driven Advisers, LLC | 0 | -100.00 | 0 | |||||
| 2025-07-22 | 13F | DT Investment Partners, LLC | 172,885 | 4.98 | 3,810 | 1.63 | ||||
| 2025-05-05 | 13F | CBIZ Investment Advisory Services, LLC | 0 | -100.00 | 0 | |||||
| 2025-08-14 | 13F | Goldman Sachs Group Inc | 208,970 | -22.77 | 4,606 | -25.26 | ||||
| 2025-07-21 | 13F | Washington Growth Strategies Llc | 135,919 | 590,852.17 | 3 | -33.33 | ||||
| 2025-08-14 | 13F | Gould Capital, LLC | 1,771 | -1.94 | 39 | -4.88 | ||||
| 2025-08-14 | 13F | Bank Of America Corp /de/ | 456,125 | -14.41 | 10,053 | -17.16 | ||||
| 2025-08-08 | 13F | Red Cedar Investment Management, Llc | 184,379 | 0.00 | 4,064 | -3.22 | ||||
| 2025-07-24 | 13F | Us Bancorp \de\ | 42,817 | -38.81 | 944 | -40.80 | ||||
| 2025-08-07 | 13F | Davis R M Inc | 9,150 | 0.00 | 202 | -3.37 | ||||
| 2025-08-13 | 13F | Mackenzie Financial Corp | 12,221 | -1.24 | 269 | -4.27 | ||||
| 2025-07-09 | 13F | Krilogy Financial LLC | 10,210 | -25.58 | 225 | -27.88 | ||||
| 2025-05-09 | 13F | Strategic Investment Solutions, Inc. /IL | 0 | -100.00 | 0 | |||||
| 2025-07-18 | 13F | PFG Investments, LLC | 53,112 | 0.93 | 1,171 | -2.34 | ||||
| 2025-07-31 | 13F | Oppenheimer & Co Inc | 25,400 | 0.00 | 560 | -3.29 | ||||
| 2025-08-05 | 13F | Aurdan Capital Management, LLC | 10,550 | 0.00 | 233 | -3.33 | ||||
| 2025-07-14 | 13F | Westend Capital Management LLC | 30 | 0.00 | 1 | |||||
| 2025-07-14 | 13F | Wealth Advisory Solutions, LLC | 29,970 | 1.23 | 661 | -2.08 | ||||
| 2025-08-04 | 13F | Creekmur Asset Management LLC | 180 | 80.00 | 4 | 50.00 | ||||
| 2025-08-14 | 13F | Wells Fargo & Company/mn | 362,009 | -34.43 | 7,979 | -36.54 | ||||
| 2025-08-08 | 13F | Financial Gravity Companies, Inc. | 82 | 0.00 | 2 | 0.00 | ||||
| 2025-08-12 | 13F | Proequities, Inc. | 0 | 0 | ||||||
| 2025-07-10 | 13F | Sovran Advisors, LLC | 136,380 | -3.27 | 3,075 | 1.05 | ||||
| 2025-07-24 | 13F | Strengthening Families & Communities, LLC | 1,174 | 26 | ||||||
| 2025-04-22 | 13F | Synergy Financial Management, LLC | 0 | -100.00 | 0 | |||||
| 2025-08-08 | 13F | Cetera Investment Advisers | 10,483 | -11.29 | 231 | -14.13 | ||||
| 2025-07-16 | 13F | Perigon Wealth Management, LLC | 16,586 | 0.00 | 366 | -3.18 | ||||
| 2025-08-14 | 13F | Sunbelt Securities, Inc. | 2,331 | 0.00 | 51 | -5.66 | ||||
| 2025-08-14 | 13F | Headlands Technologies LLC | 1,571 | 35 | ||||||
| 2025-09-04 | 13F/A | Advisor Group Holdings, Inc. | 56,763 | 56.57 | 1,252 | 51.64 | ||||
| 2025-08-11 | 13F | HighTower Advisors, LLC | 38,901 | -21.64 | 857 | -24.16 | ||||
| 2025-08-12 | 13F | LPL Financial LLC | 85,965 | -2.65 | 1,895 | -5.77 | ||||
| 2025-08-12 | 13F | BlackRock, Inc. | 18,508,255 | 6.56 | 407,922 | 3.15 | ||||
| 2025-08-05 | 13F | Huntington National Bank | 38 | -15.91 | ||||||
| 2025-08-14 | 13F | Stifel Financial Corp | 60,801 | 99.91 | 1,340 | 93.64 | ||||
| 2025-08-04 | 13F | Atria Investments Llc | 0 | -100.00 | 0 | |||||
| 2025-08-13 | 13F | Natixis Advisors, L.p. | 198,992 | -6.75 | 4 | 0.00 | ||||
| 2025-08-13 | 13F | F/M Investments LLC | 26,166 | 0.00 | 577 | -3.19 | ||||
| 2025-07-16 | 13F | Signaturefd, Llc | 0 | -100.00 | 0 | |||||
| 2025-07-18 | 13F | SOA Wealth Advisors, LLC. | 40 | 0.00 | 1 | |||||
| 2025-07-15 | 13F | Evanson Asset Management, LLC | 47,347 | 0.00 | 1,044 | -3.25 | ||||
| 2025-08-12 | 13F | Jpmorgan Chase & Co | 28,381 | -95.45 | 626 | -95.60 | ||||
| 2025-07-16 | 13F | BOS Asset Management, LLC | 11,330 | 0.00 | 250 | -3.11 | ||||
| 2025-08-12 | 13F | Deutsche Bank Ag\ | 311,479 | -60.97 | 6,865 | -62.23 | ||||
| 2025-08-14 | 13F | Stonehaven Wealth & Tax Solutions, Llc | 19,402 | -0.97 | 428 | -4.26 | ||||
| 2025-07-25 | 13F | Envestnet Portfolio Solutions, Inc. | 16,303 | 34.45 | 359 | 30.07 | ||||
| 2025-05-01 | 13F | Schechter Investment Advisors, LLC | 144,259 | -0.35 | 3,285 | 4.22 | ||||
| 2025-08-07 | 13F | Allworth Financial LP | 1,753 | 0.00 | 39 | 2.70 | ||||
| 2025-08-14 | 13F | UBS Group AG | 57,238 | -14.57 | 1,262 | -17.31 | ||||
| 2025-08-05 | 13F | Bank Of Montreal /can/ | 0 | -100.00 | 0 | |||||
| 2025-07-31 | 13F | Mycio Wealth Partners, Llc | 0 | -100.00 | 0 | |||||
| 2025-08-12 | 13F | CIBC Private Wealth Group, LLC | 1,500 | 0.00 | 33 | 10.00 | ||||
| 2025-08-14 | 13F | Fmr Llc | 0 | -100.00 | 0 | |||||
| 2025-08-14 | 13F | CoreCap Advisors, LLC | 394 | 0.00 | 9 | 0.00 | ||||
| 2025-07-09 | 13F | Breakwater Investment Management | 8,493 | -57.29 | 187 | -58.63 | ||||
| 2025-08-14 | 13F | SIH Partners, LLLP | Call | 0 | -100.00 | 0 | ||||
| 2025-05-15 | 13F | Wolverine Trading, Llc | Put | 0 | -100.00 | 0 | ||||
| 2025-08-25 | 13F/A | Neuberger Berman Group LLC | 41,262 | -14.86 | 909 | -17.59 | ||||
| 2025-08-14 | 13F | Jane Street Group, Llc | 35,491 | -86.31 | 782 | -86.75 | ||||
| 2025-08-05 | 13F | Key FInancial Inc | 158 | 0.00 | 3 | 0.00 | ||||
| 2025-08-12 | 13F | AlphaCore Capital LLC | 11,348 | 0.00 | 250 | -3.10 | ||||
| 2025-07-17 | 13F | Sound Income Strategies, LLC | 1,852 | 41 | ||||||
| 2025-08-19 | 13F | Asset Dedication, LLC | 1,125 | 0.00 | 25 | -4.00 | ||||
| 2025-05-15 | 13F | Wolverine Trading, Llc | Call | 0 | -100.00 | 0 | ||||
| 2025-08-14 | 13F | Comerica Bank | 6,383 | 0.00 | 141 | -3.45 | ||||
| 2025-08-01 | 13F | Red Lighthouse Investment Management, Llc | 650 | 0.00 | 14 | 0.00 | ||||
| 2025-08-11 | 13F | Brown Brothers Harriman & Co | 0 | -100.00 | 0 | |||||
| 2025-08-13 | 13F | M Holdings Securities, Inc. | 132,290 | 47.40 | 3 | 0.00 | ||||
| 2025-07-25 | 13F | Stephens Consulting, LLC | 580 | 0.00 | 13 | -7.69 | ||||
| 2025-08-07 | 13F | Kestra Private Wealth Services, Llc | 12,090 | 266 | ||||||
| 2025-07-16 | 13F | Patton Fund Management, Inc. | 69,454 | -1.81 | 1,531 | -4.97 | ||||
| 2025-08-15 | 13F | CI Private Wealth, LLC | 14,634 | 7.44 | 323 | 3.87 | ||||
| 2025-08-14 | 13F | Ameriprise Financial Inc | 98,599 | -42.78 | 2,173 | -44.62 | ||||
| 2025-08-18 | 13F/A | National Bank Of Canada /fi/ | 47,948 | -35.22 | 1,057 | -37.25 | ||||
| 2025-07-28 | 13F | Harbour Investments, Inc. | 369 | 0.00 | 8 | 0.00 | ||||
| 2025-08-06 | 13F | Commonwealth Equity Services, Llc | 65,954 | 70.26 | 1 | |||||
| 2025-04-30 | 13F | Sofos Investments, Inc. | 82 | 2 | ||||||
| 2025-08-15 | 13F | Tower Research Capital LLC (TRC) | 364 | 8 | ||||||
| 2025-08-08 | 13F | Pnc Financial Services Group, Inc. | 2,170 | 0.00 | 48 | -4.08 | ||||
| 2025-05-15 | 13F | First Commonwealth Financial Corp /pa/ | 0 | -100.00 | 0 | |||||
| 2025-08-14 | 13F | Group One Trading, L.p. | Call | 1,100 | 0.00 | 24 | -4.00 |