Mga Batayang Estadistika
| Pemilik Institusional | 250 total, 248 long only, 0 short only, 2 long/short - change of -4.21% MRQ |
| Alokasi Portofolio Rata-rata | 0.1938 % - change of 26.64% MRQ |
| Saham Institusional (Jangka Panjang) | 13,264,731 (ex 13D/G) - change of -0.21MM shares -1.53% MRQ |
| Nilai Institusional (Jangka Panjang) | $ 1,105,032 USD ($1000) |
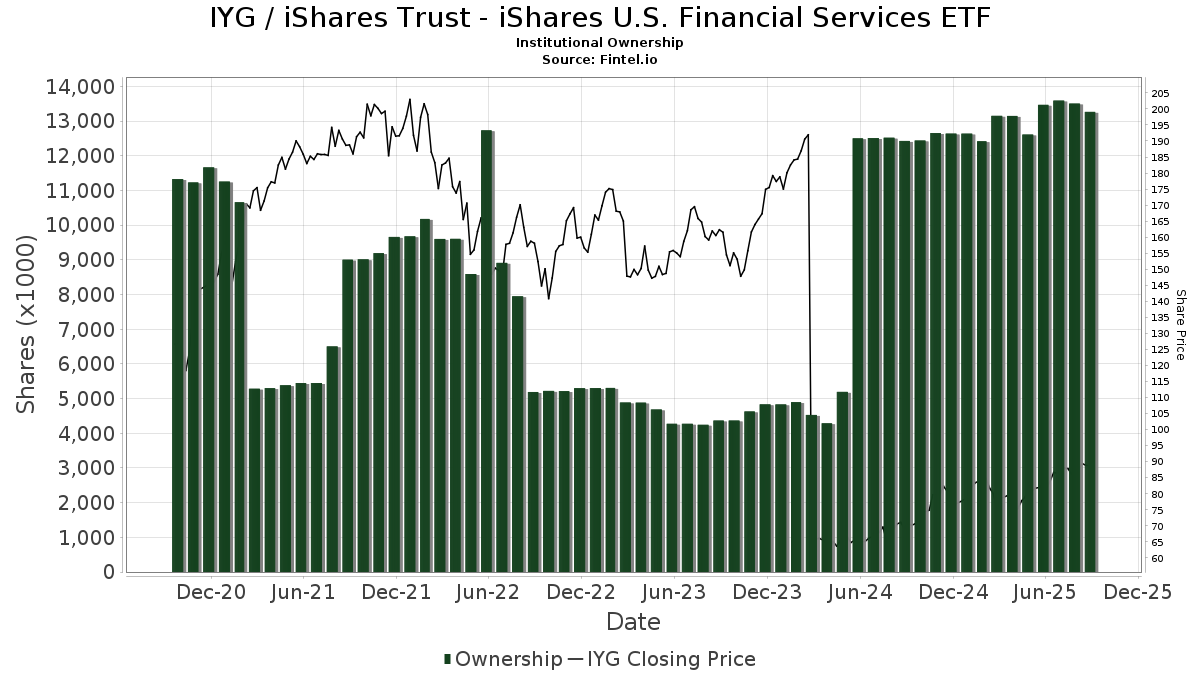
Kepemilikan Institusional dan Pemegang Saham
iShares Trust - iShares U.S. Financial Services ETF (US:IYG) memiliki 250 pemilik institusional dan pemegang saham yang telah mengajukan formulir 13D/G atau 13F kepada Komisi Bursa Efek (Securities Exchange Commission/SEC). Lembaga-lembaga ini memegang total 13,264,731 saham. Pemegang saham terbesar meliputi RiverFront Investment Group, LLC, Envestnet Asset Management Inc, Goldman Sachs Group Inc, Morgan Stanley, Foundations Investment Advisors, LLC, Bank Of America Corp /de/, Raymond James Financial Inc, Royal Bank Of Canada, LPL Financial LLC, and Baltimore-Washington Financial Advisors, Inc. .
Struktur kepemilikan institusional iShares Trust - iShares U.S. Financial Services ETF (ARCA:IYG) menunjukkan posisi terkini di perusahaan oleh institusi dan dana, serta perubahan terbaru dalam ukuran posisi. Pemegang saham utama dapat mencakup investor individu, reksa dana, dana lindung nilai, atau institusi. Jadwal 13D menunjukkan bahwa investor memegang (atau pernah memegang) lebih dari 5% saham perusahaan dan bermaksud (atau pernah bermaksud) untuk secara aktif mengejar perubahan strategi bisnis. Jadwal 13G menunjukkan investasi pasif lebih dari 5%.
The share price as of September 5, 2025 is 88.13 / share. Previously, on September 6, 2024, the share price was 69.00 / share. This represents an increase of 27.72% over that period.
Skor Sentimen Dana
Skor Sentimen Dana (sebelumnya dikenal sebagai Skor Akumulasi Kepemilikan) menemukan saham-saham yang paling banyak dibeli oleh dana. Ini adalah hasil dari model kuantitatif multi-faktor yang canggih yang mengidentifikasi perusahaan dengan tingkat akumulasi institusional tertinggi. Model penilaian menggunakan kombinasi dari total peningkatan pemilik yang diungkapkan, perubahan dalam alokasi portofolio pada pemilik tersebut, dan metrik lainnya. Angka berkisar dari 0 hingga 100, dengan angka yang lebih tinggi menunjukkan tingkat akumulasi yang lebih tinggi dibandingkan dengan perusahaan sejenisnya, dan 50 adalah rata-ratanya.
Frekuensi Pembaruan: Setiap Hari
Lihat Ownership Explorer, yang menyediakan daftar perusahaan dengan peringkat tertinggi.
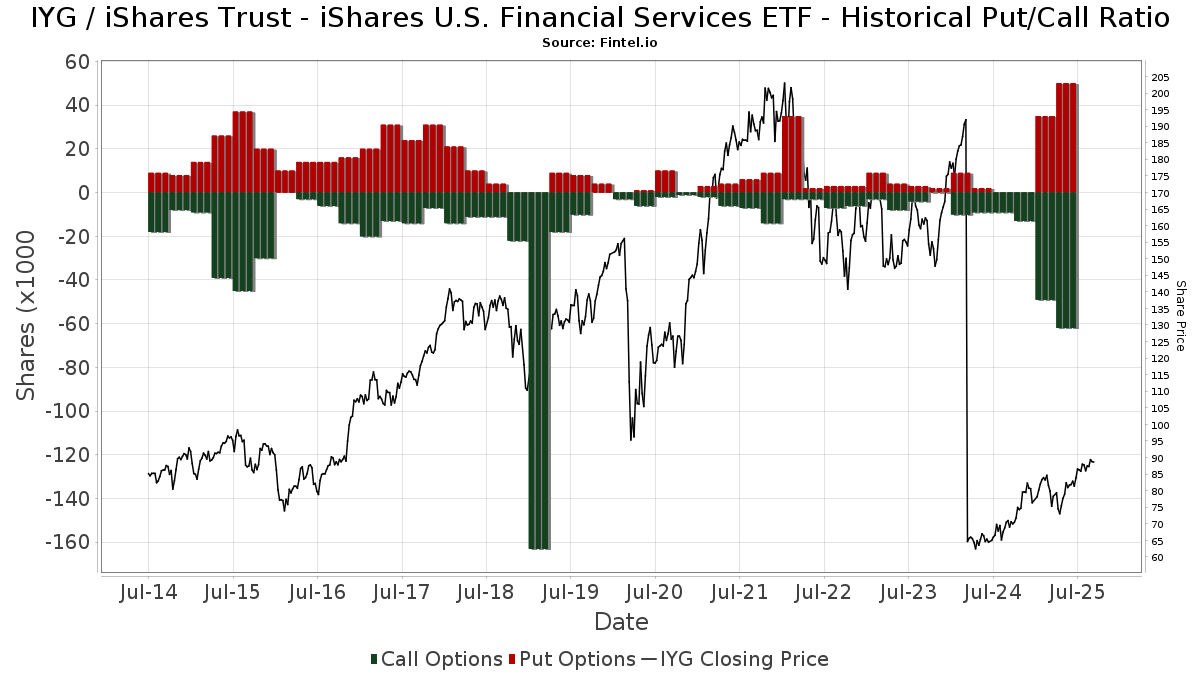
Rasio Put/Call Institusional
Selain melaporkan isu ekuitas dan utang standar, institusi dengan aset di bawah manajemen lebih dari 100 juta dolar AS juga harus mengungkapkan kepemilikan opsi put dan call mereka. Karena opsi put umumnya menunjukkan sentimen negatif, dan opsi call menunjukkan sentimen positif, kita dapat mengetahui sentimen institusional secara keseluruhan dengan memplot rasio put terhadap call. Grafik di sebelah kanan memplot rasio put/call historis untuk instrumen ini.
Menggunakan Rasio Put/Call sebagai indikator sentimen investor mengatasi salah satu kekurangan utama dari penggunaan total kepemilikan institusional, yaitu sejumlah besar aset yang dikelola diinvestasikan secara pasif untuk melacak indeks. Dana yang dikelola secara pasif biasanya tidak membeli opsi, sehingga indikator rasio put/call lebih akurat dalam melacak sentimen dana yang dikelola secara aktif.
Pengajuan 13F dan NPORT
Detail pada pengajuan 13F tersedia gratis. Detail pada pengajuan NP memerlukan keanggotaan premium. Baris berwarna hijau menunjukkan posisi baru. Baris berwarna merah menunjukkan posisi yang sudah ditutup. Klik tautan ini ikon untuk melihat riwayat transaksi selengkapnya.
Tingkatkan
untuk membuka data premium dan mengekspor ke Excel ![]() .
.
| Tanggal File | Sumber | Investor | Ketik | Presyo ng Avg (Silangan) |
Saham | Δ Saham (%) |
Dilaporkan Nilai ($1000) |
Nilai Δ (%) |
Alokasi Port (%) |
|
|---|---|---|---|---|---|---|---|---|---|---|
| 2025-08-14 | 13F | GWM Advisors LLC | 13,697 | 33.86 | 1,173 | 45.95 | ||||
| 2025-08-14 | 13F | Citadel Advisors Llc | Put | 19,200 | 35.21 | 1,644 | 47.35 | |||
| 2025-07-22 | 13F | DAVENPORT & Co LLC | 2,626 | -13.05 | 225 | -5.49 | ||||
| 2025-07-28 | 13F | Patten & Patten Inc/tn | 22,176 | -1.51 | 1,898 | 7.35 | ||||
| 2025-08-14 | 13F | Citadel Advisors Llc | Call | 11,300 | 175.61 | 967 | 200.31 | |||
| 2025-08-14 | 13F | Gen-Wealth Partners Inc | 81 | 0.00 | 7 | 0.00 | ||||
| 2025-08-04 | 13F | HBK Sorce Advisory LLC | 3,834 | -2.79 | 328 | 6.15 | ||||
| 2025-08-14 | 13F | Citadel Advisors Llc | 7,398 | 139.34 | 633 | 161.57 | ||||
| 2025-08-05 | 13F | Key FInancial Inc | 18 | 0.00 | 2 | 0.00 | ||||
| 2025-07-09 | 13F | Fiduciary Alliance LLC | 2,725 | 233 | ||||||
| 2025-08-13 | 13F | Financial Freedom, LLC | 1,139 | -4.04 | 98 | 4.30 | ||||
| 2025-08-19 | 13F | National Asset Management, Inc. | 0 | -100.00 | 0 | |||||
| 2025-08-05 | 13F | Bank Of Montreal /can/ | 158,887 | 0.86 | 13,601 | 9.91 | ||||
| 2025-08-04 | 13F | Assetmark, Inc | 23 | 2 | ||||||
| 2025-07-16 | 13F | New Insight Wealth Advisors | 6,985 | -0.54 | 598 | 8.35 | ||||
| 2025-07-30 | 13F | D.a. Davidson & Co. | 4,119 | 0.00 | 353 | 8.98 | ||||
| 2025-08-13 | 13F | Quadrant Capital Group Llc | 0 | -100.00 | 0 | |||||
| 2025-08-14 | 13F | IHT Wealth Management, LLC | 44,347 | 2.17 | 3,796 | 11.35 | ||||
| 2025-07-22 | 13F | Bank Hapoalim Bm | 7,435 | -6.10 | 1 | |||||
| 2025-08-05 | 13F | Sigma Planning Corp | 2,684 | -15.14 | 230 | -7.66 | ||||
| 2025-08-14 | 13F | AllSquare Wealth Management LLC | 2,406 | 0.00 | 206 | 9.04 | ||||
| 2025-08-14 | 13F | Stifel Financial Corp | 104,178 | 3.56 | 8,918 | 12.86 | ||||
| 2025-07-25 | 13F | Sequoia Financial Advisors, LLC | 8,898 | 182.21 | 762 | 208.10 | ||||
| 2025-08-01 | 13F | Envestnet Asset Management Inc | 1,296,325 | -9.18 | 110,965 | -1.02 | ||||
| 2025-08-11 | 13F | Cordatus Wealth Management LLC | 8,256 | 0.00 | 1 | |||||
| 2025-08-13 | 13F | Northern Trust Corp | 5,250 | -18.11 | 449 | -10.74 | ||||
| 2025-07-29 | 13F | BKD Wealth Advisors, LLC | 5,994 | 0.00 | 513 | 9.15 | ||||
| 2025-07-01 | 13F | Harbor Investment Advisory, Llc | 383 | 41.85 | 33 | 52.38 | ||||
| 2025-08-12 | 13F | Athena Investment Management | 3,345 | 0.00 | 286 | 9.16 | ||||
| 2025-08-15 | 13F | Kestra Advisory Services, LLC | 21,043 | 53.73 | 1,801 | 67.53 | ||||
| 2025-07-15 | 13F | Td Private Client Wealth Llc | 824 | -59.96 | 71 | -56.52 | ||||
| 2025-08-11 | 13F | TRUE Private Wealth Advisors | 6,207 | 0.00 | 531 | 9.03 | ||||
| 2025-08-08 | 13F | Gts Securities Llc | 0 | -100.00 | 0 | |||||
| 2025-07-14 | 13F | AdvisorNet Financial, Inc | 34,350 | -1.58 | 2,940 | 7.26 | ||||
| 2025-08-06 | 13F | Garrison Point Advisors, Llc | 12,705 | -4.51 | 1,088 | 4.02 | ||||
| 2025-08-11 | 13F | Y.D. More Investments Ltd | 1,000 | 53.85 | 85 | 70.00 | ||||
| 2025-05-02 | 13F | Fortis Group Advisors, LLC | 0 | -100.00 | 0 | -100.00 | ||||
| 2025-05-12 | 13F | Independent Advisor Alliance | 0 | -100.00 | 0 | |||||
| 2025-08-14 | 13F | Wealth Preservation Advisors, LLC | 165 | 0.00 | 14 | 16.67 | ||||
| 2025-08-13 | 13F | Crescent Grove Advisors, LLC | 2,379 | 204 | ||||||
| 2025-07-15 | 13F | Signet Financial Management, Llc | 3,812 | 3.93 | 326 | 13.19 | ||||
| 2025-04-02 | 13F | Marcum Wealth, LLC | 6,156 | -2.58 | 484 | -1.63 | ||||
| 2025-07-31 | 13F | Cambridge Investment Research Advisors, Inc. | 15,001 | -14.96 | 1 | 0.00 | ||||
| 2025-07-31 | 13F | Oppenheimer & Co Inc | 8,877 | 15.59 | 760 | 25.87 | ||||
| 2025-08-11 | 13F | Private Advisor Group, LLC | 163,185 | 5.09 | 13,969 | 14.52 | ||||
| 2025-07-16 | 13F | Signaturefd, Llc | 989 | -2.85 | 85 | 6.33 | ||||
| 2025-08-13 | 13F | Beacon Pointe Advisors, LLC | 65,026 | -7.26 | 5,566 | 1.07 | ||||
| 2025-08-29 | 13F | Evolution Wealth Management Inc. | 417 | 36 | ||||||
| 2025-08-14 | 13F | Ameriprise Financial Inc | 104,856 | 5.50 | 8,974 | 14.98 | ||||
| 2025-08-14 | 13F | Mml Investors Services, Llc | 25,008 | 23.45 | 2 | 100.00 | ||||
| 2025-07-28 | 13F | Frazier Financial Advisors, LLC | 339 | 0.00 | 29 | 11.54 | ||||
| 2025-07-10 | 13F | Wealth Enhancement Advisory Services, Llc | 10,923 | 62.54 | 955 | 81.02 | ||||
| 2025-08-12 | 13F | O'shaughnessy Asset Management, Llc | 1,418 | 53.63 | 121 | 68.06 | ||||
| 2025-05-06 | 13F | Venturi Wealth Management, LLC | 0 | -100.00 | 0 | |||||
| 2025-07-15 | 13F | Mather Group, Llc. | 0 | -100.00 | 0 | |||||
| 2025-08-18 | 13F | Geneos Wealth Management Inc. | 20,457 | 13.64 | 1,751 | 23.92 | ||||
| 2025-07-24 | 13F | Us Bancorp \de\ | 11,225 | 1.41 | 961 | 10.47 | ||||
| 2025-08-12 | 13F | Founders Financial Alliance, LLC | 599 | -73.65 | 51 | -71.35 | ||||
| 2025-08-14 | 13F | Sunbelt Securities, Inc. | 8,103 | 692.86 | 630 | 687.50 | ||||
| 2025-08-12 | 13F | Park Square Financial Group, LLC | 300 | 0.00 | 26 | 8.70 | ||||
| 2025-07-23 | 13F | Prime Capital Investment Advisors, LLC | 3,507 | -7.93 | 300 | 0.33 | ||||
| 2025-07-08 | 13F | Parallel Advisors, LLC | 623 | 0.16 | 53 | 10.42 | ||||
| 2025-04-22 | 13F | Tower View Investment Management & Research LLC | 0 | -100.00 | 0 | |||||
| 2025-07-17 | 13F/A | Capital Investment Advisors, LLC | 2,835 | 0.04 | 243 | 9.01 | ||||
| 2025-07-18 | 13F | Union Bancaire Privee, UBP SA | 3,000 | 0.00 | 254 | 9.01 | ||||
| 2025-08-11 | 13F | Annis Gardner Whiting Capital Advisors, LLC | 306 | 26 | ||||||
| 2025-08-01 | 13F | GoalVest Advisory LLC | 0 | -100.00 | 0 | |||||
| 2025-08-15 | 13F | Tower Research Capital LLC (TRC) | 0 | -100.00 | 0 | |||||
| 2025-07-24 | 13F | Capital Advisors, Ltd. LLC | 251 | 0.00 | 0 | |||||
| 2025-08-15 | 13F | Morgan Stanley | 1,061,357 | 11.34 | 90,852 | 21.34 | ||||
| 2025-07-31 | 13F/A | Interchange Capital Partners, LLC | 3,293 | -3.77 | 282 | 4.85 | ||||
| 2025-08-12 | 13F | Proequities, Inc. | 0 | 0 | ||||||
| 2025-08-12 | 13F | RiverFront Investment Group, LLC | 1,418,402 | -12.81 | 121,415 | -4.98 | ||||
| 2025-07-25 | 13F | Cwm, Llc | 14,111 | -3.72 | 1 | 0.00 | ||||
| 2025-08-18 | 13F | Wolverine Trading, Llc | 0 | -100.00 | 0 | |||||
| 2025-07-24 | 13F | Costello Asset Management, INC | 0 | -100.00 | 0 | |||||
| 2025-08-14 | 13F | EP Wealth Advisors, Inc. | 2,514 | 215 | ||||||
| 2025-05-09 | 13F | CoreCap Advisors, LLC | 0 | -100.00 | 0 | |||||
| 2025-07-07 | 13F | OMNI 360 Wealth, Inc. | 13,362 | 4.45 | 1,144 | 13.84 | ||||
| 2025-07-17 | 13F | Janney Montgomery Scott LLC | 213,026 | -9.33 | 18 | 0.00 | ||||
| 2025-08-14 | 13F | Bnp Paribas Arbitrage, Sa | 0 | -100.00 | 0 | |||||
| 2025-08-12 | 13F | Coldstream Capital Management Inc | 0 | -100.00 | 0 | |||||
| 2025-05-15 | 13F | Vivaldi Capital Management, LLC | 0 | -100.00 | 0 | |||||
| 2025-08-11 | 13F | Tidemark, LLC | 717 | 0.00 | 61 | 8.93 | ||||
| 2025-07-22 | 13F | Merit Financial Group, LLC | 32,405 | 17.10 | 2,774 | 27.61 | ||||
| 2025-08-04 | 13F | Spire Wealth Management | 98 | -11.71 | 8 | 0.00 | ||||
| 2025-07-16 | 13F | Moisand Fitzgerald Tamayo, LLC | 147 | 0.00 | 13 | 9.09 | ||||
| 2025-08-14 | 13F | Mercer Global Advisors Inc /adv | 8,416 | -0.58 | 720 | 8.43 | ||||
| 2025-08-15 | 13F/A | Florida Financial Advisors, Llc | 4,604 | 394 | ||||||
| 2025-07-23 | 13F | Valmark Advisers, Inc. | 3,471 | 5.95 | 297 | 15.56 | ||||
| 2025-08-15 | 13F | Captrust Financial Advisors | 164,474 | -1.35 | 14,079 | 7.50 | ||||
| 2025-08-14 | 13F | Quantinno Capital Management LP | 6,833 | -16.40 | 585 | -8.89 | ||||
| 2025-07-08 | 13F/A | Salem Investment Counselors Inc | 450 | 0.00 | 39 | 8.57 | ||||
| 2025-08-14 | 13F | Mariner, LLC | 26,384 | 0.97 | 2,258 | 10.04 | ||||
| 2025-08-19 | 13F | Advisory Services Network, LLC | 28,084 | 43.76 | 2,444 | 59.32 | ||||
| 2025-08-06 | 13F | Commonwealth Equity Services, Llc | 37,544 | 2.91 | 3 | 50.00 | ||||
| 2025-07-16 | 13F | Southern Capital Advisors, Llc | 63,160 | 4.21 | 5,406 | 13.57 | ||||
| 2025-04-21 | 13F | ORG Partners LLC | 0 | -100.00 | 0 | |||||
| 2025-08-13 | 13F | Townsquare Capital Llc | 0 | -100.00 | 0 | |||||
| 2025-08-13 | 13F | EverSource Wealth Advisors, LLC | 0 | -100.00 | 0 | |||||
| 2025-08-14 | 13F | Holt Capital Advisors, L.L.C. dba Holt Capital Partners, L.P. | 130,064 | 2.95 | 11,133 | 12.18 | ||||
| 2025-07-14 | 13F | UMA Financial Services, Inc. | 529 | 0.19 | 45 | 9.76 | ||||
| 2025-08-11 | 13F | Promethium Advisors,llc | 2,390 | -9.47 | 205 | -1.45 | ||||
| 2025-08-13 | 13F | Fisher Asset Management, LLC | 0 | -100.00 | 0 | |||||
| 2025-08-07 | 13F | Allworth Financial LP | 237 | 0.00 | 20 | 11.11 | ||||
| 2025-08-06 | 13F | Moors & Cabot, Inc. | 2,406 | -21.81 | 206 | -14.94 | ||||
| 2025-08-11 | 13F | Aptus Capital Advisors, LLC | 2,268 | 8.52 | 194 | 18.29 | ||||
| 2025-08-12 | 13F | Global Retirement Partners, LLC | 24 | 0.00 | 2 | 100.00 | ||||
| 2025-08-14 | 13F | Warren Averett Asset Management, LLC | 3,085 | 264 | ||||||
| 2025-07-23 | 13F | Kingswood Wealth Advisors, Llc | 2,845 | -42.09 | 244 | -36.88 | ||||
| 2025-07-30 | 13F | Caliber Wealth Management, LLC / KS | 16,501 | -0.25 | 1,412 | 8.70 | ||||
| 2025-07-31 | 13F | Washington Trust Advisors, Inc. | 105 | -20.45 | 9 | -20.00 | ||||
| 2025-08-06 | 13F | Golden State Wealth Management, LLC | 99 | 0.00 | 8 | 14.29 | ||||
| 2025-08-29 | 13F | Centaurus Financial, Inc. | 3,941 | 1.52 | 0 | |||||
| 2025-07-24 | 13F | Blair William & Co/il | 2,282 | 0.00 | 195 | 8.94 | ||||
| 2025-07-28 | 13F | Harbour Investments, Inc. | 1,136 | 0.00 | 97 | 8.99 | ||||
| 2025-05-15 | 13F | Glenmede Trust Co Na | 0 | -100.00 | 0 | |||||
| 2025-07-25 | 13F | Yarger Wealth Strategies, Llc | 2,849 | 0.21 | 244 | 8.97 | ||||
| 2025-08-05 | 13F | C2P Capital Advisory Group, LLC d.b.a. Prosperity Capital Advisors | 6,902 | -12.15 | 591 | -4.22 | ||||
| 2025-07-14 | 13F | Park Avenue Securities Llc | 5,035 | 4.87 | 0 | |||||
| 2025-08-12 | 13F | Fairscale Capital, LLC | 342 | 0.00 | 30 | 11.54 | ||||
| 2025-07-29 | 13F | Stephens Inc /ar/ | 18,923 | -0.06 | 1,620 | 8.88 | ||||
| 2025-07-18 | 13F | Wetzel Investment Advisors, Inc. | 4,124 | -0.89 | 353 | 8.28 | ||||
| 2025-08-12 | 13F | MAI Capital Management | 1,903 | 0.16 | 163 | 8.72 | ||||
| 2025-08-11 | 13F | Strategic Wealth Partners, Ltd. | 300 | 26 | ||||||
| 2025-07-25 | 13F | Apollon Wealth Management, LLC | 2,731 | 5.81 | 234 | 15.35 | ||||
| 2025-07-11 | 13F | Orrstown Financial Services Inc | 3,683 | 315 | ||||||
| 2025-07-22 | 13F | Wealthcare Advisory Partners LLC | 0 | -100.00 | 0 | |||||
| 2025-08-14 | 13F | Wells Fargo & Company/mn | 387,595 | -2.64 | 33,178 | 6.10 | ||||
| 2025-07-22 | 13F | Apexium Financial, Lp | 7,980 | 0.00 | 683 | 9.11 | ||||
| 2025-07-23 | 13F | West Paces Advisors Inc. | 363 | 31 | ||||||
| 2025-05-14 | 13F | CIBC World Markets Inc. | 0 | -100.00 | 0 | |||||
| 2025-08-08 | 13F | Capital Investment Advisory Services, LLC | 0 | -100.00 | 0 | |||||
| 2025-07-10 | 13F | Kozak & Associates, Inc. | 319,466 | 18.51 | 27,554 | 37.94 | ||||
| 2025-08-08 | 13F | Hartland & Co., LLC | 2,848 | 244 | ||||||
| 2025-08-04 | 13F | AMG National Trust Bank | 9,411 | 2.74 | 806 | 11.96 | ||||
| 2025-05-15 | 13F/A | Orion Portfolio Solutions, LLC | 3,106 | -6.47 | 244 | -5.81 | ||||
| 2025-08-14 | 13F | Federation des caisses Desjardins du Quebec | 64,126 | 2.02 | 5,489 | 11.18 | ||||
| 2025-08-15 | 13F | CI Private Wealth, LLC | 2,562 | -17.65 | 219 | -10.25 | ||||
| 2025-08-06 | 13F | Prospera Financial Services Inc | 10,554 | 1.47 | 903 | 10.66 | ||||
| 2025-08-18 | 13F | Front Row Advisors LLC | 150 | 0.00 | 13 | 9.09 | ||||
| 2025-08-07 | 13F | Atala Financial Inc | 0 | -100.00 | 0 | |||||
| 2025-08-14 | 13F | Fmr Llc | 15,417 | -1.12 | 1,320 | 7.76 | ||||
| 2025-08-01 | 13F | Bessemer Group Inc | 1,006 | 186.61 | 0 | |||||
| 2025-08-13 | 13F | VestGen Advisors, LLC | 25,847 | 12.65 | 2,213 | 22.75 | ||||
| 2025-08-14 | 13F | Financial Advisory Service, Inc. | 18 | 0.00 | 2 | 0.00 | ||||
| 2025-08-14 | 13F | Wiley Bros.-aintree Capital, Llc | 3,680 | -0.14 | 315 | 6.78 | ||||
| 2025-07-10 | 13F | Charter Oak Capital Management, LLC | 6,083 | -5.16 | 521 | 3.38 | ||||
| 2025-07-25 | 13F | Atria Wealth Solutions, Inc. | 2,683 | -15.73 | 233 | -6.80 | ||||
| 2025-06-30 | NP | Two Roads Shared Trust - Anfield U.S. Equity Sector Rotation ETF | 123,177 | 9,571 | ||||||
| 2025-08-14 | 13F | UBS Group AG | 126,556 | -27.63 | 10,833 | -21.13 | ||||
| 2025-07-08 | 13F | Nbc Securities, Inc. | 1,372 | 64.71 | 0 | |||||
| 2025-07-25 | 13F | Lion Street Advisors, LLC | 3,385 | 0.00 | 290 | 9.06 | ||||
| 2025-09-04 | 13F/A | Advisor Group Holdings, Inc. | 68,204 | 7.78 | 5,838 | 17.46 | ||||
| 2025-07-30 | 13F | Wbh Advisory Inc | 8,988 | 151.69 | 769 | 174.64 | ||||
| 2025-07-18 | 13F | SOA Wealth Advisors, LLC. | 340 | 0.29 | 29 | 11.54 | ||||
| 2025-08-12 | 13F | Jpmorgan Chase & Co | 298,829 | 4.94 | 25,580 | 14.36 | ||||
| 2025-08-11 | 13F | One Capital Management, LLC | 0 | -100.00 | 0 | |||||
| 2025-08-13 | 13F | Jones Financial Companies Lllp | 32,970 | 13.25 | 2,796 | 23.62 | ||||
| 2025-07-29 | 13F | Private Trust Co Na | 570 | -50.86 | 49 | -47.25 | ||||
| 2025-08-13 | 13F | Brown Advisory Inc | 13,350 | 0.00 | 1,143 | 8.97 | ||||
| 2025-08-27 | 13F/A | Brinker Capital Investments, LLC | 5,934 | 91.05 | 508 | 108.64 | ||||
| 2025-07-14 | 13F | GAMMA Investing LLC | 1,323 | 0.00 | 113 | 9.71 | ||||
| 2025-07-16 | 13F | Swisher Financial Concepts, Inc. | 3,101 | 0.00 | 265 | 9.05 | ||||
| 2025-07-31 | 13F | Carnegie Capital Asset Management, LLC | 2,860 | -62.61 | 245 | -55.31 | ||||
| 2025-07-29 | 13F | Koshinski Asset Management, Inc. | 21,149 | 2.25 | 1,810 | 11.45 | ||||
| 2025-08-13 | 13F | Johnson Financial Group, Inc. | 273 | 0.00 | 23 | 9.52 | ||||
| 2025-07-16 | 13F/A | CX Institutional | 950 | 0 | ||||||
| 2025-07-17 | 13F | Consolidated Capital Management, Llc | 6,060 | 3.64 | 519 | 12.85 | ||||
| 2025-07-24 | 13F | 3Chopt Investment Partners, LLC | 580 | -54.79 | 50 | -51.00 | ||||
| 2025-07-29 | 13F | SAM Advisors, LLC | 115,807 | 1.98 | 9,913 | 11.14 | ||||
| 2025-07-07 | 13F | Nova Wealth Management, Inc. | 57 | 0.00 | 5 | 0.00 | ||||
| 2025-08-14 | 13F | Raymond James Financial Inc | 488,952 | -11.77 | 41,854 | -3.85 | ||||
| 2025-08-05 | 13F | Kesler, Norman & Wride, LLC | 5,340 | 0.64 | 457 | 9.86 | ||||
| 2025-05-05 | 13F | IFP Advisors, Inc | 0 | -100.00 | 0 | |||||
| 2025-07-16 | 13F | Arkansas Financial Group, Inc. | 116,174 | -3.17 | 9,985 | 15.58 | ||||
| 2025-08-04 | 13F | Adell Harriman & Carpenter Inc | 2,400 | 205 | ||||||
| 2025-08-05 | 13F | Tsfg, Llc | 225 | 0.00 | 0 | |||||
| 2025-08-06 | 13F | Quadrant Private Wealth Management, LLC | 7,438 | 0.00 | 637 | 8.90 | ||||
| 2025-07-23 | 13F | Litman Gregory Asset Management LLC | 14,385 | 0.00 | 1,231 | 9.03 | ||||
| 2025-08-14 | 13F | Colony Group, LLC | 6,826 | 0.00 | 584 | 8.96 | ||||
| 2025-07-23 | 13F | Indiana Trust & Investment Management CO | 201 | 0.00 | 17 | 13.33 | ||||
| 2025-08-14 | 13F | Royal Bank Of Canada | 457,296 | -1.54 | 39,144 | 7.29 | ||||
| 2025-05-16 | 13F | Coppell Advisory Solutions LLC | 0 | -100.00 | 0 | |||||
| 2025-07-16 | 13F | Diversified Enterprises, LLC | 31,801 | -0.35 | 2,722 | 8.62 | ||||
| 2025-08-11 | 13F | Citigroup Inc | 850 | -58.46 | 73 | -55.00 | ||||
| 2025-08-07 | 13F | Cypress Capital Management LLC (WY) | 1,395 | -16.67 | 119 | -9.16 | ||||
| 2025-08-11 | 13F | Principal Securities, Inc. | 622 | -89.63 | 53 | -88.63 | ||||
| 2025-08-05 | 13F | Carolinas Wealth Consulting Llc | 0 | -100.00 | 0 | -100.00 | ||||
| 2025-08-08 | 13F | Pnc Financial Services Group, Inc. | 2,008 | 0.00 | 172 | 8.92 | ||||
| 2025-08-12 | 13F | J.w. Cole Advisors, Inc. | 58,660 | -1.15 | 5,021 | 7.72 | ||||
| 2025-08-12 | 13F | SRS Capital Advisors, Inc. | 922 | 1.65 | 79 | 9.86 | ||||
| 2025-08-14 | 13F | Susquehanna International Group, Llp | Put | 30,900 | 45.07 | 2,645 | 58.10 | |||
| 2025-08-07 | 13F | Wealth Forward, LLC | 3,165 | 0.00 | 271 | 8.87 | ||||
| 2025-08-14 | 13F | Susquehanna International Group, Llp | 21,552 | -33.89 | 1,845 | -27.97 | ||||
| 2025-08-06 | 13F | Wedbush Securities Inc | 7,557 | -12.57 | 1 | |||||
| 2025-05-12 | 13F | Maia Wealth LLC | 0 | -100.00 | 0 | |||||
| 2025-08-14 | 13F | Susquehanna International Group, Llp | Call | 51,300 | 14.25 | 4,391 | 24.53 | |||
| 2025-04-17 | 13F | North Star Investment Management Corp. | 0 | -100.00 | 0 | |||||
| 2025-07-28 | 13F | Rosenberg Matthew Hamilton | 900 | 0.00 | 77 | 10.00 | ||||
| 2025-07-29 | 13F | Cottonwood Capital Advisors, Llc | 12,345 | -1.06 | 1,057 | 7.76 | ||||
| 2025-07-30 | 13F | Black Diamond Financial, LLC | 2,931 | 0.00 | 251 | 8.70 | ||||
| 2025-07-16 | 13F | Magnus Financial Group LLC | 3,659 | 20.56 | 313 | 31.51 | ||||
| 2025-04-11 | 13F | Verum Partners LLC | 0 | -100.00 | 0 | |||||
| 2025-05-27 | NP | Forethought Variable Insurance Trust - Global Atlantic BlackRock Selects Managed Risk Portfolio (formerly Global Atlantic BlackRock Global Allocation Managed Risk Portfolio) Global Atlantic BlackRock Global Allocation Managed Risk Portfolio | 42,570 | -41.13 | 3,344 | -40.58 | ||||
| 2025-08-06 | 13F | Savant Capital, LLC | 11,385 | -15.64 | 975 | -8.11 | ||||
| 2025-08-12 | 13F | LPL Financial LLC | 427,775 | -6.89 | 36,618 | 1.46 | ||||
| 2025-08-08 | 13F | Cetera Investment Advisers | 43,951 | -3.23 | 3,762 | 5.47 | ||||
| 2025-08-13 | 13F | Lido Advisors, LLC | 3,216 | 0.00 | 275 | 9.13 | ||||
| 2025-08-05 | 13F | Sensible Money, LLC | 3,213 | 0.00 | 275 | 9.13 | ||||
| 2025-07-10 | 13F | Focus Financial Network, Inc. | 33,509 | 9.78 | 2,868 | 19.65 | ||||
| 2025-08-14 | 13F | Ancora Advisors, LLC | 240 | 0.00 | 21 | 11.11 | ||||
| 2025-08-06 | 13F | New Millennium Group LLC | 60 | 0.00 | 5 | 25.00 | ||||
| 2025-08-14 | 13F | Royal Capital Wealth Management, LLC | 2,400 | 205 | ||||||
| 2025-07-17 | 13F | Tritonpoint Wealth, Llc | 4,609 | -19.80 | 395 | -12.64 | ||||
| 2025-08-08 | 13F | Foundations Investment Advisors, LLC | 505,496 | 4.24 | 43,270 | 13.60 | ||||
| 2025-07-25 | 13F | Keener Financial Planning LLC | 900 | 0 | ||||||
| 2025-08-13 | 13F | Quadrature Capital Ltd | 0 | -100.00 | 0 | |||||
| 2025-08-13 | 13F | Financial Avengers, Inc. | 0 | -100.00 | 0 | |||||
| 2025-07-10 | 13F | Ferguson Wellman Capital Management, Inc | 156,766 | -0.73 | 13,419 | 8.19 | ||||
| 2025-08-05 | 13F | Benchmark Financial Wealth Advisors, LLC | 2,722 | 233 | ||||||
| 2025-08-14 | 13F | Bank Of America Corp /de/ | 493,269 | 0.53 | 42,224 | 9.56 | ||||
| 2025-08-06 | 13F | AE Wealth Management LLC | 548 | 3.79 | 47 | 12.20 | ||||
| 2025-08-11 | 13F | Hopwood Financial Services, Inc. | 658 | -6.93 | 56 | 1.82 | ||||
| 2025-08-13 | 13F | Bank Of Nova Scotia | 72,600 | 0.00 | 6,215 | 8.98 | ||||
| 2025-08-11 | 13F | HighTower Advisors, LLC | 51,375 | -4.51 | 4,398 | 4.07 | ||||
| 2025-08-15 | 13F | Equitable Holdings, Inc. | 18,831 | 3.47 | 1,612 | 12.74 | ||||
| 2025-04-30 | 13F | Stratos Wealth Partners, LTD. | 0 | -100.00 | 0 | |||||
| 2025-08-13 | 13F | Northwestern Mutual Wealth Management Co | 30,116 | 1.23 | 2,578 | 10.32 | ||||
| 2025-08-19 | 13F | Asset Dedication, LLC | 3,213 | 0.00 | 275 | 9.13 | ||||
| 2025-08-13 | 13F | Allium Financial Advisors, Llc | 4,444 | 0.00 | 380 | 8.88 | ||||
| 2025-08-13 | 13F | Baird Financial Group, Inc. | 8,694 | 3.82 | 744 | 13.24 | ||||
| 2025-08-14 | 13F | Circle Wealth Management, LLC | 294,600 | 0.00 | 25,218 | 8.98 | ||||
| 2025-07-17 | 13F | Fifth Third Securities, Inc. | 23,707 | 3.80 | 2,029 | 13.10 | ||||
| 2025-08-13 | 13F | Baltimore-Washington Financial Advisors, Inc. | 393,663 | -0.74 | 33,698 | 8.17 | ||||
| 2025-08-08 | 13F | Family Firm, Inc. | 31,367 | -1.66 | 2,685 | 7.15 | ||||
| 2025-08-06 | 13F | Rps Advisory Solutions Llc | 6,286 | 11.22 | 537 | 21.22 | ||||
| 2025-07-17 | 13F | Sound Income Strategies, LLC | 0 | -100.00 | 0 | |||||
| 2025-08-08 | 13F | Creative Planning | 23,657 | -0.52 | 2,025 | 8.40 | ||||
| 2025-05-09 | 13F | Hemington Wealth Management | 0 | -100.00 | 0 | |||||
| 2025-07-23 | 13F | Castle Rock Wealth Management, LLC | 6,664 | -5.84 | 581 | 5.25 | ||||
| 2025-08-14 | 13F | Qube Research & Technologies Ltd | 2,368 | 267.70 | 203 | 304.00 | ||||
| 2025-07-07 | 13F | Roxbury Financial LLC | 302 | 0.00 | 26 | 0.00 | ||||
| 2025-08-13 | 13F | Millstone Evans Group, LLC | 1,014 | 0.00 | 87 | 8.86 | ||||
| 2025-08-08 | 13F | Avantax Advisory Services, Inc. | 8,276 | -6.39 | 708 | 2.02 | ||||
| 2025-08-14 | 13F | Glenmede Investment Management, LP | 900 | 77 | ||||||
| 2025-08-13 | 13F | Green Harvest Asset Management LLC | 305,036 | 42.17 | 26,111 | 54.92 | ||||
| 2025-07-08 | 13F | Rise Advisors, LLC | 126 | 0.00 | 11 | 11.11 | ||||
| 2025-08-12 | 13F | AlphaCore Capital LLC | 522 | 1,173.17 | 45 | 1,366.67 | ||||
| 2025-08-08 | 13F | Horizon Family Wealth, Inc. | 4,913 | 1.53 | 421 | 10.53 | ||||
| 2025-07-18 | 13F | Truist Financial Corp | 68,958 | -6.71 | 5,903 | 1.65 | ||||
| 2025-08-14 | 13F | Objective Capital Management, LLC | 5,859 | 0.03 | 502 | 8.91 | ||||
| 2025-08-14 | 13F | Goldman Sachs Group Inc | 1,065,359 | -2.03 | 91,195 | 6.76 | ||||
| 2025-08-07 | 13F | CENTRAL TRUST Co | 714 | 0.28 | 61 | 10.91 | ||||
| 2025-07-29 | 13F | International Assets Investment Management, Llc | 2,928 | 0.38 | 251 | 9.17 | ||||
| 2025-08-14 | 13F | Two Sigma Investments, Lp | 53,900 | 4,614 | ||||||
| 2025-07-15 | 13F | Financial Partners Group, Inc | 6,953 | -0.44 | 595 | 8.58 | ||||
| 2025-08-13 | 13F | GeoWealth Management, LLC | 11,642 | -13.85 | 997 | -6.13 | ||||
| 2025-04-15 | 13F | Laurel Wealth Advisors LLC | 0 | -100.00 | 0 | |||||
| 2025-08-14 | 13F | Guardian Wealth Advisors, Llc / Nc | 1,500 | 0.00 | 128 | 9.40 | ||||
| 2025-08-14 | 13F | Investmark Advisory Group LLC | 6,166 | 0.28 | 528 | 9.11 | ||||
| 2025-07-29 | 13F | Harbor Asset Planning, Inc. | 6,431 | 550 | ||||||
| 2025-07-28 | 13F | Mutual Advisors, LLC | 2,800 | 0.00 | 248 | 15.42 | ||||
| 2025-08-14 | 13F | Glen Eagle Advisors, LLC | 216 | 0.00 | 18 | 12.50 | ||||
| 2025-07-31 | 13F | Burke & Herbert Bank & Trust Co | 11,928 | 0.00 | 1,021 | 9.08 | ||||
| 2025-08-13 | 13F | Cresset Asset Management, LLC | 6,422 | 0.00 | 550 | 8.93 | ||||
| 2025-08-13 | 13F | Cerity Partners LLC | 9,245 | 0.08 | 791 | 9.10 | ||||
| 2025-08-07 | 13F | Parkside Financial Bank & Trust | 1 | 0.00 | 0 | |||||
| 2025-08-11 | 13F | Rothschild Investment Llc | 1,774 | 0.00 | 152 | 8.63 | ||||
| 2025-07-14 | 13F | Sowell Financial Services LLC | 2,838 | -38.17 | 243 | -32.78 | ||||
| 2025-08-14 | 13F | RMB Capital Management, LLC | 3,938 | 41.15 | 337 | 53.88 | ||||
| 2025-08-14 | 13F | Comerica Bank | 27,285 | -4.19 | 2,336 | 4.43 | ||||
| 2025-07-07 | 13F | Thurston, Springer, Miller, Herd & Titak, Inc. | 534 | 0.00 | 46 | 9.76 | ||||
| 2025-08-05 | 13F | Simplex Trading, Llc | 0 | -100.00 | 0 | |||||
| 2025-08-07 | 13F | Resources Investment Advisors, LLC. | 2,891 | 0.03 | 247 | 9.29 | ||||
| 2025-08-11 | 13F | Anfield Capital Management, LLC | 123,991 | -1.30 | 10,614 | 7.56 | ||||
| 2025-08-05 | 13F | Pointe Capital Management LLC | 2,586 | 0.00 | 221 | 8.87 | ||||
| 2025-08-13 | 13F | Scotia Capital Inc. | 72,676 | 8.24 | 6,221 | 17.94 | ||||
| 2025-07-29 | 13F | Chicago Partners Investment Group LLC | 3,514 | 0.06 | 309 | 11.55 | ||||
| 2025-08-12 | 13F | BlackRock, Inc. | 0 | -100.00 | 0 | |||||
| 2025-08-07 | 13F | Commerce Bank | 3,954 | 0.00 | 338 | 9.03 | ||||
| 2025-08-19 | 13F | Newbridge Financial Services Group, Inc. | 250 | 0.00 | 21 | 10.53 | ||||
| 2025-08-08 | 13F | Comprehensive Financial Planning, Inc./PA | 645 | 0.31 | 55 | 10.00 | ||||
| 2025-08-18 | 13F/A | National Bank Of Canada /fi/ | 24,927 | 1.93 | 2,133 | 11.04 | ||||
| 2025-07-29 | 13F | Mine & Arao Wealth Creation & Management, LLC. | 12,025 | -0.46 | 1,029 | 8.54 | ||||
| 2025-07-30 | 13F | Avidian Wealth Solutions, LLC | 4,655 | 0.02 | 398 | 9.04 | ||||
| 2025-08-12 | 13F | Steward Partners Investment Advisory, Llc | 4,008 | 44.95 | 343 | 58.06 | ||||
| 2025-08-14 | 13F | Two Sigma Securities, Llc | 0 | -100.00 | 0 | |||||
| 2025-07-16 | 13F | Howard Capital Management Group, LLC | 97,912 | -1.25 | 8,381 | 7.63 | ||||
| 2025-05-27 | 13F | Advisors Capital Management, LLC | 0 | -100.00 | 0 | |||||
| 2025-07-23 | 13F | Lakeshore Capital Group, Inc. | 6,997 | -14.87 | 599 | -7.29 | ||||
| 2025-08-13 | 13F | Colonial Trust Co / SC | 105 | 0.00 | 9 | 0.00 | ||||
| 2025-05-05 | 13F | Transce3nd, LLC | 0 | -100.00 | 0 | |||||
| 2025-08-11 | 13F | Bellwether Advisors, LLC | 42 | 0.00 | 4 | 0.00 | ||||
| 2025-07-16 | 13F | Register Financial Advisors LLC | 4,491 | 0.20 | 384 | 9.09 | ||||
| 2025-08-01 | 13F | Cobblestone Capital Advisors Llc /ny/ | 17,910 | 0.00 | 1,533 | 9.03 | ||||
| 2025-07-24 | 13F | Bernard Wealth Management Corp. | 44,626 | 26.33 | 3,820 | 37.67 | ||||
| 2025-07-22 | 13F | Mascoma Wealth Management LLC | 189 | 0.00 | 16 | 14.29 |