Mga Batayang Estadistika
| Pemilik Institusional | 227 total, 227 long only, 0 short only, 0 long/short - change of 4.59% MRQ |
| Alokasi Portofolio Rata-rata | 0.1711 % - change of -15.85% MRQ |
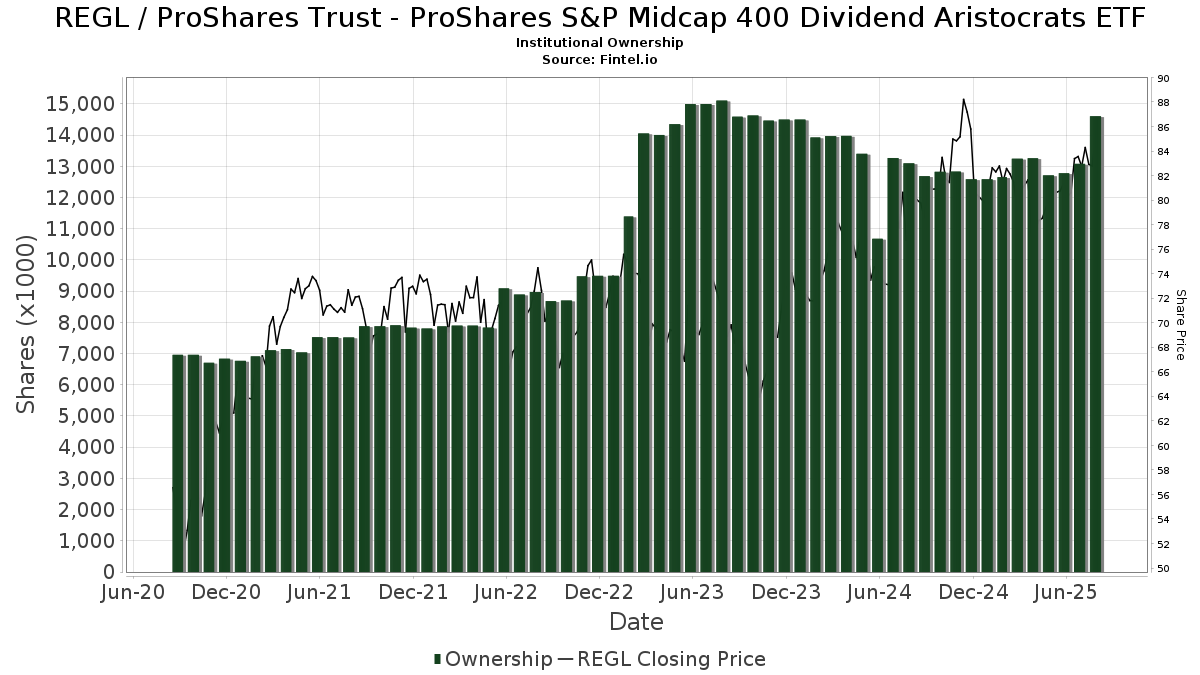
| Saham Institusional (Jangka Panjang) | 14,621,531 (ex 13D/G) - change of 1.84MM shares 14.40% MRQ |
| Nilai Institusional (Jangka Panjang) | $ 1,148,393 USD ($1000) |
Kepemilikan Institusional dan Pemegang Saham
ProShares Trust - ProShares S&P Midcap 400 Dividend Aristocrats ETF (US:REGL) memiliki 227 pemilik institusional dan pemegang saham yang telah mengajukan formulir 13D/G atau 13F kepada Komisi Bursa Efek (Securities Exchange Commission/SEC). Lembaga-lembaga ini memegang total 14,621,531 saham. Pemegang saham terbesar meliputi Coldstream Capital Management Inc, Morgan Stanley, Stifel Financial Corp, Benjamin Edwards Inc, LPL Financial LLC, Raymond James Financial Inc, Wells Fargo & Company/mn, Northwestern Mutual Wealth Management Co, Bank Of America Corp /de/, and UBS Group AG .
Struktur kepemilikan institusional ProShares Trust - ProShares S&P Midcap 400 Dividend Aristocrats ETF (BATS:REGL) menunjukkan posisi terkini di perusahaan oleh institusi dan dana, serta perubahan terbaru dalam ukuran posisi. Pemegang saham utama dapat mencakup investor individu, reksa dana, dana lindung nilai, atau institusi. Jadwal 13D menunjukkan bahwa investor memegang (atau pernah memegang) lebih dari 5% saham perusahaan dan bermaksud (atau pernah bermaksud) untuk secara aktif mengejar perubahan strategi bisnis. Jadwal 13G menunjukkan investasi pasif lebih dari 5%.
The share price as of September 5, 2025 is 86.14 / share. Previously, on September 6, 2024, the share price was 78.69 / share. This represents an increase of 9.46% over that period.
Skor Sentimen Dana
Skor Sentimen Dana (sebelumnya dikenal sebagai Skor Akumulasi Kepemilikan) menemukan saham-saham yang paling banyak dibeli oleh dana. Ini adalah hasil dari model kuantitatif multi-faktor yang canggih yang mengidentifikasi perusahaan dengan tingkat akumulasi institusional tertinggi. Model penilaian menggunakan kombinasi dari total peningkatan pemilik yang diungkapkan, perubahan dalam alokasi portofolio pada pemilik tersebut, dan metrik lainnya. Angka berkisar dari 0 hingga 100, dengan angka yang lebih tinggi menunjukkan tingkat akumulasi yang lebih tinggi dibandingkan dengan perusahaan sejenisnya, dan 50 adalah rata-ratanya.
Frekuensi Pembaruan: Setiap Hari
Lihat Ownership Explorer, yang menyediakan daftar perusahaan dengan peringkat tertinggi.
Rasio Put/Call Institusional
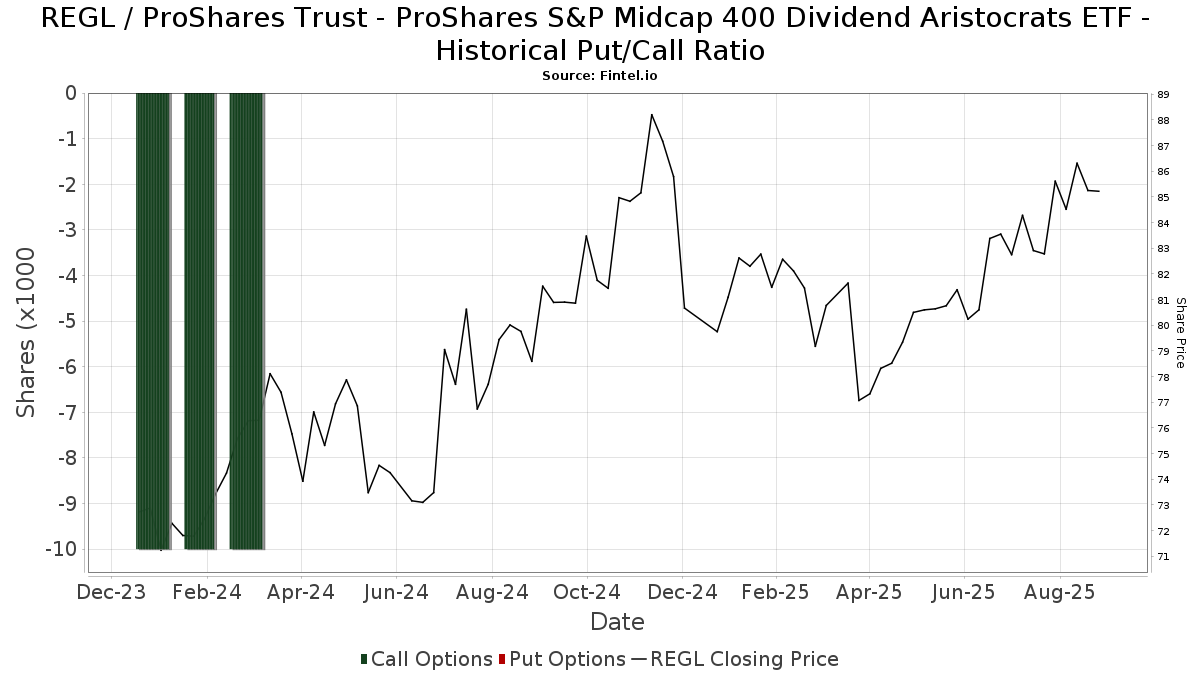
Selain melaporkan isu ekuitas dan utang standar, institusi dengan aset di bawah manajemen lebih dari 100 juta dolar AS juga harus mengungkapkan kepemilikan opsi put dan call mereka. Karena opsi put umumnya menunjukkan sentimen negatif, dan opsi call menunjukkan sentimen positif, kita dapat mengetahui sentimen institusional secara keseluruhan dengan memplot rasio put terhadap call. Grafik di sebelah kanan memplot rasio put/call historis untuk instrumen ini.
Menggunakan Rasio Put/Call sebagai indikator sentimen investor mengatasi salah satu kekurangan utama dari penggunaan total kepemilikan institusional, yaitu sejumlah besar aset yang dikelola diinvestasikan secara pasif untuk melacak indeks. Dana yang dikelola secara pasif biasanya tidak membeli opsi, sehingga indikator rasio put/call lebih akurat dalam melacak sentimen dana yang dikelola secara aktif.
Pengajuan 13F dan NPORT
Detail pada pengajuan 13F tersedia gratis. Detail pada pengajuan NP memerlukan keanggotaan premium. Baris berwarna hijau menunjukkan posisi baru. Baris berwarna merah menunjukkan posisi yang sudah ditutup. Klik tautan ini ikon untuk melihat riwayat transaksi selengkapnya.
Tingkatkan
untuk membuka data premium dan mengekspor ke Excel ![]() .
.
| Tanggal File | Sumber | Investor | Ketik | Presyo ng Avg (Silangan) |
Saham | Δ Saham (%) |
Dilaporkan Nilai ($1000) |
Nilai Δ (%) |
Alokasi Port (%) |
|
|---|---|---|---|---|---|---|---|---|---|---|
| 2025-08-12 | 13F | Global Retirement Partners, LLC | 1,453 | 923.24 | 118 | 972.73 | ||||
| 2025-07-21 | 13F | Hilltop National Bank | 0 | -100.00 | 0 | |||||
| 2025-07-24 | 13F | MSH Capital Advisors LLC | 12,504 | 1.40 | 1,020 | 2.52 | ||||
| 2025-08-14 | 13F | Avant Capital LLC | 45,974 | -3.96 | 3,748 | -2.90 | ||||
| 2025-08-14 | 13F | Susquehanna International Group, Llp | 16,872 | 1,376 | ||||||
| 2025-08-13 | 13F | Baird Financial Group, Inc. | 306,993 | 1.27 | 25,031 | 2.38 | ||||
| 2025-08-12 | 13F | Financial Advocates Investment Management | 0 | -100.00 | 0 | |||||
| 2025-08-06 | 13F | Centerpoint Advisory Group | 2,998 | 0.00 | 244 | 1.24 | ||||
| 2025-08-14 | 13F | CoreCap Advisors, LLC | 90 | 0.00 | 7 | 0.00 | ||||
| 2025-08-14 | 13F | Heritage Wealth Management, Inc. | 6,767 | 2.30 | 552 | 3.38 | ||||
| 2025-07-23 | 13F | Armstrong, Fleming & Moore, Inc | 0 | -100.00 | 0 | |||||
| 2025-08-12 | 13F | J.w. Cole Advisors, Inc. | 10,290 | 8.05 | 839 | 9.24 | ||||
| 2025-07-01 | 13F | Confluence Investment Management Llc | 300,181 | 24,475 | ||||||
| 2025-05-01 | 13F | SkyOak Wealth, LLC | 0 | -100.00 | 0 | |||||
| 2025-08-08 | 13F | Biondo Investment Advisors, LLC | 22,983 | 5.18 | 1,874 | 6.30 | ||||
| 2025-08-11 | 13F | HighTower Advisors, LLC | 23,531 | 3.80 | 1,919 | 4.92 | ||||
| 2025-08-12 | 13F | MAI Capital Management | 439 | 0.23 | 36 | 0.00 | ||||
| 2025-08-14 | 13F | Citadel Advisors Llc | 13,877 | 1,131 | ||||||
| 2025-07-30 | 13F | Roman Butler Fullerton & Co | 13,612 | 4.27 | 1,147 | 13.24 | ||||
| 2025-08-07 | 13F | Cascade Financial Partners, LLC | 53,525 | -2.64 | 4,364 | -1.56 | ||||
| 2025-08-14 | 13F | Modern Wealth Management, LLC | 63,315 | 7.18 | 5,162 | 8.35 | ||||
| 2025-07-17 | 13F | Vermillion Wealth Management, Inc. | 261 | 21 | ||||||
| 2025-08-11 | 13F | Citigroup Inc | 1 | 0.00 | 0 | |||||
| 2025-07-18 | 13F | QTR Family Wealth, LLC | 2,959 | 0.44 | 241 | 1.69 | ||||
| 2025-08-19 | 13F | Anchor Investment Management, LLC | 3,303 | -2.34 | 269 | -1.10 | ||||
| 2025-08-11 | 13F | Aptus Capital Advisors, LLC | 4,086 | 0.64 | 333 | 1.83 | ||||
| 2025-08-19 | 13F | Cape Investment Advisory, Inc. | 227 | -3.40 | 19 | 0.00 | ||||
| 2025-07-17 | 13F | PMG Wealth Management, Inc. | 23,597 | -49.15 | 1,924 | -48.61 | ||||
| 2025-08-06 | 13F | Wedbush Securities Inc | 14,797 | 6.35 | 1 | 0.00 | ||||
| 2025-04-25 | 13F | Valley National Advisers Inc | 0 | -100.00 | 0 | |||||
| 2025-08-11 | 13F | CFS Investment Advisory Services, LLC | 7,577 | 22.27 | 1 | |||||
| 2025-07-11 | 13F | Westfuller Advisors, LLC | 6,304 | 0.64 | 516 | 1.57 | ||||
| 2025-08-05 | 13F | Huntington National Bank | 264 | -17.03 | ||||||
| 2025-08-04 | 13F | Assetmark, Inc | 499 | 5.72 | 41 | 5.26 | ||||
| 2025-07-16 | 13F | Essex Financial Services, Inc. | 46,883 | -1.82 | 3,823 | -0.75 | ||||
| 2025-08-13 | 13F | American Money Management, LLC | 3,451 | 2.74 | 281 | 4.07 | ||||
| 2025-08-14 | 13F | Visionary Wealth Advisors | 39,125 | 79.86 | 3,190 | 81.87 | ||||
| 2025-08-08 | 13F | Cetera Investment Advisers | 75,968 | 1.35 | 6,194 | 2.46 | ||||
| 2025-08-04 | 13F | IFG Advisory, LLC | 3,231 | -28.83 | 263 | -28.14 | ||||
| 2025-07-24 | 13F | Blair William & Co/il | 947 | 46.37 | 77 | 48.08 | ||||
| 2025-08-14 | 13F | Stifel Financial Corp | 882,721 | 1,163.05 | 71,973 | 1,177.00 | ||||
| 2025-08-19 | 13F | Advisory Services Network, LLC | 2,631 | -1.09 | 217 | 0.93 | ||||
| 2025-08-14 | 13F | Warren Averett Asset Management, LLC | 3,901 | 0.03 | 318 | 1.27 | ||||
| 2025-07-07 | 13F | Wesbanco Bank Inc | 5,678 | 0.00 | 463 | 1.09 | ||||
| 2025-07-11 | 13F | Caldwell Securities, Inc | 3,311 | 17.04 | 270 | 17.98 | ||||
| 2025-08-08 | 13F | Thoroughbred Financial Services, Llc | 2,960 | -8.53 | 0 | |||||
| 2025-08-13 | 13F | Northwestern Mutual Wealth Management Co | 540,284 | 0.27 | 44,052 | 1.37 | ||||
| 2025-07-24 | 13F | Us Bancorp \de\ | 4,063 | 0.00 | 331 | 1.22 | ||||
| 2025-08-13 | 13F | Jones Financial Companies Lllp | 63,552 | 33.55 | 5,181 | 35.74 | ||||
| 2025-08-08 | 13F | Larson Financial Group LLC | 842 | 0.00 | 69 | 1.49 | ||||
| 2025-08-14 | 13F | Keystone Financial Services, LLC | 4,644 | 32.31 | 379 | 33.57 | ||||
| 2025-08-04 | 13F | Pensionmark Financial Group, Llc | 44,934 | -0.04 | 3,664 | 1.05 | ||||
| 2025-08-08 | 13F | Creative Planning | 0 | -100.00 | 0 | |||||
| 2025-08-12 | 13F/A | Cozad Asset Management Inc | 12,307 | -2.42 | 1,003 | -1.38 | ||||
| 2025-07-30 | 13F | Parcion Private Wealth LLC | 8,364 | -15.34 | 682 | -14.45 | ||||
| 2025-08-14 | 13F | Ameriprise Financial Inc | 199,294 | 29.52 | 16,251 | 30.81 | ||||
| 2025-07-30 | 13F | FNY Investment Advisers, LLC | 500 | 0 | ||||||
| 2025-08-12 | 13F | Proequities, Inc. | 0 | 0 | ||||||
| 2025-08-11 | 13F | Principal Securities, Inc. | 5,568 | 972.83 | 454 | 1,004.88 | ||||
| 2025-08-01 | 13F | MorganRosel Wealth Management, LLC | 300 | 0.00 | 24 | 0.00 | ||||
| 2025-08-12 | 13F | Gladstone Institutional Advisory LLC | 44,638 | -3.84 | 3,640 | -2.78 | ||||
| 2025-08-15 | 13F | Kestra Advisory Services, LLC | 2,882 | 235 | ||||||
| 2025-07-30 | 13F | Cullen/frost Bankers, Inc. | 1,828 | 0.61 | 149 | 2.05 | ||||
| 2025-08-12 | 13F | O'shaughnessy Asset Management, Llc | 1,619 | 2.66 | 132 | 3.94 | ||||
| 2025-08-12 | 13F | Retirement Planning Co of New England, Inc. | 5,201 | -3.51 | 424 | -2.30 | ||||
| 2025-07-10 | 13F | Focus Financial Network, Inc. | 4,867 | 397 | ||||||
| 2025-08-14 | 13F | Royal Bank Of Canada | 299,906 | -5.66 | 24,452 | -4.63 | ||||
| 2025-08-14 | 13F | Qube Research & Technologies Ltd | 504 | 262.59 | 41 | 272.73 | ||||
| 2025-08-14 | 13F | Wells Fargo & Company/mn | 554,003 | -17.84 | 45,171 | -16.94 | ||||
| 2025-07-14 | 13F | Armstrong Advisory Group, Inc | 148 | 0.00 | 12 | 9.09 | ||||
| 2025-08-12 | 13F | PSI Advisors, LLC | 4,968 | -1.82 | 405 | -0.74 | ||||
| 2025-08-11 | 13F | Summit Wealth Partners, LLC | 39,395 | -23.85 | 3,212 | -23.01 | ||||
| 2025-08-14 | 13F | Financial Advisory Service, Inc. | 86,539 | 3.87 | 7,056 | 5.00 | ||||
| 2025-07-28 | 13F | Tower Wealth Partners, Inc. | 13,492 | 2.44 | 1,100 | 3.58 | ||||
| 2025-04-29 | 13F | Td Private Client Wealth Llc | 0 | -100.00 | 0 | |||||
| 2025-08-11 | 13F | United Advisor Group, LLC | 47,030 | -0.56 | 3,835 | 0.52 | ||||
| 2025-07-30 | 13F/A | KPP Advisory Services LLC | 4,414 | -0.07 | 360 | 0.84 | ||||
| 2025-08-15 | 13F | Morgan Stanley | 2,356,024 | 4.88 | 192,098 | 6.03 | ||||
| 2025-07-22 | 13F | Signature Wealth Management Partners, LLC | 2,515 | 205 | ||||||
| 2025-07-16 | 13F | Kerntke Otto McGlone Wealth Management Group | 38,463 | -0.08 | 3,136 | 1.03 | ||||
| 2025-08-14 | 13F | Integrated Wealth Concepts LLC | 2,868 | 9.97 | 234 | 10.95 | ||||
| 2025-08-12 | 13F | Country Trust Bank | 130 | 0.00 | 11 | 0.00 | ||||
| 2025-08-08 | 13F | L & S Advisors Inc | 9,950 | 0.00 | 811 | 1.12 | ||||
| 2025-08-12 | 13F | Coston, McIsaac & Partners | 7 | 0 | ||||||
| 2025-07-15 | 13F | Well Done, LLC | 4,185 | -1.23 | 341 | 0.00 | ||||
| 2025-07-15 | 13F | Main Street Group, LTD | 15 | 0.00 | 1 | 0.00 | ||||
| 2025-08-13 | 13F | Continuum Advisory, LLC | 0 | -100.00 | 0 | |||||
| 2025-07-29 | 13F | LMG Wealth Partners, LLC | 38,469 | -0.96 | 3,137 | 0.13 | ||||
| 2025-07-17 | 13F | Janney Montgomery Scott LLC | 52,698 | 30.38 | 4 | 33.33 | ||||
| 2025-08-04 | 13F | Spire Wealth Management | 1,139 | 0.62 | 93 | 1.10 | ||||
| 2025-08-14 | 13F | Great Valley Advisor Group, Inc. | 6,806 | -1.02 | 555 | 0.00 | ||||
| 2025-05-01 | 13F | Cutter & CO Brokerage, Inc. | 0 | -100.00 | 0 | |||||
| 2025-07-09 | 13F | Clarus Wealth Advisors | 6,315 | -7.72 | 525 | -0.38 | ||||
| 2025-07-29 | 13F | Chicago Partners Investment Group LLC | 3,200 | 0.00 | 270 | 6.32 | ||||
| 2025-08-11 | 13F | Intrepid Financial Planning Group LLC | 14,264 | 1.49 | 1,163 | 2.65 | ||||
| 2025-07-14 | 13F | Sowell Financial Services LLC | 4,178 | 12.92 | 341 | 14.09 | ||||
| 2025-07-17 | 13F/A | Capital Investment Advisors, LLC | 9,187 | -5.80 | 749 | -4.71 | ||||
| 2025-08-13 | 13F | Colonial Trust Co / SC | 2,500 | 0.00 | 204 | 1.00 | ||||
| 2025-08-14 | 13F | Wiley Bros.-aintree Capital, Llc | 255,649 | 42.25 | 20,847 | 44.62 | ||||
| 2025-08-05 | 13F | Sigma Planning Corp | 3,200 | 0.00 | 261 | 0.78 | ||||
| 2025-08-12 | 13F | Pathstone Holdings, LLC | 72,739 | -50.17 | 5,931 | -49.63 | ||||
| 2025-07-29 | 13F | Swmg, Llc | 7,674 | 42.14 | 642 | 51.77 | ||||
| 2025-08-04 | 13F | Pinnacle Associates Ltd | 51,164 | -26.58 | 4,172 | -25.77 | ||||
| 2025-08-14 | 13F | Mml Investors Services, Llc | 16,978 | 48.75 | 1 | |||||
| 2025-08-08 | 13F | Hartland & Co., LLC | 1,350 | 170.00 | 110 | 175.00 | ||||
| 2025-08-08 | 13F | Pnc Financial Services Group, Inc. | 4,782 | 73.14 | 390 | 75.23 | ||||
| 2025-07-31 | 13F | Hartford Financial Management Inc. | 4,000 | 0.00 | 326 | 1.24 | ||||
| 2025-08-15 | 13F | Equitable Holdings, Inc. | 5,961 | 19.29 | 486 | 20.60 | ||||
| 2025-08-11 | 13F | NewEdge Wealth, LLC | 6,150 | 0.00 | 509 | 2.63 | ||||
| 2025-08-15 | 13F | Captrust Financial Advisors | 2,560 | 209 | ||||||
| 2025-08-07 | 13F | Verus Capital Partners, Llc | 20,674 | -4.31 | 1,686 | -3.27 | ||||
| 2025-08-07 | 13F | CENTRAL TRUST Co | 222 | 18 | ||||||
| 2025-08-14 | 13F | Bank Of America Corp /de/ | 538,451 | 2.30 | 43,903 | 3.42 | ||||
| 2025-08-14 | 13F | EP Wealth Advisors, Inc. | 1,563 | -23.16 | 127 | -22.56 | ||||
| 2025-07-15 | 13F | tru Independence LLC | 6,719 | -1.35 | 548 | -0.36 | ||||
| 2025-08-14 | 13F | Comerica Bank | 14,153 | 58.35 | 1,154 | 60.14 | ||||
| 2025-07-21 | 13F | Ameriflex Group, Inc. | 0 | -100.00 | 0 | |||||
| 2025-07-25 | 13F | Landmark Wealth Management, LLC | 30,092 | -5.50 | 2 | 0.00 | ||||
| 2025-07-08 | 13F | Martin Capital Partners, LLC | 3,428 | 0 | ||||||
| 2025-07-11 | 13F | SILVER OAK SECURITIES, Inc | 84,687 | 51.14 | 6,905 | 53.63 | ||||
| 2025-07-22 | 13F | DAVENPORT & Co LLC | 4,785 | 0.00 | 390 | 1.30 | ||||
| 2025-07-23 | 13F | TriaGen Wealth Management LLC | 4,165 | 0.00 | 340 | 1.19 | ||||
| 2025-08-13 | 13F | SageView Advisory Group, LLC | 0 | -100.00 | 0 | |||||
| 2025-07-15 | 13F | Avaii Wealth Management, Llc | 0 | -100.00 | 0 | |||||
| 2025-07-16 | 13F | Meridian Financial, LLC | 2,622 | 0.15 | 214 | 0.95 | ||||
| 2025-08-08 | 13F | Kingsview Wealth Management, LLC | 3,949 | -21.15 | 322 | -20.35 | ||||
| 2025-07-28 | 13F | WealthPLAN Partners, LLC | 3,916 | -16.47 | 319 | -15.61 | ||||
| 2025-08-14 | 13F | Harvest Investment Services, LLC | 10,520 | 1.34 | 858 | 2.39 | ||||
| 2025-08-14 | 13F | GWM Advisors LLC | 46,099 | 21.88 | 3,759 | 23.21 | ||||
| 2025-08-12 | 13F | Jacobi Capital Management LLC | 58,180 | 4.82 | 4,744 | 5.97 | ||||
| 2025-08-12 | 13F | Accredited Wealth Management, LLC | 50 | 0.00 | 4 | 0.00 | ||||
| 2025-08-14 | 13F | Ancora Advisors, LLC | 400 | 0.00 | 33 | 0.00 | ||||
| 2025-07-11 | 13F | Farther Finance Advisors, LLC | 365 | 0.00 | 30 | 0.00 | ||||
| 2025-07-31 | 13F | Cambridge Investment Research Advisors, Inc. | 93,467 | 8.25 | 8 | 16.67 | ||||
| 2025-07-01 | 13F | Harbor Investment Advisory, Llc | 4,440 | 0.00 | 362 | 1.12 | ||||
| 2025-08-12 | 13F | Coldstream Capital Management Inc | 2,416,257 | -3.57 | 197,010 | -2.52 | ||||
| 2025-08-12 | 13F | BlackRock, Inc. | 144 | -42.40 | 12 | -45.00 | ||||
| 2025-07-21 | 13F | Empirical Financial Services, LLC d.b.a. Empirical Wealth Management | 2,643 | -10.32 | 215 | -9.28 | ||||
| 2025-07-11 | 13F | Essex Savings Bank | 4,376 | -0.27 | 357 | 0.85 | ||||
| 2025-08-11 | 13F | TD Waterhouse Canada Inc. | 380 | 0.00 | 31 | 3.33 | ||||
| 2025-07-10 | 13F | Wealth Enhancement Advisory Services, Llc | 21,932 | -0.28 | 1,836 | 3.55 | ||||
| 2025-08-14 | 13F | Aqr Capital Management Llc | 3,104 | 253 | ||||||
| 2025-08-14 | 13F | Connecticut Wealth Management, LLC | 76,434 | -2.05 | 6,232 | -0.97 | ||||
| 2025-08-12 | 13F | Howe & Rusling Inc | 1,622 | 5.87 | 132 | 7.32 | ||||
| 2025-08-14 | 13F | Mariner, LLC | 5,913 | 85.30 | 482 | 87.55 | ||||
| 2025-08-04 | 13F | Atria Investments Llc | 9,522 | 776 | ||||||
| 2025-07-14 | 13F | S.A. Mason LLC | 5,719 | 0.18 | 466 | 1.30 | ||||
| 2025-08-12 | 13F | Park Square Financial Group, LLC | 45 | 0.00 | 4 | 0.00 | ||||
| 2025-07-25 | 13F | Cwm, Llc | 804 | -3.60 | 0 | |||||
| 2025-08-15 | 13F | CI Private Wealth, LLC | 3,644 | -30.51 | 297 | -31.57 | ||||
| 2025-07-28 | 13F | WealthPlan Investment Management, LLC | 19,021 | 42.77 | 1,551 | 44.32 | ||||
| 2025-08-14 | 13F | Acorn Wealth Advisors, LLC | 7,719 | -17.97 | 629 | -17.02 | ||||
| 2025-08-04 | 13F | L.m. Kohn & Company | 8,589 | 0.02 | 700 | 1.16 | ||||
| 2025-07-09 | 13F | Dynamic Advisor Solutions LLC | 27,923 | -1.18 | 2,277 | -0.09 | ||||
| 2025-08-19 | 13F | National Asset Management, Inc. | 4,070 | -16.36 | 332 | -15.56 | ||||
| 2025-07-29 | 13F | Private Trust Co Na | 2,349 | 5.86 | 192 | 7.30 | ||||
| 2025-07-21 | 13F | Ameritas Advisory Services, LLC | 22,402 | -17.20 | 1,827 | -16.32 | ||||
| 2025-07-14 | 13F | Toth Financial Advisory Corp | 208,751 | 0.56 | 17,020 | 1.67 | ||||
| 2025-07-07 | 13F | RDA Financial Network | 5,109 | 3.63 | 417 | 4.79 | ||||
| 2025-07-24 | 13F | IFP Advisors, Inc | 513 | 0.00 | 42 | 0.00 | ||||
| 2025-08-01 | 13F | Envestnet Asset Management Inc | 120,002 | 59.65 | 9,784 | 61.43 | ||||
| 2025-08-12 | 13F | Wealthbridge Capital Management, Llc | 7,961 | -6.63 | 649 | -5.53 | ||||
| 2025-04-16 | 13F | Hoey Investments, Inc | 0 | -100.00 | 0 | |||||
| 2025-08-12 | 13F | Steward Partners Investment Advisory, Llc | 4,107 | -31.32 | 335 | -30.71 | ||||
| 2025-08-07 | 13F | Rossmore Private Capital | 3,425 | 279 | ||||||
| 2025-08-13 | 13F | Empire Financial Management Company, LLC | 2,502 | 0.00 | 204 | 1.49 | ||||
| 2025-08-13 | 13F | Azimuth Capital Investment Management LLC | 2,650 | 0.00 | 216 | 1.41 | ||||
| 2025-08-07 | 13F | Palisade Asset Management, LLC | 0 | -100.00 | 0 | |||||
| 2025-08-12 | 13F | Integrated Advisors Network LLC | 40,048 | 3,265 | ||||||
| 2025-08-21 | 13F | Pathway Financial Advisers, LLC | 5,979 | 1.03 | 487 | 2.10 | ||||
| 2025-07-22 | 13F | Kraematon Investment Advisors, Inc | 10,923 | -2.40 | 891 | -1.33 | ||||
| 2025-08-04 | 13F | Northwest Financial Advisors | 10,578 | -2.14 | 862 | -1.03 | ||||
| 2025-08-14 | 13F | Two Sigma Investments, Lp | 43,200 | -1.59 | 3,522 | -0.51 | ||||
| 2025-07-28 | 13F | BRYN MAWR TRUST Co | 337 | -11.32 | 27 | -10.00 | ||||
| 2025-04-11 | 13F | Insight Advisors, LLC/ PA | 0 | -100.00 | 0 | |||||
| 2025-08-14 | 13F/A | Rockefeller Capital Management L.P. | 35,711 | 15.39 | 2,912 | 16.67 | ||||
| 2025-08-18 | 13F | Tyler-Stone Wealth Management | 13,884 | 0.41 | 1,132 | 1.52 | ||||
| 2025-04-30 | 13F | Rehmann Capital Advisory Group | 0 | -100.00 | 0 | -100.00 | ||||
| 2025-08-14 | 13F | Raymond James Financial Inc | 663,035 | 2.31 | 54,061 | 3.43 | ||||
| 2025-07-07 | 13F | Thurston, Springer, Miller, Herd & Titak, Inc. | 0 | -100.00 | 0 | |||||
| 2025-07-31 | 13F | Oppenheimer & Co Inc | 4,942 | 0.22 | 403 | 1.26 | ||||
| 2025-07-15 | 13F | Bfsg, Llc | 351 | 0.00 | 29 | 0.00 | ||||
| 2025-08-07 | 13F | PFG Advisors | 7,238 | 8.16 | 590 | 9.46 | ||||
| 2025-08-08 | 13F | Gts Securities Llc | 0 | -100.00 | 0 | |||||
| 2025-08-14 | 13F | Royal Capital Wealth Management, LLC | 16,627 | 0.05 | 1,356 | 1.12 | ||||
| 2025-08-14 | 13F | UBS Group AG | 311,807 | -18.50 | 25,423 | -17.60 | ||||
| 2025-08-05 | 13F | Key FInancial Inc | 9,684 | 2.38 | 790 | 3.54 | ||||
| 2025-08-18 | 13F | Geneos Wealth Management Inc. | 6,897 | 13.89 | 562 | 15.16 | ||||
| 2025-08-11 | 13F | Nations Financial Group Inc, /ia/ /adv | 13,272 | -1.32 | 1,082 | -0.18 | ||||
| 2025-07-18 | 13F | Dogwood Wealth Management LLC | 67,009 | 6.94 | 5,576 | 10.33 | ||||
| 2025-08-06 | 13F | Aspect Partners, LLC | 460 | 0.66 | 38 | 2.78 | ||||
| 2025-05-14 | 13F | Van Hulzen Asset Management, LLC | 0 | -100.00 | 0 | |||||
| 2025-08-13 | 13F | Smith, Moore & Co. | 79,361 | 1.82 | 6,471 | 2.93 | ||||
| 2025-08-18 | 13F | Hollencrest Capital Management | 17,314 | 0.64 | 1,412 | 1.73 | ||||
| 2025-07-24 | 13F | Cyndeo Wealth Partners, LLC | 4,399 | 0.55 | 359 | 1.70 | ||||
| 2025-08-04 | 13F | Premier Path Wealth Partners, LLC | 30,585 | 1.39 | 2,494 | 2.51 | ||||
| 2025-07-18 | 13F | PFG Investments, LLC | 20,854 | -11.02 | 1,700 | -10.05 | ||||
| 2025-08-13 | 13F | Twin Peaks Wealth Advisors, LLC | 120 | 10 | ||||||
| 2025-09-04 | 13F/A | Advisor Group Holdings, Inc. | 124,250 | -1.46 | 10,151 | -0.39 | ||||
| 2025-05-12 | 13F | Sandy Spring Bank | 1,005 | 0.00 | 81 | 0.00 | ||||
| 2025-07-01 | 13F | Burkett Financial Services, Llc | 0 | -100.00 | 0 | |||||
| 2025-08-06 | 13F | Prospera Financial Services Inc | 4,667 | 381 | ||||||
| 2025-08-11 | 13F | Synergy Investment Management, LLC | 0 | -100.00 | 0 | |||||
| 2025-07-28 | 13F | Harbour Investments, Inc. | 31,072 | 27.26 | 2,533 | 28.64 | ||||
| 2025-08-06 | 13F | Moors & Cabot, Inc. | 3,372 | 0.00 | 275 | 1.11 | ||||
| 2025-07-24 | 13F | Capital Advisors, Ltd. LLC | 55,152 | -0.82 | 4 | 0.00 | ||||
| 2025-08-12 | 13F | Virtu Financial LLC | 2,563 | 0 | ||||||
| 2025-08-14 | 13F | Mercer Global Advisors Inc /adv | 11,657 | -34.40 | 950 | -33.71 | ||||
| 2025-08-15 | 13F | Tower Research Capital LLC (TRC) | 6,288 | 513 | ||||||
| 2025-07-09 | 13F | Key Client Fiduciary Advisors, LLC | 3,615 | 5.46 | 295 | 6.52 | ||||
| 2025-07-23 | 13F | Clear Creek Financial Management, LLC | 25,508 | 4.76 | 2,080 | 5.91 | ||||
| 2025-08-05 | 13F | BEAM Asset Management, LLC | 11,795 | 11.43 | 962 | 12.66 | ||||
| 2025-08-07 | 13F | Kestra Private Wealth Services, Llc | 6,086 | -0.52 | 496 | 0.61 | ||||
| 2025-07-07 | 13F | Nova Wealth Management, Inc. | 4,281 | 167.06 | 349 | 170.54 | ||||
| 2025-07-21 | 13F | DHJJ Financial Advisors, Ltd. | 798 | 0.00 | 65 | 1.56 | ||||
| 2025-07-10 | 13F | Western Pacific Wealth Management, LP | 1,040 | 85 | ||||||
| 2025-08-19 | 13F | Asset Dedication, LLC | 450 | 0.00 | 37 | 0.00 | ||||
| 2025-07-23 | 13F | Pure Portfolios Holdings Llc | 5,184 | -6.24 | 423 | -5.17 | ||||
| 2025-08-06 | 13F | Atlantic Union Bankshares Corp | 1,005 | 82 | ||||||
| 2025-08-08 | 13F | Avantax Advisory Services, Inc. | 9,303 | 1.43 | 759 | 2.57 | ||||
| 2025-08-05 | 13F | GPS Wealth Strategies Group, LLC | 3,093 | 0.03 | 252 | 1.20 | ||||
| 2025-08-04 | 13F | Flagship Harbor Advisors, Llc | 5,121 | 0.10 | 418 | 1.21 | ||||
| 2025-08-14 | 13F | Jane Street Group, Llc | 0 | -100.00 | 0 | |||||
| 2025-07-11 | 13F | Quad-Cities Investment Group, LLC | 13,104 | -2.48 | 1,068 | -1.39 | ||||
| 2025-07-17 | 13F | Jackson, Grant Investment Advisers, Inc. | 10,105 | 0.23 | 824 | 1.23 | ||||
| 2025-07-28 | 13F | Copia Wealth Management | 167 | 14 | ||||||
| 2025-08-13 | 13F | Dana Investment Advisors, Inc. | 3,675 | -34.66 | 300 | -34.00 | ||||
| 2025-08-11 | 13F | Private Advisor Group, LLC | 17,777 | -0.94 | 1,449 | 0.14 | ||||
| 2025-07-25 | 13F | Atria Wealth Solutions, Inc. | 28,440 | -34.07 | 2,378 | -31.69 | ||||
| 2025-08-14 | 13F | Benjamin Edwards Inc | 757,485 | 1,753.67 | 61,762 | 1,774.39 | ||||
| 2025-07-17 | 13F | Tempus Wealth Planning, LLC | 11,448 | -0.21 | 933 | 0.86 | ||||
| 2025-07-18 | 13F | Truist Financial Corp | 56,773 | -0.55 | 4,629 | 0.54 | ||||
| 2025-07-14 | 13F | Chapin Davis, Inc. | 2,491 | -4.52 | 203 | -3.33 | ||||
| 2025-08-05 | 13F | Bank of New York Mellon Corp | 4,639 | 378 | ||||||
| 2025-08-12 | 13F | CIBC Private Wealth Group, LLC | 446 | 36 | ||||||
| 2025-08-14 | 13F | Smartleaf Asset Management LLC | 1,027 | 84 | ||||||
| 2025-08-14 | 13F | Ausdal Financial Partners, Inc. | 0 | -100.00 | 0 | |||||
| 2025-07-08 | 13F | Atlas Brown,Inc. | 15,958 | 0.38 | 1,301 | 1.48 | ||||
| 2025-08-14 | 13F | Fmr Llc | 6,167 | -8.37 | 503 | -7.38 | ||||
| 2025-08-12 | 13F | LPL Financial LLC | 709,756 | 3.82 | 57,870 | 4.96 | ||||
| 2025-08-13 | 13F | Russell Investments Group, Ltd. | 789 | 4.23 | 64 | 4.92 | ||||
| 2025-08-14 | 13F | Core Wealth Advisors, Inc. | 12,176 | 13.83 | 993 | 15.08 | ||||
| 2025-08-14 | 13F | Headinvest, Llc | 5,992 | 0.00 | 489 | 1.04 | ||||
| 2025-07-28 | 13F | Rosenberg Matthew Hamilton | 1,071 | 13.94 | 87 | 16.00 | ||||
| 2025-08-14 | 13F | IHT Wealth Management, LLC | 3,285 | 0.12 | 268 | 1.14 | ||||
| 2025-08-06 | 13F | Commonwealth Equity Services, Llc | 259,076 | -10.63 | 21 | -8.70 | ||||
| 2025-08-12 | 13F | Jpmorgan Chase & Co | 5,737 | -4.18 | 468 | -3.11 | ||||
| 2025-07-11 | 13F | Pinnacle Bancorp, Inc. | 100 | 0.00 | 8 | 0.00 | ||||
| 2025-07-30 | 13F | Patten Group, Inc. | 5,106 | -5.81 | 416 | -4.81 | ||||
| 2025-08-08 | 13F | Flaharty Asset Management, LLC | 220 | 18 | ||||||
| 2025-08-12 | 13F | Mystic Asset Management, Inc. | 5,945 | -1.33 | 485 | -0.21 | ||||
| 2025-08-01 | 13F | Anson Capital, Inc. | 7,049 | 2.35 | 575 | 3.42 |