Mga Batayang Estadistika
| Pemilik Institusional | 158 total, 155 long only, 2 short only, 1 long/short - change of 0.00% MRQ |
| Alokasi Portofolio Rata-rata | -0.0614 % - change of 105.83% MRQ |
| Saham Institusional (Jangka Panjang) | 21,463,889 (ex 13D/G) - change of -0.55MM shares -2.51% MRQ |
| Nilai Institusional (Jangka Panjang) | $ 311,938 USD ($1000) |
Kepemilikan Institusional dan Pemegang Saham
Global X Funds - Global X Russell 2000 Covered Call ETF (US:RYLD) memiliki 158 pemilik institusional dan pemegang saham yang telah mengajukan formulir 13D/G atau 13F kepada Komisi Bursa Efek (Securities Exchange Commission/SEC). Lembaga-lembaga ini memegang total 22,022,696 saham. Pemegang saham terbesar meliputi LPL Financial LLC, Morgan Stanley, Bank Of America Corp /de/, TCG Advisory Services, LLC, Ameriprise Financial Inc, UBS Group AG, Wells Fargo & Company/mn, Raymond James Financial Inc, AlphaStar Capital Management, LLC, and Brookstone Capital Management .
Struktur kepemilikan institusional Global X Funds - Global X Russell 2000 Covered Call ETF (ARCA:RYLD) menunjukkan posisi terkini di perusahaan oleh institusi dan dana, serta perubahan terbaru dalam ukuran posisi. Pemegang saham utama dapat mencakup investor individu, reksa dana, dana lindung nilai, atau institusi. Jadwal 13D menunjukkan bahwa investor memegang (atau pernah memegang) lebih dari 5% saham perusahaan dan bermaksud (atau pernah bermaksud) untuk secara aktif mengejar perubahan strategi bisnis. Jadwal 13G menunjukkan investasi pasif lebih dari 5%.
The share price as of September 5, 2025 is 15.20 / share. Previously, on September 6, 2024, the share price was 15.82 / share. This represents a decline of 3.92% over that period.

Skor Sentimen Dana
Skor Sentimen Dana (sebelumnya dikenal sebagai Skor Akumulasi Kepemilikan) menemukan saham-saham yang paling banyak dibeli oleh dana. Ini adalah hasil dari model kuantitatif multi-faktor yang canggih yang mengidentifikasi perusahaan dengan tingkat akumulasi institusional tertinggi. Model penilaian menggunakan kombinasi dari total peningkatan pemilik yang diungkapkan, perubahan dalam alokasi portofolio pada pemilik tersebut, dan metrik lainnya. Angka berkisar dari 0 hingga 100, dengan angka yang lebih tinggi menunjukkan tingkat akumulasi yang lebih tinggi dibandingkan dengan perusahaan sejenisnya, dan 50 adalah rata-ratanya.
Frekuensi Pembaruan: Setiap Hari
Lihat Ownership Explorer, yang menyediakan daftar perusahaan dengan peringkat tertinggi.
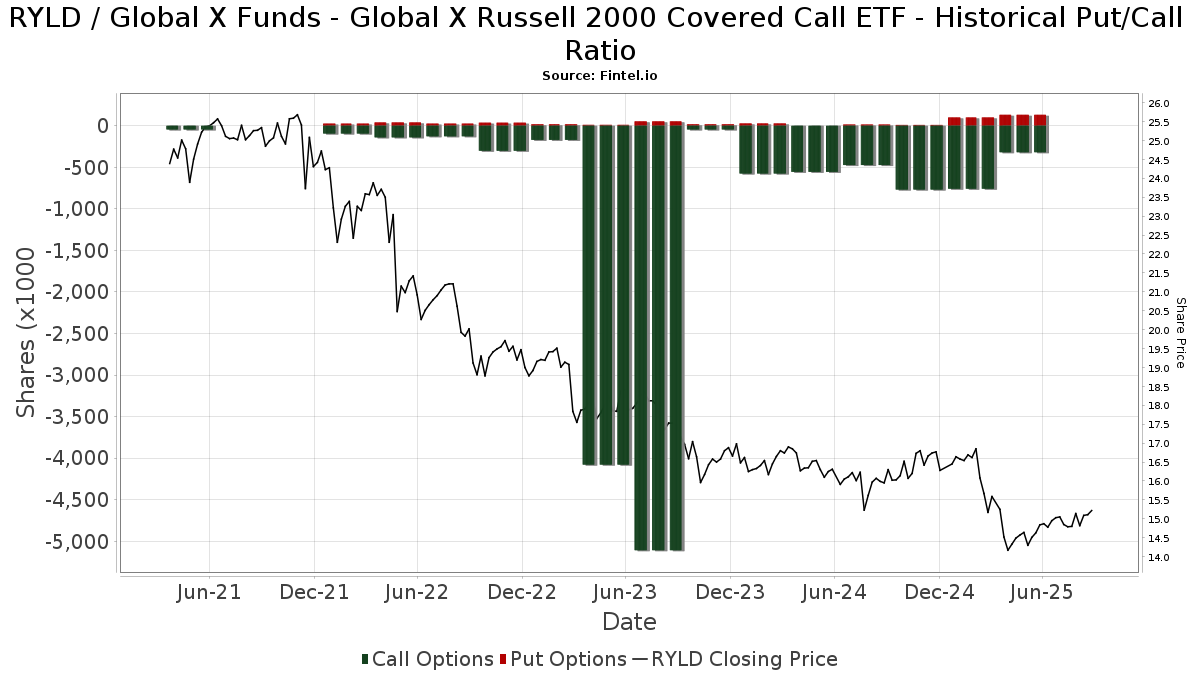
Rasio Put/Call Institusional
Selain melaporkan isu ekuitas dan utang standar, institusi dengan aset di bawah manajemen lebih dari 100 juta dolar AS juga harus mengungkapkan kepemilikan opsi put dan call mereka. Karena opsi put umumnya menunjukkan sentimen negatif, dan opsi call menunjukkan sentimen positif, kita dapat mengetahui sentimen institusional secara keseluruhan dengan memplot rasio put terhadap call. Grafik di sebelah kanan memplot rasio put/call historis untuk instrumen ini.
Menggunakan Rasio Put/Call sebagai indikator sentimen investor mengatasi salah satu kekurangan utama dari penggunaan total kepemilikan institusional, yaitu sejumlah besar aset yang dikelola diinvestasikan secara pasif untuk melacak indeks. Dana yang dikelola secara pasif biasanya tidak membeli opsi, sehingga indikator rasio put/call lebih akurat dalam melacak sentimen dana yang dikelola secara aktif.
Pengajuan 13F dan NPORT
Detail pada pengajuan 13F tersedia gratis. Detail pada pengajuan NP memerlukan keanggotaan premium. Baris berwarna hijau menunjukkan posisi baru. Baris berwarna merah menunjukkan posisi yang sudah ditutup. Klik tautan ini ikon untuk melihat riwayat transaksi selengkapnya.
Tingkatkan
untuk membuka data premium dan mengekspor ke Excel ![]() .
.
| Tanggal File | Sumber | Investor | Ketik | Presyo ng Avg (Silangan) |
Saham | Δ Saham (%) |
Dilaporkan Nilai ($1000) |
Nilai Δ (%) |
Alokasi Port (%) |
|
|---|---|---|---|---|---|---|---|---|---|---|
| 2025-08-11 | 13F | Private Advisor Group, LLC | 101,598 | 1.04 | 1,515 | -0.26 | ||||
| 2025-08-13 | 13F | Renaissance Technologies Llc | 41,100 | -82.52 | 613 | -82.76 | ||||
| 2025-07-18 | 13F | PFG Investments, LLC | 70,606 | 3.74 | 1,053 | 2.43 | ||||
| 2025-08-12 | 13F | Jpmorgan Chase & Co | 154 | -67.37 | 2 | -71.43 | ||||
| 2025-03-12 | 13F | Centaurus Financial, Inc. | 0 | -100.00 | 0 | |||||
| 2025-07-09 | 13F | Dynamic Advisor Solutions LLC | 22,090 | -40.68 | 329 | -41.46 | ||||
| 2025-08-14 | 13F/A | Rockefeller Capital Management L.P. | 73,315 | -17.91 | 1,093 | -18.92 | ||||
| 2025-08-14 | 13F | Qube Research & Technologies Ltd | 1,578 | 24 | ||||||
| 2025-08-01 | 13F | Pasadena Private Wealth, LLC | 18,200 | -8.08 | 271 | -9.06 | ||||
| 2025-08-07 | 13F | Kestra Private Wealth Services, Llc | 0 | -100.00 | 0 | -100.00 | ||||
| 2025-08-18 | 13F/A | National Bank Of Canada /fi/ | 5 | 0.00 | 0 | |||||
| 2025-07-31 | 13F | Wealthfront Advisers Llc | 21,412 | 70.68 | 319 | 68.78 | ||||
| 2025-07-25 | 13F | Concurrent Investment Advisors, LLC | 46,912 | 24.77 | 699 | 23.28 | ||||
| 2025-07-14 | 13F | Capital CS Group, LLC | 23,819 | 355 | ||||||
| 2025-08-12 | 13F | RiverFront Investment Group, LLC | 26,571 | -75.31 | 396 | -75.63 | ||||
| 2025-08-12 | 13F | Founders Financial Alliance, LLC | 8,829 | 13.57 | 132 | 11.97 | ||||
| 2025-07-31 | 13F | Cambridge Investment Research Advisors, Inc. | 139,716 | -47.10 | 2 | -33.33 | ||||
| 2025-08-14 | 13F | Mml Investors Services, Llc | 30,569 | 92.21 | 0 | |||||
| 2025-07-23 | 13F | Kingswood Wealth Advisors, Llc | 27,424 | 22.06 | 409 | 20.35 | ||||
| 2025-07-21 | 13F | DHJJ Financial Advisors, Ltd. | 79 | 0.00 | 1 | 0.00 | ||||
| 2025-08-06 | 13F | Aspect Partners, LLC | 527 | 2.93 | 8 | 0.00 | ||||
| 2025-07-31 | 13F | Ground Swell Capital, LLC | 0 | -100.00 | 0 | |||||
| 2025-08-15 | 13F | Equitable Holdings, Inc. | 28,770 | 429 | ||||||
| 2025-08-04 | 13F | Mesirow Financial Investment Management, Inc. | 139,803 | -13.42 | 2,084 | -14.52 | ||||
| 2025-08-04 | 13F | AlphaStar Capital Management, LLC | 554,027 | 27.96 | 8,261 | 26.36 | ||||
| 2025-04-17 | 13F | Good Life Advisors, LLC | 0 | -100.00 | 0 | -100.00 | ||||
| 2025-08-05 | 13F | Bank Of Montreal /can/ | 5,646 | -23.64 | 84 | -24.32 | ||||
| 2025-07-10 | 13F | Wealth Enhancement Advisory Services, Llc | 247,862 | 5.22 | 3,718 | 4.50 | ||||
| 2025-08-14 | 13F | Two Sigma Securities, Llc | 17,621 | -8.60 | 263 | -9.97 | ||||
| 2025-07-22 | 13F | MAS Advisors LLC | 27,879 | 3.95 | 416 | 2.72 | ||||
| 2025-08-14 | 13F | IHT Wealth Management, LLC | 0 | -100.00 | 0 | -100.00 | ||||
| 2025-07-28 | 13F | RFG Advisory, LLC | 97,281 | -7.49 | 1,450 | -8.63 | ||||
| 2025-08-04 | 13F | Kovack Advisors, Inc. | 33,798 | -2.71 | 504 | -4.01 | ||||
| 2025-08-08 | 13F | Cetera Investment Advisers | 367,863 | 4.04 | 5,485 | 2.74 | ||||
| 2025-07-28 | 13F | Harbour Investments, Inc. | 12,155 | -0.61 | 181 | -1.63 | ||||
| 2025-07-17 | 13F | Sound Income Strategies, LLC | 61 | 0.00 | 1 | |||||
| 2025-07-09 | 13F | Triumph Capital Management | 67,118 | 105.27 | 1,001 | 102.84 | ||||
| 2025-08-14 | 13F | Old Mission Capital Llc | 28,558 | 426 | ||||||
| 2025-08-15 | 13F | First Heartland Consultants, Inc. | 20,314 | 3.06 | 303 | 1.68 | ||||
| 2025-08-11 | 13F | Perennial Investment Advisors, LLC | 20,039 | 3.03 | 299 | 1.71 | ||||
| 2025-08-12 | 13F | Retirement Planning Co of New England, Inc. | 27,351 | 12.89 | 408 | 11.51 | ||||
| 2025-08-14 | 13F | Citadel Advisors Llc | Call | 62,900 | 222.56 | 938 | 218.71 | |||
| 2025-05-13 | 13F | SFI Advisors, LLC | 0 | -100.00 | 0 | -100.00 | ||||
| 2025-08-14 | 13F | Citadel Advisors Llc | 42,550 | 101.74 | 634 | 99.37 | ||||
| 2025-08-13 | 13F | Colonial Trust Co / SC | 3,558 | 21.77 | 53 | 18.18 | ||||
| 2025-04-22 | 13F | TrueMark Investments, LLC | 0 | -100.00 | 0 | |||||
| 2025-07-24 | 13F | IFP Advisors, Inc | 13,663 | 34.98 | 204 | 33.55 | ||||
| 2025-08-08 | 13F | SBI Securities Co., Ltd. | 45,225 | -7.18 | 674 | -8.30 | ||||
| 2025-08-12 | 13F | PSI Advisors, LLC | 0 | -100.00 | 0 | |||||
| 2025-08-13 | 13F | Baird Financial Group, Inc. | 143,828 | -36.18 | 2,144 | -36.98 | ||||
| 2025-07-24 | 13F | Us Bancorp \de\ | 1,051 | 0.00 | 16 | 0.00 | ||||
| 2025-08-14 | 13F | Citadel Advisors Llc | Put | 35,400 | 8.59 | 528 | 7.11 | |||
| 2025-08-14 | 13F | Murphy & Mullick Capital Management Corp | 5,153 | 2.08 | 77 | 0.00 | ||||
| 2025-08-05 | 13F | Simplex Trading, Llc | 5,501 | -73.74 | 0 | |||||
| 2025-08-05 | 13F | Astra Wealth Partners LLC | Put | 97,300 | 43.72 | 1,451 | 41.88 | |||
| 2025-07-14 | 13F | AdvisorNet Financial, Inc | 33 | 3.12 | 0 | |||||
| 2025-09-04 | 13F/A | Advisor Group Holdings, Inc. | 475,978 | -0.42 | 7,097 | -1.66 | ||||
| 2025-07-29 | NP | EBI - Longview Advantage ETF | 0 | -100.00 | 0 | -100.00 | ||||
| 2025-08-08 | 13F | Capital Investment Advisory Services, LLC | 1,875 | 28 | ||||||
| 2025-07-14 | 13F | Caitlin John, LLC | 12,012 | -1.49 | 179 | -2.72 | ||||
| 2025-08-13 | 13F | Northwestern Mutual Wealth Management Co | 11,328 | 1,032.80 | 169 | 1,020.00 | ||||
| 2025-08-14 | 13F | TCG Advisory Services, LLC | 1,163,591 | -1.78 | 17,349 | -3.01 | ||||
| 2025-08-13 | 13F | Luminist Capital LLC | 6,199 | -1.91 | 92 | -3.16 | ||||
| 2025-08-05 | 13F | C2P Capital Advisory Group, LLC d.b.a. Prosperity Capital Advisors | 0 | -100.00 | 0 | -100.00 | ||||
| 2025-08-08 | 13F | Foundations Investment Advisors, LLC | 26,170 | -1.76 | 390 | -2.99 | ||||
| 2025-07-10 | 13F | High Net Worth Advisory Group LLC | 87,058 | -6.32 | 1,298 | -7.48 | ||||
| 2025-08-05 | 13F | Carolinas Wealth Consulting Llc | 0 | -100.00 | 0 | -100.00 | ||||
| 2025-07-11 | 13F | Farther Finance Advisors, LLC | 2,302 | 34 | ||||||
| 2025-07-01 | 13F | Private Client Services, Llc | 13,548 | 8.45 | 202 | 7.45 | ||||
| 2025-07-09 | 13F | Sandbox Financial Partners, LLC | 40,006 | 19.54 | 596 | 18.02 | ||||
| 2025-08-11 | 13F | HighTower Advisors, LLC | Call | 220,000 | -69.16 | 33 | -70.09 | |||
| 2025-08-06 | 13F | Wedbush Securities Inc | 31,745 | 3.59 | 0 | |||||
| 2025-08-18 | 13F | Wolverine Trading, Llc | Call | 17,700 | 263 | |||||
| 2025-05-02 | 13F | Kingsview Wealth Management, LLC | 0 | -100.00 | 0 | |||||
| 2025-07-29 | 13F | Koshinski Asset Management, Inc. | 56,360 | 0.40 | 840 | -0.83 | ||||
| 2025-04-30 | 13F | Axxcess Wealth Management, Llc | 0 | -100.00 | 0 | |||||
| 2025-08-12 | 13F | Proequities, Inc. | 0 | 0 | ||||||
| 2025-08-14 | 13F | Comerica Bank | 9,733 | 66.63 | 145 | 64.77 | ||||
| 2025-07-17 | 13F | Camelot Portfolios, LLC | 0 | -100.00 | 0 | |||||
| 2025-08-15 | 13F | Prevail Innovative Wealth Advisors, Llc | 0 | -100.00 | 0 | -100.00 | ||||
| 2025-08-14 | 13F | Ameriprise Financial Inc | 923,028 | 12.14 | 13,819 | 11.16 | ||||
| 2025-08-11 | 13F | Western Wealth Management, LLC | 10,892 | 0.00 | 162 | -1.22 | ||||
| 2025-08-04 | 13F | Flagship Harbor Advisors, Llc | 12,643 | -6.28 | 189 | -7.39 | ||||
| 2025-07-18 | 13F | Trilogy Capital Inc. | 29,641 | 0.72 | 442 | -0.68 | ||||
| 2025-08-11 | 13F | Rothschild Investment Llc | 2,675 | 0.00 | 40 | -2.50 | ||||
| 2025-07-30 | 13F | Blume Capital Management, Inc. | 15 | 0 | ||||||
| 2025-07-18 | 13F | Truist Financial Corp | 0 | -100.00 | 0 | |||||
| 2025-07-23 | 13F | Abel Hall, LLC | 49,000 | 68.97 | 731 | 67.05 | ||||
| 2025-07-30 | 13F | Brookstone Capital Management | 527,237 | 3.34 | 7,861 | 2.05 | ||||
| 2025-08-14 | 13F | Group One Trading, L.p. | 3,495 | -95.18 | 52 | -95.25 | ||||
| 2025-07-21 | 13F | Patriot Financial Group Insurance Agency, LLC | 15,112 | -7.25 | 225 | -8.54 | ||||
| 2025-07-31 | 13F | Whipplewood Advisors, LLC | 1,053 | -95.63 | 16 | 0.00 | ||||
| 2025-08-08 | 13F | Thrive Capital Management, LLC | 223,632 | 3,334 | ||||||
| 2025-08-14 | 13F | Wells Fargo & Company/mn | 784,172 | 2.33 | 11,692 | 1.04 | ||||
| 2025-08-12 | 13F | NWF Advisory Services Inc. | 102,536 | 1,548 | ||||||
| 2025-08-19 | 13F | Asset Dedication, LLC | 0 | -100.00 | 0 | -100.00 | ||||
| 2025-07-17 | 13F | Janney Montgomery Scott LLC | 246,266 | 0.60 | 4 | 0.00 | ||||
| 2025-07-17 | 13F | XML Financial, LLC | 15,000 | 15.38 | 224 | 13.78 | ||||
| 2025-07-09 | 13F | Lifestyle Asset Management, Inc. | 0 | -100.00 | 0 | |||||
| 2025-08-05 | 13F | Westside Investment Management, Inc. | 0 | -100.00 | 0 | -100.00 | ||||
| 2025-08-15 | 13F | Morgan Stanley | 2,351,967 | -14.42 | 35,068 | -15.50 | ||||
| 2025-08-04 | 13F | MeadowBrook Investment Advisors LLC | 3,398 | 0.00 | 51 | -1.96 | ||||
| 2025-08-14 | 13F | Jane Street Group, Llc | Call | 19,000 | -26.36 | 283 | -27.25 | |||
| 2025-08-14 | 13F | UBS Group AG | 906,629 | -2.22 | 13,518 | -3.46 | ||||
| 2025-07-21 | 13F | Credential Qtrade Securities Inc. | 0 | -100.00 | 0 | -100.00 | ||||
| 2025-08-12 | 13F | Howe & Rusling Inc | 9,860 | -15.88 | 147 | -16.48 | ||||
| 2025-07-10 | 13F | Atticus Wealth Management, Llc | 3,012 | 3.04 | 45 | 0.00 | ||||
| 2025-07-14 | 13F | Palacios Wealth Management, LLC | 243,075 | -2.73 | 3,624 | -3.95 | ||||
| 2025-08-05 | 13F | Sigma Planning Corp | 26,260 | -15.14 | 392 | -16.27 | ||||
| 2025-07-18 | 13F | Institute for Wealth Management, LLC. | 155,872 | -1.60 | 2,324 | -2.80 | ||||
| 2025-08-12 | 13F | AlphaCore Capital LLC | 2,094 | 91.41 | 31 | 93.75 | ||||
| 2025-08-15 | 13F | Tower Research Capital LLC (TRC) | 670 | 10 | ||||||
| 2025-07-22 | 13F | Accel Wealth Management | 21,044 | -3.80 | 314 | -5.15 | ||||
| 2025-07-31 | 13F | Oppenheimer & Co Inc | 21,160 | 25.14 | 315 | 23.53 | ||||
| 2025-08-19 | 13F | National Asset Management, Inc. | 15,833 | 236 | ||||||
| 2025-07-24 | 13F | Ulland Investment Advisors, LLC | 14,000 | 0 | ||||||
| 2025-07-23 | 13F | Castle Rock Wealth Management, LLC | 13,206 | -14.38 | 195 | -16.38 | ||||
| 2025-04-14 | 13F | NewSquare Capital LLC | 0 | -100.00 | 0 | |||||
| 2025-08-14 | 13F | Great Valley Advisor Group, Inc. | 13,736 | 20.47 | 205 | 18.60 | ||||
| 2025-08-19 | 13F | Newbridge Financial Services Group, Inc. | 143,028 | -27.57 | 2,133 | -28.48 | ||||
| 2025-07-16 | 13F | Formidable Asset Management, LLC | 128,506 | 0.00 | 1,940 | 0.00 | ||||
| 2025-08-12 | 13F | BlackRock, Inc. | 3,227 | 156.72 | 48 | 166.67 | ||||
| 2025-07-30 | 13F | D.a. Davidson & Co. | 11,838 | 17.46 | 177 | 15.79 | ||||
| 2025-08-14 | 13F | Raymond James Financial Inc | 572,329 | -21.47 | 8,533 | -22.46 | ||||
| 2025-08-14 | 13F | Jane Street Group, Llc | 200,247 | 35.19 | 2,986 | 33.50 | ||||
| 2025-07-21 | 13F | Ameritas Advisory Services, LLC | 35,623 | 4.88 | 531 | -3.80 | ||||
| 2025-08-14 | 13F | Banque Transatlantique SA | 0 | -100.00 | 0 | |||||
| 2025-08-14 | 13F | Hrt Financial Lp | 16,250 | -62.20 | 0 | |||||
| 2025-08-14 | 13F | Stifel Financial Corp | 83,894 | 32.94 | 1,251 | 31.30 | ||||
| 2025-07-29 | 13F | Stratos Wealth Partners, LTD. | 135,570 | 1,007.69 | 2,021 | 998.37 | ||||
| 2025-07-16 | 13F | Investment Partners Asset Management, Inc. | 67,447 | -0.17 | 1,006 | -1.47 | ||||
| 2025-07-21 | 13F | Ameriflex Group, Inc. | 0 | -100.00 | 0 | |||||
| 2025-07-29 | 13F | Chicago Partners Investment Group LLC | 45,502 | 5.26 | 676 | 7.31 | ||||
| 2025-07-29 | 13F | International Assets Investment Management, Llc | 245,487 | 26.96 | 3,656 | 25.25 | ||||
| 2025-08-14 | 13F | Bank Of America Corp /de/ | 2,107,785 | 3.95 | 31,427 | 2.65 | ||||
| 2025-08-13 | 13F/A | StoneX Group Inc. | 0 | -100.00 | 0 | -100.00 | ||||
| 2025-08-13 | 13F | Garner Asset Management Corp | 40,912 | -15.32 | 610 | -16.46 | ||||
| 2025-08-12 | 13F | SRS Capital Advisors, Inc. | 16,981 | 3.03 | 253 | 2.02 | ||||
| 2025-04-23 | 13F | Bessemer Group Inc | 0 | -100.00 | 0 | |||||
| 2025-08-12 | 13F | Change Path, LLC | 68,202 | 26.06 | 1,017 | 24.51 | ||||
| 2025-08-08 | 13F | Gts Securities Llc | 0 | -100.00 | 0 | -100.00 | ||||
| 2025-08-14 | 13F | Wiley Bros.-aintree Capital, Llc | 17,776 | 12.82 | 265 | 11.34 | ||||
| 2025-08-06 | 13F | AE Wealth Management LLC | 3,125 | 0.64 | 47 | 0.00 | ||||
| 2025-08-11 | 13F | Nations Financial Group Inc, /ia/ /adv | 0 | -100.00 | 0 | -100.00 | ||||
| 2025-08-14 | 13F | Mariner, LLC | 17,263 | 0.61 | 257 | -0.77 | ||||
| 2025-08-11 | 13F | Regal Investment Advisors LLC | 0 | -100.00 | 0 | -100.00 | ||||
| 2025-08-11 | 13F | Anfield Capital Management, LLC | 3,397 | 0.00 | 51 | -1.96 | ||||
| 2025-08-01 | 13F | Brookwood Investment Group LLC | 14,101 | 210 | ||||||
| 2025-07-17 | 13F | Venture Visionary Partners LLC | 256,699 | 1.20 | 3,827 | -0.08 | ||||
| 2025-08-08 | 13F | Hartland & Co., LLC | 20,282 | 63.87 | 302 | 62.37 | ||||
| 2025-08-15 | 13F | Kestra Advisory Services, LLC | 284,562 | -2.78 | 4,243 | -4.01 | ||||
| 2025-08-06 | 13F | ETF Store, Inc. | 10,216 | 2.00 | 152 | 0.66 | ||||
| 2025-08-14 | 13F | Fmr Llc | 1,330 | 164.94 | 20 | 171.43 | ||||
| 2025-04-25 | 13F | Colonial River Wealth Management, LLC | 0 | -100.00 | 0 | |||||
| 2025-05-15 | 13F | Talon Private Wealth, LLC | 0 | -100.00 | 0 | -100.00 | ||||
| 2025-07-15 | 13F | World Equity Group, Inc. | 10,322 | -6.87 | 154 | -10.00 | ||||
| 2025-08-12 | 13F | Archer Investment Corp | 200 | 0.00 | 3 | -33.33 | ||||
| 2025-08-12 | 13F | CIBC Private Wealth Group, LLC | 5,633 | 84 | ||||||
| 2025-04-29 | NP | ORR - Militia Long/Short Equity ETF | Short | -558,807 | -8,969 | |||||
| 2025-08-12 | 13F | Steward Partners Investment Advisory, Llc | 2,800 | -16.72 | 42 | -18.00 | ||||
| 2025-07-24 | 13F | Comprehensive Money Management Services LLC | 41,704 | -12.58 | 622 | -13.75 | ||||
| 2025-08-11 | 13F | Independent Advisor Alliance | 142,306 | 248.77 | 2,122 | 244.32 | ||||
| 2025-08-12 | 13F | Leigh Baldwin & Co., Llc | 0 | -100.00 | 0 | -100.00 | ||||
| 2025-08-06 | 13F | Commonwealth Equity Services, Llc | 56,076 | 5.57 | 1 | |||||
| 2025-08-29 | NP | OneAscent Capital Opportunities Fund | 45,000 | 80.00 | 671 | 77.72 | ||||
| 2025-08-14 | 13F | Smartleaf Asset Management LLC | 145 | -79.14 | 2 | -80.00 | ||||
| 2025-07-08 | 13F | Nbc Securities, Inc. | 3,425 | -35.80 | 0 | |||||
| 2025-08-13 | 13F | Beacon Pointe Advisors, LLC | 14,790 | -23.37 | 221 | -24.40 | ||||
| 2025-07-29 | 13F | Private Trust Co Na | 1,904 | -37.35 | 28 | -37.78 | ||||
| 2025-08-08 | 13F | Avantax Advisory Services, Inc. | 146,111 | 392.65 | 2,179 | 387.25 | ||||
| 2025-07-22 | 13F | Valeo Financial Advisors, LLC | 22,552 | -19.95 | 336 | -20.94 | ||||
| 2025-08-12 | 13F | J.w. Cole Advisors, Inc. | 128,014 | 33.72 | 1,909 | 32.04 | ||||
| 2025-07-08 | 13F/A | Salem Investment Counselors Inc | 300 | -40.00 | 4 | -42.86 | ||||
| 2025-08-04 | 13F | Spire Wealth Management | 2,026 | 0.00 | 30 | 0.00 | ||||
| 2025-08-12 | 13F | Winnow Wealth Llc | 0 | -100.00 | 0 | -100.00 | ||||
| 2025-07-23 | 13F | Foresight Capital Management Advisors, Inc. | 132,315 | 1,973 | ||||||
| 2025-07-25 | 13F | Cwm, Llc | 1,942 | 0.05 | 0 | |||||
| 2025-08-05 | 13F | Atlas Private Wealth Advisors | 232,901 | -9.36 | 3,473 | -10.49 | ||||
| 2025-08-14 | 13F | GWM Advisors LLC | 173,573 | 2.42 | 2,588 | 1.13 | ||||
| 2025-05-14 | 13F | Brown Brothers Harriman & Co | 0 | -100.00 | 0 | |||||
| 2025-08-08 | 13F | Emerald Investment Partners, Llc | 9,901 | 148 | ||||||
| 2025-08-13 | 13F | Capital Analysts, Inc. | 651 | 0 | ||||||
| 2025-08-13 | 13F | Level Four Advisory Services, Llc | 11,176 | 4.28 | 167 | 3.11 | ||||
| 2025-08-14 | 13F | Federation des caisses Desjardins du Quebec | 1,333 | 0.00 | 20 | -5.00 | ||||
| 2025-08-12 | 13F | LPL Financial LLC | 3,139,151 | 4.69 | 46,805 | 3.37 | ||||
| 2025-08-14 | 13F | Royal Bank Of Canada | 462,121 | -39.94 | 6,890 | -40.70 | ||||
| 2025-08-13 | 13F | Stablepoint Partners, LLC | 10,384 | 155 | ||||||
| 2025-05-01 | 13F | ADG Wealth Management Group, LLC | 0 | -100.00 | 0 | |||||
| 2025-08-08 | 13F | Larson Financial Group LLC | 1 | 0.00 | 0 | |||||
| 2025-08-14 | 13F | Susquehanna International Group, Llp | 120,870 | -62.37 | 1,802 | -62.85 | ||||
| 2025-07-25 | 13F | Atria Wealth Solutions, Inc. | 49,517 | -27.99 | 738 | -28.90 | ||||
| 2025-08-07 | 13F | Allworth Financial LP | 21 | 61.54 | 0 | |||||
| 2025-08-13 | 13F | Solutions 4 Wealth, Ltd | 56,723 | -12.72 | 846 | -13.86 | ||||
| 2025-05-29 | NP | MCTOX - Modern Capital Tactical Opportunities Fund Class A Shares | 50,000 | 756 | ||||||
| 2025-04-28 | 13F | Strategic Financial Concepts, LLC | 0 | -100.00 | 0 | -100.00 | ||||
| 2025-08-01 | 13F | Envestnet Asset Management Inc | 425,943 | 22.68 | 6,351 | 21.14 | ||||
| 2025-08-15 | 13F | CI Private Wealth, LLC | 113,149 | 1,687 |