Mga Batayang Estadistika
| Pemilik Institusional | 205 total, 199 long only, 2 short only, 4 long/short - change of 3.52% MRQ |
| Alokasi Portofolio Rata-rata | 0.1263 % - change of -13.37% MRQ |
| Saham Institusional (Jangka Panjang) | 17,924,484 (ex 13D/G) - change of -1.25MM shares -6.52% MRQ |
| Nilai Institusional (Jangka Panjang) | $ 621,378 USD ($1000) |
Kepemilikan Institusional dan Pemegang Saham
Global X Funds - Global X Copper Miners ETF (US:COPX) memiliki 205 pemilik institusional dan pemegang saham yang telah mengajukan formulir 13D/G atau 13F kepada Komisi Bursa Efek (Securities Exchange Commission/SEC). Lembaga-lembaga ini memegang total 17,956,504 saham. Pemegang saham terbesar meliputi MIRAE ASSET GLOBAL ETFS HOLDINGS Ltd., Price T Rowe Associates Inc /md/, PRAFX - T. Rowe Price Real Assets Fund, Inc., Invesco Ltd., VSCAX - Invesco Small Cap Value Fund Class A, Jpmorgan Chase & Co, Morgan Stanley, Bank Of America Corp /de/, Fielder Capital Group LLC, and LPL Financial LLC .
Struktur kepemilikan institusional Global X Funds - Global X Copper Miners ETF (ARCA:COPX) menunjukkan posisi terkini di perusahaan oleh institusi dan dana, serta perubahan terbaru dalam ukuran posisi. Pemegang saham utama dapat mencakup investor individu, reksa dana, dana lindung nilai, atau institusi. Jadwal 13D menunjukkan bahwa investor memegang (atau pernah memegang) lebih dari 5% saham perusahaan dan bermaksud (atau pernah bermaksud) untuk secara aktif mengejar perubahan strategi bisnis. Jadwal 13G menunjukkan investasi pasif lebih dari 5%.
The share price as of September 5, 2025 is 51.06 / share. Previously, on September 9, 2024, the share price was 39.14 / share. This represents an increase of 30.45% over that period.

Skor Sentimen Dana
Skor Sentimen Dana (sebelumnya dikenal sebagai Skor Akumulasi Kepemilikan) menemukan saham-saham yang paling banyak dibeli oleh dana. Ini adalah hasil dari model kuantitatif multi-faktor yang canggih yang mengidentifikasi perusahaan dengan tingkat akumulasi institusional tertinggi. Model penilaian menggunakan kombinasi dari total peningkatan pemilik yang diungkapkan, perubahan dalam alokasi portofolio pada pemilik tersebut, dan metrik lainnya. Angka berkisar dari 0 hingga 100, dengan angka yang lebih tinggi menunjukkan tingkat akumulasi yang lebih tinggi dibandingkan dengan perusahaan sejenisnya, dan 50 adalah rata-ratanya.
Frekuensi Pembaruan: Setiap Hari
Lihat Ownership Explorer, yang menyediakan daftar perusahaan dengan peringkat tertinggi.
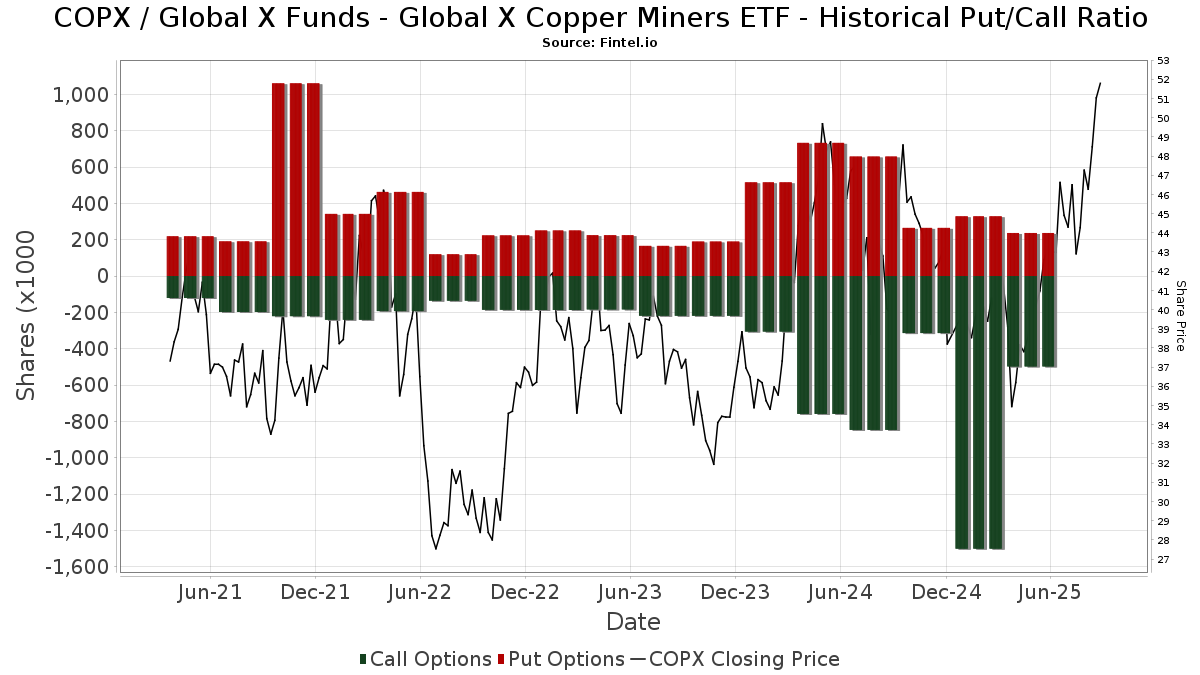
Rasio Put/Call Institusional
Selain melaporkan isu ekuitas dan utang standar, institusi dengan aset di bawah manajemen lebih dari 100 juta dolar AS juga harus mengungkapkan kepemilikan opsi put dan call mereka. Karena opsi put umumnya menunjukkan sentimen negatif, dan opsi call menunjukkan sentimen positif, kita dapat mengetahui sentimen institusional secara keseluruhan dengan memplot rasio put terhadap call. Grafik di sebelah kanan memplot rasio put/call historis untuk instrumen ini.
Menggunakan Rasio Put/Call sebagai indikator sentimen investor mengatasi salah satu kekurangan utama dari penggunaan total kepemilikan institusional, yaitu sejumlah besar aset yang dikelola diinvestasikan secara pasif untuk melacak indeks. Dana yang dikelola secara pasif biasanya tidak membeli opsi, sehingga indikator rasio put/call lebih akurat dalam melacak sentimen dana yang dikelola secara aktif.
Pengajuan 13F dan NPORT
Detail pada pengajuan 13F tersedia gratis. Detail pada pengajuan NP memerlukan keanggotaan premium. Baris berwarna hijau menunjukkan posisi baru. Baris berwarna merah menunjukkan posisi yang sudah ditutup. Klik tautan ini ikon untuk melihat riwayat transaksi selengkapnya.
Tingkatkan
untuk membuka data premium dan mengekspor ke Excel ![]() .
.
| Tanggal File | Sumber | Investor | Ketik | Presyo ng Avg (Silangan) |
Saham | Δ Saham (%) |
Dilaporkan Nilai ($1000) |
Nilai Δ (%) |
Alokasi Port (%) |
|
|---|---|---|---|---|---|---|---|---|---|---|
| 2025-08-01 | 13F | Advisory Alpha, LLC | 9,475 | -0.28 | 426 | 14.82 | ||||
| 2025-08-12 | 13F | Jpmorgan Chase & Co | 759,883 | 770.45 | 34,195 | 902.76 | ||||
| 2025-07-18 | 13F | Truist Financial Corp | 15,814 | 18.13 | 712 | 35.95 | ||||
| 2025-08-11 | 13F | Private Advisor Group, LLC | 40,736 | -6.67 | 1,833 | 7.51 | ||||
| 2025-07-31 | 13F | Cambridge Investment Research Advisors, Inc. | 22,341 | 4.75 | 1 | |||||
| 2025-08-11 | 13F | TD Waterhouse Canada Inc. | 201 | 9 | ||||||
| 2025-08-14 | 13F | Boothbay Fund Management, Llc | 0 | -100.00 | 0 | |||||
| 2025-08-14 | 13F | Aqr Capital Management Llc | 4,900 | 220 | ||||||
| 2025-08-12 | 13F | Picton Mahoney Asset Management | 3,600 | 0.00 | 0 | |||||
| 2025-08-13 | 13F | Invesco Ltd. | 1,312,149 | 3.14 | 59,047 | 18.80 | ||||
| 2025-08-26 | NP | PRAFX - T. Rowe Price Real Assets Fund, Inc. This fund is a listed as child fund of Price T Rowe Associates Inc /md/ and if that institution has disclosed ownership in this security, then these positions will not be double counted when calculating total shares and total value | 1,384,481 | 0.00 | 62,302 | 15.18 | ||||
| 2025-08-14 | 13F | Millennium Management Llc | 22,271 | 78.14 | 1,002 | 105.33 | ||||
| 2025-05-09 | 13F | GeoWealth Management, LLC | 0 | -100.00 | 0 | |||||
| 2025-08-13 | 13F | Bank Of Nova Scotia | 0 | -100.00 | 0 | |||||
| 2025-08-14 | 13F/A | Barclays Plc | 51,906 | -5.47 | 2 | 0.00 | ||||
| 2025-08-14 | 13F | Qube Research & Technologies Ltd | 41,357 | 3,105.97 | 1,861 | 3,622.00 | ||||
| 2025-08-14 | 13F | Citadel Advisors Llc | Put | 113,800 | -19.46 | 5,121 | -7.23 | |||
| 2025-08-14 | 13F | Marathon Capital Management | 6,594 | 6.63 | 297 | 22.82 | ||||
| 2025-08-14 | 13F | Citadel Advisors Llc | Call | 180,700 | 181.46 | 8,132 | 224.20 | |||
| 2025-08-14 | 13F | Citadel Advisors Llc | 17,742 | -87.48 | 798 | -85.59 | ||||
| 2025-07-16 | 13F | ORG Partners LLC | 1,105 | 4,320.00 | 50 | |||||
| 2025-07-30 | 13F | Birch Hill Investment Advisors LLC | 29,020 | -0.75 | 1,306 | 14.27 | ||||
| 2025-07-22 | 13F | Valley National Advisers Inc | 2,664 | 0.00 | 0 | |||||
| 2025-08-18 | 13F/A | National Bank Of Canada /fi/ | 8,576 | 26.40 | 386 | 45.28 | ||||
| 2025-07-28 | 13F | J.Safra Asset Management Corp | 3,858 | 0.00 | 173 | 15.33 | ||||
| 2025-05-02 | 13F | Wealthfront Advisers Llc | 0 | -100.00 | 0 | -100.00 | ||||
| 2025-07-15 | 13F | SJS Investment Consulting Inc. | 140 | 0.00 | 6 | 20.00 | ||||
| 2025-08-29 | NP | HSZAX - Highland Small-Cap Equity Fund Class A | Short | -1,650 | -0.00 | -74 | 15.63 | |||
| 2025-07-03 | 13F | Garde Capital, Inc. | 9,489 | 7.29 | 427 | 23.77 | ||||
| 2025-07-21 | 13F | Ameriflex Group, Inc. | 3,046 | 0.00 | 139 | 16.95 | ||||
| 2025-07-10 | 13F | Kozak & Associates, Inc. | 8 | 0.00 | 0 | |||||
| 2025-08-14 | 13F | Old Mission Capital Llc | 0 | -100.00 | 0 | |||||
| 2025-08-12 | 13F | Pathstone Holdings, LLC | 5,702 | 0.00 | 257 | 15.32 | ||||
| 2025-08-15 | 13F/A | Symphony Financial, Ltd. Co. | 39,178 | 1,826 | ||||||
| 2025-07-29 | 13F | Stephens Inc /ar/ | 5,590 | -9.47 | 252 | 4.15 | ||||
| 2025-08-14 | 13F | Mml Investors Services, Llc | 24,395 | -1.13 | 1 | |||||
| 2025-07-31 | 13F | WFA Asset Management Corp | 544 | 25 | ||||||
| 2025-08-08 | 13F | Compass Financial Services Inc | 20 | 0.00 | 1 | |||||
| 2025-04-22 | 13F | Bright Futures Wealth Management, LLC. | 24,676 | -6.06 | 896 | -11.46 | ||||
| 2025-08-01 | 13F | Mizuho Markets Americas Llc | 19,934 | -61.78 | 897 | -55.96 | ||||
| 2025-08-12 | 13F | Park Square Financial Group, LLC | 99 | 30.26 | 4 | 100.00 | ||||
| 2025-08-12 | 13F | Proequities, Inc. | 0 | 0 | ||||||
| 2025-08-07 | 13F | Rathbone Brothers plc | 18,494 | -0.15 | 832 | 15.08 | ||||
| 2025-08-08 | 13F | SBI Securities Co., Ltd. | 473 | -3.27 | 21 | 10.53 | ||||
| 2025-08-14 | 13F | BTG Pactual Asset Management US LLC | 23,188 | 1,043 | ||||||
| 2025-05-13 | 13F | Hartland & Co., LLC | 0 | -100.00 | 0 | |||||
| 2025-07-17 | 13F | Sound Income Strategies, LLC | 22 | 0.00 | 1 | |||||
| 2025-08-04 | 13F | Quaker Wealth Management, LLC | Put | 0 | -100.00 | 0 | -100.00 | |||
| 2025-05-09 | 13F | Blair William & Co/il | 0 | -100.00 | 0 | -100.00 | ||||
| 2025-07-16 | 13F | Signaturefd, Llc | 76 | -39.20 | 3 | -25.00 | ||||
| 2025-08-08 | 13F | Cetera Investment Advisers | 24,141 | -2.32 | 1,086 | 12.54 | ||||
| 2025-08-05 | 13F | Tsfg, Llc | 200 | 0.00 | 0 | |||||
| 2025-07-30 | 13F | Denali Advisors Llc | 16,031 | -0.91 | 721 | 14.08 | ||||
| 2025-05-08 | 13F | Geneos Wealth Management Inc. | 0 | -100.00 | 0 | |||||
| 2025-07-24 | 13F | IFP Advisors, Inc | 450 | 350.00 | 20 | 566.67 | ||||
| 2025-08-14 | 13F | Financial Advisory Service, Inc. | 53 | 15.22 | 2 | 100.00 | ||||
| 2025-05-08 | 13F | Us Bancorp \de\ | 0 | -100.00 | 0 | |||||
| 2025-08-14 | 13F/A | Rockefeller Capital Management L.P. | 184,126 | 6.24 | 8,286 | 22.36 | ||||
| 2025-08-14 | 13F | D. E. Shaw & Co., Inc. | 38,166 | 608.75 | 1,717 | 717.62 | ||||
| 2025-07-10 | 13F | Wealth Enhancement Advisory Services, Llc | 46,617 | 2.99 | 2,166 | 22.45 | ||||
| 2025-07-17 | 13F | DiNuzzo Private Wealth, Inc. | 77 | 0.00 | 3 | 0.00 | ||||
| 2025-08-13 | 13F | Dynamic Wealth Strategies, LLC | 38,941 | 47.48 | 1,752 | 69.93 | ||||
| 2025-08-14 | 13F | Operose Advisors LLC | 107 | 5 | ||||||
| 2025-05-07 | 13F | Inspire Advisors, LLC | 0 | -100.00 | 0 | |||||
| 2025-09-04 | 13F/A | Advisor Group Holdings, Inc. | 46,089 | 26.89 | 2,012 | 41.72 | ||||
| 2025-08-14 | 13F | Wells Fargo & Company/mn | 227,736 | -3.28 | 10,248 | 11.40 | ||||
| 2025-04-28 | 13F | Buffington Mohr McNeal | 0 | -100.00 | 0 | |||||
| 2025-08-14 | 13F | Clark Capital Management Group, Inc. | 100,260 | -0.89 | 4,512 | 14.14 | ||||
| 2025-07-24 | 13F | Robertson Stephens Wealth Management, LLC | 7,850 | 0.00 | 355 | 16.01 | ||||
| 2025-08-13 | 13F | Northwestern Mutual Wealth Management Co | 57,407 | 9.75 | 2,583 | 26.43 | ||||
| 2025-08-13 | 13F | Capital Fund Management S.a. | 74,224 | -8.39 | 3,340 | 5.53 | ||||
| 2025-08-12 | 13F | Tocqueville Asset Management L.p. | 6,450 | 290 | ||||||
| 2025-08-06 | 13F | First Horizon Advisors, Inc. | 154 | 7 | ||||||
| 2025-08-14 | 13F | Snowden Capital Advisors LLC | 6,178 | 279 | ||||||
| 2025-08-08 | 13F | Capital Investment Advisory Services, LLC | 300 | 0.00 | 14 | 18.18 | ||||
| 2025-08-19 | 13F | National Asset Management, Inc. | 0 | -100.00 | 0 | |||||
| 2025-08-14 | 13F | Jane Street Group, Llc | 0 | -100.00 | 0 | |||||
| 2025-07-29 | 13F | Angeles Wealth Management, Llc | 0 | -100.00 | 0 | |||||
| 2025-08-14 | 13F | CIBC World Markets Inc. | 38,266 | -16.96 | 1,722 | -4.39 | ||||
| 2025-08-13 | 13F | Continuum Advisory, LLC | 0 | -100.00 | 0 | |||||
| 2025-07-28 | 13F | Harbour Investments, Inc. | 531 | -7.17 | 24 | 4.55 | ||||
| 2025-07-11 | 13F | Farther Finance Advisors, LLC | 3,507 | 158 | ||||||
| 2025-07-31 | 13F | 180 Wealth Advisors, Llc | 19,789 | 20.61 | 891 | 38.85 | ||||
| 2025-07-28 | 13F | Pettinga Financial Advisors, LLC | 26,350 | 22.08 | 1,186 | 40.57 | ||||
| 2025-07-14 | 13F | AdvisorNet Financial, Inc | 262 | 0.00 | 12 | 10.00 | ||||
| 2025-08-05 | 13F | Bank Of Montreal /can/ | 11,174 | -83.97 | 503 | -81.56 | ||||
| 2025-08-13 | 13F | IAG Wealth Partners, LLC | 310 | 0.00 | 14 | 8.33 | ||||
| 2025-08-14 | 13F | Millennium Management Llc | Call | 0 | -100.00 | 0 | -100.00 | |||
| 2025-08-14 | 13F | Comerica Bank | 3,472 | 0.00 | 156 | 15.56 | ||||
| 2025-07-14 | 13F | Sowell Financial Services LLC | 8,106 | 0.00 | 365 | 15.19 | ||||
| 2025-08-06 | 13F | Pekin Hardy Strauss, Inc. | 9,845 | -14.17 | 443 | -1.12 | ||||
| 2025-05-12 | 13F | Basso Capital Management, L.p. | 0 | -100.00 | 0 | |||||
| 2025-08-11 | 13F | GKV Capital Management Co., Inc. | 0 | -100.00 | 0 | -100.00 | ||||
| 2025-04-15 | 13F | Ibex Wealth Advisors | 0 | -100.00 | 0 | |||||
| 2025-08-14 | 13F | Cohen & Steers, Inc. | 0 | -100.00 | 0 | |||||
| 2025-08-14 | 13F | MIRAE ASSET GLOBAL ETFS HOLDINGS Ltd. | 4,193,338 | 9.75 | 188,323 | 23.19 | ||||
| 2025-08-11 | 13F | HighTower Advisors, LLC | 6,746 | -33.17 | 304 | -23.10 | ||||
| 2025-08-14 | 13F | Great Valley Advisor Group, Inc. | 4,478 | 202 | ||||||
| 2025-08-13 | 13F | Scotia Capital Inc. | 11,266 | 3.30 | 507 | 18.78 | ||||
| 2025-08-11 | 13F | Sprott Inc. | 12,435 | 560 | ||||||
| 2025-08-14 | 13F | Raymond James Financial Inc | 71,656 | 11.10 | 3,225 | 27.99 | ||||
| 2025-08-05 | 13F | Huntington National Bank | 0 | |||||||
| 2025-08-12 | 13F | MAI Capital Management | 100 | 0.00 | 4 | 33.33 | ||||
| 2025-08-06 | 13F | AE Wealth Management LLC | 441 | 8.62 | 20 | 26.67 | ||||
| 2025-08-14 | 13F | Ameriprise Financial Inc | 255,960 | 13.07 | 11,519 | 30.23 | ||||
| 2025-08-14 | 13F | Bluefin Capital Management, Llc | 7,134 | 321 | ||||||
| 2025-08-11 | 13F | Citigroup Inc | 14,578 | -66.83 | 656 | -61.79 | ||||
| 2025-06-30 | NP | VSCAX - Invesco Small Cap Value Fund Class A | 1,312,149 | 3.14 | 49,612 | 2.14 | ||||
| 2025-07-17 | 13F | BFI Infinity Ltd. | 5,605 | 0.00 | 252 | 15.60 | ||||
| 2025-08-13 | 13F | Quadrature Capital Ltd | 0 | -100.00 | 0 | |||||
| 2025-08-01 | 13F | Bessemer Group Inc | 0 | -100.00 | 0 | |||||
| 2025-08-07 | 13F | Proficio Capital Partners LLC | 33,050 | 1,487 | ||||||
| 2025-05-29 | NP | Cohen & Steers Closed-end Opportunity Fund, Inc. | 13,000 | 0.00 | 508 | 2.22 | ||||
| 2025-08-06 | 13F | Black Swift Group, LLC | 52,475 | 107.00 | 2,361 | 138.48 | ||||
| 2025-07-28 | 13F | Smart Portfolios, LLC | 16,577 | -2.86 | 746 | 11.86 | ||||
| 2025-08-12 | 13F | Howe & Rusling Inc | 0 | -100.00 | 0 | |||||
| 2025-08-13 | 13F | Summit Financial, LLC | 37,622 | 0.33 | 1,702 | 16.18 | ||||
| 2025-07-25 | 13F | Hazlett, Burt & Watson, Inc. | 440 | 0.00 | 0 | |||||
| 2025-08-04 | 13F | Creative Financial Designs Inc /adv | 1,591 | 0.00 | 72 | 14.52 | ||||
| 2025-07-29 | 13F | JTC Employer Solutions Trusteee Ltd | 606 | 0.00 | 0 | |||||
| 2025-08-07 | 13F | Valence8 US LP | 50,266 | 2,262 | ||||||
| 2025-08-19 | 13F | Cape Investment Advisory, Inc. | 5 | 0.00 | 0 | |||||
| 2025-08-13 | 13F | Capula Management Ltd | 45,974 | -37.13 | 2,069 | -27.62 | ||||
| 2025-07-08 | 13F | Lowe Wealth Advisors, LLC | 57,406 | 5.97 | 2,583 | 22.07 | ||||
| 2025-08-14 | 13F | Graham Capital Management, L.P. | 26,500 | 1,192 | ||||||
| 2025-08-25 | 13F/A | Neuberger Berman Group LLC | 171,088 | 0.08 | 7,699 | 15.26 | ||||
| 2025-05-15 | 13F | Tudor Investment Corp Et Al | 0 | -100.00 | 0 | -100.00 | ||||
| 2025-08-12 | 13F | SRS Capital Advisors, Inc. | 663 | 30 | ||||||
| 2025-08-06 | 13F | Ipsen Advisor Group LLC | 41,616 | 6.93 | 1,873 | 23.16 | ||||
| 2025-08-14 | 13F | Toronto Dominion Bank | 0 | -100.00 | 0 | |||||
| 2025-08-14 | 13F | Group One Trading, L.p. | 20,820 | -51.78 | 937 | -44.48 | ||||
| 2025-04-21 | 13F | Ronald Blue Trust, Inc. | 0 | -100.00 | 0 | |||||
| 2025-08-13 | 13F | Navis Wealth Advisors, LLC | 4,810 | 216 | ||||||
| 2025-08-13 | 13F | Laidlaw Wealth Management LLC | 0 | -100.00 | 0 | |||||
| 2025-08-14 | 13F | Price T Rowe Associates Inc /md/ | 3,628,983 | 4.80 | 163 | 20.74 | ||||
| 2025-08-14 | 13F | UBS Group AG | Call | 4,688 | -96.38 | 211 | -95.85 | |||
| 2025-07-22 | 13F | Inlight Wealth Management, LLC | 2,100 | 0.00 | 94 | 14.63 | ||||
| 2025-08-14 | 13F | UBS Group AG | 306,911 | -49.61 | 13,811 | -41.97 | ||||
| 2025-07-15 | 13F | West Oak Capital, LLC | 115 | 0.00 | 0 | |||||
| 2025-08-14 | 13F | Bank Of America Corp /de/ | 494,342 | -13.40 | 22,245 | -0.26 | ||||
| 2025-05-15 | 13F | Alphadyne Asset Management, LLC | Call | 0 | -100.00 | 0 | ||||
| 2025-08-12 | 13F | O'shaughnessy Asset Management, Llc | 21 | -72.37 | 1 | -100.00 | ||||
| 2025-08-06 | 13F | Tradewinds, LLC. | 0 | -100.00 | 0 | |||||
| 2025-08-14 | 13F | Abound Financial, Llc | 0 | -100.00 | 0 | |||||
| 2025-07-08 | 13F | GK Wealth Management LLC | 5,017 | 226 | ||||||
| 2025-08-08 | 13F | SG Americas Securities, LLC | 14,562 | -82.62 | 1 | -100.00 | ||||
| 2025-08-14 | 13F | Gen-Wealth Partners Inc | 234 | 11 | ||||||
| 2025-07-29 | 13F | Stratos Wealth Partners, LTD. | 8,006 | 360 | ||||||
| 2025-07-14 | 13F | Park Avenue Securities Llc | 7,816 | 8.39 | 0 | |||||
| 2025-08-12 | 13F | Putnam Fl Investment Management Co | 4,660 | 210 | ||||||
| 2025-07-11 | 13F | First PREMIER Bank | 3,500 | 0.00 | 0 | |||||
| 2025-08-13 | 13F | Flow Traders U.s. Llc | 0 | -100.00 | 0 | |||||
| 2025-07-18 | 13F | PFG Investments, LLC | 0 | -100.00 | 0 | |||||
| 2025-07-31 | 13F | AlTi Global, Inc. | 0 | -100.00 | 0 | |||||
| 2025-08-14 | 13F | Goldman Sachs Group Inc | 16,692 | -33.27 | 751 | -23.13 | ||||
| 2025-08-14 | 13F | Barometer Capital Management Inc. | 12,500 | 83.82 | 562 | 112.08 | ||||
| 2025-07-28 | 13F | Wealthspan Partners, Llc | 12,634 | -6.42 | 569 | 7.78 | ||||
| 2025-08-05 | 13F | Sigma Planning Corp | 8,077 | 365 | ||||||
| 2025-08-12 | 13F | AlphaCore Capital LLC | 260 | 12 | ||||||
| 2025-08-14 | 13F | Jane Street Group, Llc | Put | 21,500 | -21.25 | 968 | -9.29 | |||
| 2025-07-30 | 13F | Whittier Trust Co Of Nevada Inc | 230 | -63.49 | 10 | -58.33 | ||||
| 2025-05-14 | 13F | Renaissance Technologies Llc | 0 | -100.00 | 0 | |||||
| 2025-07-21 | 13F | Ameritas Advisory Services, LLC | 21,421 | 8.65 | 964 | 25.06 | ||||
| 2025-05-14 | 13F | HITE Hedge Asset Management LLC | 0 | -100.00 | 0 | |||||
| 2025-08-14 | 13F | Brevan Howard Capital Management LP | 0 | -100.00 | 0 | |||||
| 2025-08-14 | 13F | Jane Street Group, Llc | Call | 8,000 | 11.11 | 360 | 28.11 | |||
| 2025-07-15 | 13F | Main Street Group, LTD | 1,360 | 0.00 | 61 | 15.09 | ||||
| 2025-08-11 | 13F | Principal Securities, Inc. | 6,118 | 55.67 | 275 | 83.33 | ||||
| 2025-08-01 | 13F | Ashton Thomas Private Wealth, LLC | 6,851 | 14.32 | 310 | 32.48 | ||||
| 2025-08-13 | 13F | Capital Fund Management S.a. | Call | 20,100 | -43.54 | 904 | -34.96 | |||
| 2025-08-13 | 13F | Capital Fund Management S.a. | Put | 42,600 | -7.19 | 1,917 | 6.92 | |||
| 2025-07-31 | 13F | Oppenheimer & Co Inc | 20,227 | 4.58 | 910 | 20.53 | ||||
| 2025-08-05 | 13F | Bank Of Montreal /can/ | Call | 0 | -100.00 | 0 | -100.00 | |||
| 2025-08-05 | 13F | Financial Sense Advisors, Inc. | 6,546 | -10.95 | 295 | 2.44 | ||||
| 2025-08-14 | 13F | Glen Eagle Advisors, LLC | 4 | 0.00 | 0 | |||||
| 2025-08-14 | 13F | Visionary Wealth Advisors | 5,365 | 0.00 | 241 | 15.31 | ||||
| 2025-08-14 | 13F | Cubist Systematic Strategies, LLC | 6,832 | 307 | ||||||
| 2025-08-06 | 13F | Golden State Wealth Management, LLC | 338 | 0.00 | 15 | 15.38 | ||||
| 2025-08-05 | 13F | Carolinas Wealth Consulting Llc | 0 | -100.00 | 0 | |||||
| 2025-08-05 | 13F | Magnolia Capital Advisors Llc | 8,477 | -1.61 | 381 | 13.39 | ||||
| 2025-08-06 | 13F | Commonwealth Equity Services, Llc | 100,562 | 1.96 | 5 | 33.33 | ||||
| 2025-08-13 | 13F | Townsquare Capital Llc | 0 | -100.00 | 0 | |||||
| 2025-08-04 | 13F | Assetmark, Inc | 0 | -100.00 | 0 | |||||
| 2025-08-14 | 13F | Hrt Financial Lp | 0 | -100.00 | 0 | |||||
| 2025-08-18 | 13F | Wolverine Trading, Llc | Put | 0 | -100.00 | 0 | -100.00 | |||
| 2025-07-18 | 13F | Parsons Capital Management Inc/ri | 20,702 | -0.74 | 932 | 14.37 | ||||
| 2025-07-31 | 13F | Sumitomo Mitsui Trust Holdings, Inc. | 20,300 | 914 | ||||||
| 2025-07-25 | 13F | Cwm, Llc | 4,079 | 1,356.79 | 0 | |||||
| 2025-08-14 | 13F | Fwl Investment Management, Llc | 3,096 | 43.20 | 139 | 65.48 | ||||
| 2025-08-14 | 13F | First International Bank of Israel Ltd. | 79,300 | 3,568 | ||||||
| 2025-08-14 | 13F | FIL Ltd | 110,060 | 4,557.64 | 4,953 | 5,282.61 | ||||
| 2025-04-15 | 13F | GPS Wealth Strategies Group, LLC | 0 | -100.00 | 0 | |||||
| 2025-08-07 | 13F | PCG Wealth Advisors, LLC | 69,065 | 8.47 | 3,108 | 24.93 | ||||
| 2025-07-22 | 13F | IMC-Chicago, LLC | 0 | -100.00 | 0 | |||||
| 2025-04-11 | 13F | Lake Hills Wealth Management, LLC | 0 | -100.00 | 0 | -100.00 | ||||
| 2025-04-21 | 13F | PSI Advisors, LLC | 0 | -100.00 | 0 | |||||
| 2025-07-23 | 13F | RMG Wealth Management LLC | 85 | 4 | ||||||
| 2025-08-13 | 13F | PACK Private Wealth, LLC | 5,746 | 259 | ||||||
| 2025-08-14 | 13F | BW Gestao de Investimentos Ltda. | 0 | -100.00 | 0 | |||||
| 2025-05-01 | 13F | Quest 10 Wealth Builders, Inc. | 110 | 0.00 | 4 | 0.00 | ||||
| 2025-08-07 | 13F | Winch Advisory Services, LLC | 186 | 0.00 | 8 | 14.29 | ||||
| 2025-08-13 | 13F | Marshall Wace, Llp | 0 | -100.00 | 0 | |||||
| 2025-08-11 | 13F | Strategic Wealth Partners, Ltd. | 462 | 21 | ||||||
| 2025-07-28 | 13F | Kiker Wealth Management, LLC | 0 | -100.00 | 0 | |||||
| 2025-05-15 | 13F | Wiley Bros.-aintree Capital, Llc | 0 | -100.00 | 0 | |||||
| 2025-05-16 | 13F | Coppell Advisory Solutions LLC | 0 | -100.00 | 0 | |||||
| 2025-08-14 | 13F | Stifel Financial Corp | 16,243 | 96.34 | 731 | 126.01 | ||||
| 2025-08-08 | 13F | Pnc Financial Services Group, Inc. | 1,129 | -21.38 | 51 | -10.71 | ||||
| 2025-05-15 | 13F | Two Sigma Securities, Llc | 0 | -100.00 | 0 | |||||
| 2025-05-06 | 13F | WT Wealth Management | 13,303 | 59.09 | 520 | 62.70 | ||||
| 2025-08-01 | 13F | Envestnet Asset Management Inc | 71,888 | 14.28 | 3,235 | 31.62 | ||||
| 2025-08-26 | 13F/A | Thrivent Financial For Lutherans | 24,162 | -91.70 | 1 | -91.67 | ||||
| 2025-04-15 | 13F | Noble Wealth Management PBC | 0 | -100.00 | 0 | |||||
| 2025-05-13 | 13F | Twin Focus Capital Partners, Llc | 0 | -100.00 | 0 | |||||
| 2025-07-21 | 13F | Empirical Financial Services, LLC d.b.a. Empirical Wealth Management | 0 | -100.00 | 0 | |||||
| 2025-08-07 | 13F | Allworth Financial LP | 720 | 20.20 | 32 | 39.13 | ||||
| 2025-08-07 | 13F | Parkside Financial Bank & Trust | 225 | 0.00 | 10 | 25.00 | ||||
| 2025-07-02 | 13F | HBW Advisory Services LLC | 7,741 | 7.81 | 348 | 24.29 | ||||
| 2025-08-15 | 13F | Kestra Advisory Services, LLC | 19,061 | 10.93 | 858 | 27.72 | ||||
| 2025-08-06 | 13F | Rialto Wealth Management, LLC | 203 | 0.00 | 9 | 28.57 | ||||
| 2025-08-11 | 13F | Aptus Capital Advisors, LLC | 1,142 | 0.00 | 51 | 15.91 | ||||
| 2025-08-01 | 13F | Brookwood Investment Group LLC | 25,131 | 14.90 | 1,131 | 32.32 | ||||
| 2025-08-05 | 13F | Simplex Trading, Llc | 725 | -90.96 | 0 | |||||
| 2025-08-01 | 13F | Mizuho Markets Cayman LP | 9,918 | 446 | ||||||
| 2025-07-17 | 13F | Paradigm Financial Partners, Llc | 24,690 | 1,111 | ||||||
| 2025-08-07 | 13F | Guardian Partners Inc. | 154,004 | 785.08 | 6,916 | 943.14 | ||||
| 2025-07-16 | 13F | Register Financial Advisors LLC | 100 | 0.00 | 4 | 33.33 | ||||
| 2025-08-12 | 13F | Steward Partners Investment Advisory, Llc | 89,816 | -0.69 | 4,042 | 14.38 | ||||
| 2025-08-12 | 13F | CIBC Private Wealth Group, LLC | 36 | 2 | ||||||
| 2025-08-18 | 13F/A | Kestra Investment Management, LLC | 104 | 5 | ||||||
| 2025-08-19 | 13F | Delos Wealth Advisors, LLC | 56 | 3 | ||||||
| 2025-08-14 | 13F | Turim 21 Investimentos Ltda. | 1,206 | 0.00 | 54 | 14.89 | ||||
| 2025-08-29 | NP | HHCAX - Highland Long/Short Healthcare Fund Class A | Short | -30,370 | 343.68 | -1,367 | 411.61 | |||
| 2025-08-08 | 13F | Creative Planning | 33,015 | 5.66 | 1,486 | 21.72 | ||||
| 2025-08-14 | 13F | Royal Bank Of Canada | 305,445 | 87.21 | 13,744 | 115.59 | ||||
| 2025-07-16 | 13F | Legend Financial Advisors, Inc. | 206,983 | -1.25 | 9,314 | 13.74 | ||||
| 2025-07-31 | 13F | Fielder Capital Group LLC | 367,511 | -8.06 | 16,538 | 5.90 | ||||
| 2025-05-15 | 13F | Schonfeld Strategic Advisors LLC | 0 | -100.00 | 0 | |||||
| 2025-08-18 | 13F | Wolverine Trading, Llc | Call | 7,500 | -70.47 | 337 | -66.93 | |||
| 2025-07-14 | 13F | Caitlin John, LLC | 0 | -100.00 | 0 | |||||
| 2025-08-01 | 13F | Y-Intercept (Hong Kong) Ltd | 25,079 | 1,129 | ||||||
| 2025-08-14 | 13F | Fmr Llc | 642 | -56.21 | 29 | -50.88 | ||||
| 2025-05-15 | 13F | Elo Mutual Pension Insurance Co | 0 | -100.00 | 0 | -100.00 | ||||
| 2025-05-12 | 13F | Virtu Financial LLC | 0 | -100.00 | 0 | |||||
| 2025-05-15 | 13F | SIH Partners, LLLP | 0 | -100.00 | 0 | |||||
| 2025-07-14 | 13F | U.S. Capital Wealth Advisors, LLC | 15,990 | 8.11 | 720 | 24.61 | ||||
| 2025-07-29 | 13F | Private Trust Co Na | 48 | -7.69 | 2 | 0.00 | ||||
| 2025-08-12 | 13F | XTX Topco Ltd | 10,458 | 471 | ||||||
| 2025-07-21 | 13F | Mirae Asset Global Investments Co., Ltd. | 31,700 | -63.33 | 1,426 | -58.76 | ||||
| 2025-07-08 | 13F | Nbc Securities, Inc. | 709 | 43.52 | 0 | |||||
| 2025-08-14 | 13F | Riggs Asset Managment Co. Inc. | 51 | -92.84 | 2 | -92.59 | ||||
| 2025-08-15 | 13F | Morgan Stanley | 758,614 | -31.32 | 34,138 | -20.90 | ||||
| 2025-08-07 | 13F | Brio Consultants, LLC | 0 | -100.00 | 0 | -100.00 | ||||
| 2025-08-08 | 13F | Avantax Advisory Services, Inc. | 15,098 | -67.84 | 679 | -62.98 | ||||
| 2025-08-14 | 13F | Wealth High Governance Capital Ltda | 0 | -100.00 | 0 | |||||
| 2025-08-12 | 13F | J.w. Cole Advisors, Inc. | 9,315 | 419 | ||||||
| 2025-04-22 | 13F | Synergy Financial Management, LLC | 0 | -100.00 | 0 | |||||
| 2025-08-14 | 13F | Bnp Paribas Arbitrage, Sa | 73,821 | -58.59 | 3,322 | -52.32 | ||||
| 2025-08-13 | 13F | Johnson Financial Group, Inc. | 0 | -100.00 | 0 | |||||
| 2025-08-14 | 13F | Polymer Capital Management (HK) LTD | 62,300 | 2,804 | ||||||
| 2025-08-08 | 13F | Emerald Investment Partners, Llc | 51 | 2 | ||||||
| 2025-05-29 | NP | MMRFX - MassMutual Select T. Rowe Price Real Assets Fund Class I | 13,793 | -65.84 | 539 | -65.09 | ||||
| 2025-07-29 | 13F | CapWealth Advisors, LLC | 7,500 | 0.00 | 338 | 15.02 | ||||
| 2025-07-25 | 13F | Atria Wealth Solutions, Inc. | 7,195 | 0.00 | 324 | 14.95 | ||||
| 2025-08-18 | 13F | Tactive Advisors, LLC | 24,867 | 1,119 | ||||||
| 2025-07-16 | 13F | Evergreen Private Wealth LLC | 89 | 0.00 | 4 | 33.33 | ||||
| 2025-08-19 | 13F | Marex Group plc | 20,421 | 919 | ||||||
| 2025-08-14 | 13F | GWM Advisors LLC | 14,959 | -18.20 | 673 | -5.74 | ||||
| 2025-07-09 | 13F | Krilogy Financial LLC | 0 | -100.00 | 0 | |||||
| 2025-08-14 | 13F | Banco BTG Pactual S.A. | 16,785 | 11.64 | 755 | 28.62 | ||||
| 2025-08-14 | 13F | Banque Transatlantique SA | 0 | -100.00 | 0 | |||||
| 2025-07-07 | 13F | Thurston, Springer, Miller, Herd & Titak, Inc. | 407 | 20.77 | 18 | 38.46 | ||||
| 2025-08-13 | 13F | Jones Financial Companies Lllp | 15,594 | 18.97 | 700 | 33.59 | ||||
| 2025-08-12 | 13F | LPL Financial LLC | 327,746 | -3.77 | 14,749 | 10.84 | ||||
| 2025-05-05 | 13F | Lindbrook Capital, Llc | 35 | 0.00 | 1 | 0.00 | ||||
| 2025-08-04 | 13F | Quaker Wealth Management, LLC | 41,664 | 1,875 | ||||||
| 2025-08-14 | 13F | Federation des caisses Desjardins du Quebec | 655 | 52.33 | 29 | 81.25 | ||||
| 2025-08-14 | 13F | Susquehanna International Group, Llp | 24,275 | 44.80 | 1,092 | 66.72 | ||||
| 2025-08-12 | 13F | Global Retirement Partners, LLC | 2,677 | 40.45 | 120 | 66.67 | ||||
| 2025-08-12 | 13F | Concentrum Wealth Management | 6,607 | -15.37 | 297 | -2.62 | ||||
| 2025-08-14 | 13F | Susquehanna International Group, Llp | Call | 277,300 | -48.66 | 12,478 | -40.87 | |||
| 2025-08-14 | 13F | Susquehanna International Group, Llp | Put | 59,700 | -42.87 | 2,686 | -34.20 |