Mga Batayang Estadistika
| Pemilik Institusional | 380 total, 379 long only, 0 short only, 1 long/short - change of 7.91% MRQ |
| Alokasi Portofolio Rata-rata | 0.4723 % - change of 0.48% MRQ |
| Saham Institusional (Jangka Panjang) | 42,776,810 (ex 13D/G) - change of 5.32MM shares 14.21% MRQ |
| Nilai Institusional (Jangka Panjang) | $ 1,958,722 USD ($1000) |
Kepemilikan Institusional dan Pemegang Saham
Fidelity Covington Trust - Fidelity High Dividend ETF (US:FDVV) memiliki 380 pemilik institusional dan pemegang saham yang telah mengajukan formulir 13D/G atau 13F kepada Komisi Bursa Efek (Securities Exchange Commission/SEC). Lembaga-lembaga ini memegang total 42,776,810 saham. Pemegang saham terbesar meliputi Commonwealth Equity Services, Llc, LPL Financial LLC, Morgan Stanley, Retirement Planning Group, Bank Of America Corp /de/, Envestnet Asset Management Inc, Advisor Group Holdings, Inc., Wells Fargo & Company/mn, Raymond James Financial Inc, and Cetera Investment Advisers .
Struktur kepemilikan institusional Fidelity Covington Trust - Fidelity High Dividend ETF (ARCA:FDVV) menunjukkan posisi terkini di perusahaan oleh institusi dan dana, serta perubahan terbaru dalam ukuran posisi. Pemegang saham utama dapat mencakup investor individu, reksa dana, dana lindung nilai, atau institusi. Jadwal 13D menunjukkan bahwa investor memegang (atau pernah memegang) lebih dari 5% saham perusahaan dan bermaksud (atau pernah bermaksud) untuk secara aktif mengejar perubahan strategi bisnis. Jadwal 13G menunjukkan investasi pasif lebih dari 5%.
The share price as of September 10, 2025 is 55.20 / share. Previously, on September 11, 2024, the share price was 49.24 / share. This represents an increase of 12.10% over that period.

Skor Sentimen Dana
Skor Sentimen Dana (sebelumnya dikenal sebagai Skor Akumulasi Kepemilikan) menemukan saham-saham yang paling banyak dibeli oleh dana. Ini adalah hasil dari model kuantitatif multi-faktor yang canggih yang mengidentifikasi perusahaan dengan tingkat akumulasi institusional tertinggi. Model penilaian menggunakan kombinasi dari total peningkatan pemilik yang diungkapkan, perubahan dalam alokasi portofolio pada pemilik tersebut, dan metrik lainnya. Angka berkisar dari 0 hingga 100, dengan angka yang lebih tinggi menunjukkan tingkat akumulasi yang lebih tinggi dibandingkan dengan perusahaan sejenisnya, dan 50 adalah rata-ratanya.
Frekuensi Pembaruan: Setiap Hari
Lihat Ownership Explorer, yang menyediakan daftar perusahaan dengan peringkat tertinggi.
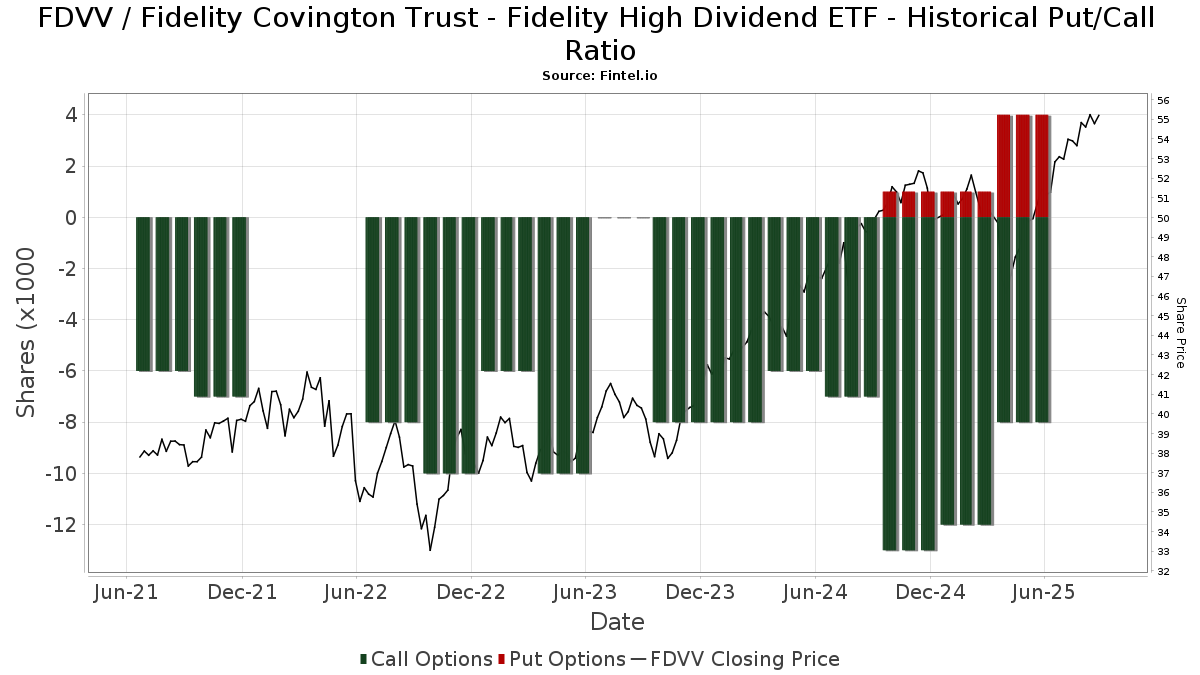
Rasio Put/Call Institusional
Selain melaporkan isu ekuitas dan utang standar, institusi dengan aset di bawah manajemen lebih dari 100 juta dolar AS juga harus mengungkapkan kepemilikan opsi put dan call mereka. Karena opsi put umumnya menunjukkan sentimen negatif, dan opsi call menunjukkan sentimen positif, kita dapat mengetahui sentimen institusional secara keseluruhan dengan memplot rasio put terhadap call. Grafik di sebelah kanan memplot rasio put/call historis untuk instrumen ini.
Menggunakan Rasio Put/Call sebagai indikator sentimen investor mengatasi salah satu kekurangan utama dari penggunaan total kepemilikan institusional, yaitu sejumlah besar aset yang dikelola diinvestasikan secara pasif untuk melacak indeks. Dana yang dikelola secara pasif biasanya tidak membeli opsi, sehingga indikator rasio put/call lebih akurat dalam melacak sentimen dana yang dikelola secara aktif.
Pengajuan 13F dan NPORT
Detail pada pengajuan 13F tersedia gratis. Detail pada pengajuan NP memerlukan keanggotaan premium. Baris berwarna hijau menunjukkan posisi baru. Baris berwarna merah menunjukkan posisi yang sudah ditutup. Klik tautan ini ikon untuk melihat riwayat transaksi selengkapnya.
Tingkatkan
untuk membuka data premium dan mengekspor ke Excel ![]() .
.
| Tanggal File | Sumber | Investor | Ketik | Presyo ng Avg (Silangan) |
Saham | Δ Saham (%) |
Dilaporkan Nilai ($1000) |
Nilai Δ (%) |
Alokasi Port (%) |
|
|---|---|---|---|---|---|---|---|---|---|---|
| 2025-08-29 | 13F | Centaurus Financial, Inc. | 16,367 | 4.53 | 1 | |||||
| 2025-08-14 | 13F | Paragon Private Wealth Management, LLC | 22,643 | 35.60 | 1,178 | 42.15 | ||||
| 2025-08-08 | 13F | Foundations Investment Advisors, LLC | 23,916 | 34.25 | 1,244 | 40.88 | ||||
| 2025-08-14 | 13F | GWM Advisors LLC | 112,833 | 49.78 | 5,870 | 57.09 | ||||
| 2025-05-06 | 13F | Lifeworks Advisors, LLC | 0 | -100.00 | 0 | |||||
| 2025-07-16 | 13F | Octavia Wealth Advisors, LLC | 23,378 | -5.78 | 1,216 | -1.14 | ||||
| 2025-07-25 | 13F | Investment Advisory Group, LLC | 6,481 | 337 | ||||||
| 2025-08-14 | 13F | Full Sail Capital, LLC | 6,000 | 0.00 | 312 | 5.05 | ||||
| 2025-05-05 | 13F | Lindbrook Capital, Llc | 50 | 0.00 | 2 | 0.00 | ||||
| 2025-08-13 | 13F | Valued Retirements, Inc. | 87,500 | 7.31 | 4,552 | 12.54 | ||||
| 2025-08-14 | 13F | First Foundation Advisors | 4,500 | 0.00 | 234 | 4.93 | ||||
| 2025-07-21 | 13F | Mendota Financial Group, LLC | 0 | -100.00 | 0 | |||||
| 2025-07-21 | 13F | Ameritas Advisory Services, LLC | 10,398 | -38.38 | 541 | -35.87 | ||||
| 2025-08-08 | 13F | Capital Investment Advisory Services, LLC | 622 | 331.94 | 32 | 357.14 | ||||
| 2025-08-12 | 13F | Integrated Advisors Network LLC | 71,358 | 23.98 | 3,712 | 30.06 | ||||
| 2025-08-13 | 13F | Rsm Us Wealth Management Llc | 5,172 | 269 | ||||||
| 2025-08-01 | 13F | Envestnet Asset Management Inc | 1,648,459 | 21.09 | 85,753 | 26.99 | ||||
| 2025-08-04 | 13F | Kovack Advisors, Inc. | 73,754 | -63.77 | 3,837 | -62.01 | ||||
| 2025-08-05 | 13F | BEAM Asset Management, LLC | 34,274 | 11.52 | 1,783 | 16.93 | ||||
| 2025-08-12 | 13F | Cornerstone Wealth Management, LLC | 5,524 | 20.11 | 287 | 25.88 | ||||
| 2025-08-07 | 13F | Kestra Private Wealth Services, Llc | 82,628 | -8.74 | 4,298 | -4.30 | ||||
| 2025-07-10 | 13F | Capital Advisory Group Advisory Services, LLC | 24,463 | -1.17 | 1,273 | 3.67 | ||||
| 2025-08-06 | 13F | Hoxton Planning & Management, LLC | 3,910 | 203 | ||||||
| 2025-08-04 | 13F | Mayflower Financial Advisors, LLC | 0 | -100.00 | 0 | |||||
| 2025-08-14 | 13F | Hilltop Holdings Inc. | 48,107 | -1.11 | 2,503 | 3.73 | ||||
| 2025-08-14 | 13F | Fmr Llc | 128,437 | 13.09 | 6,681 | 18.60 | ||||
| 2025-08-14 | 13F | Catalyst Financial Partners Llc | 6,007 | 44.57 | 312 | 51.46 | ||||
| 2025-08-14 | 13F | Stifel Financial Corp | 187,583 | -23.85 | 9,758 | -20.13 | ||||
| 2025-08-15 | 13F | Captrust Financial Advisors | 211,520 | 0.46 | 11,003 | 5.36 | ||||
| 2025-08-13 | 13F | Flow Traders U.s. Llc | 0 | -100.00 | 0 | |||||
| 2025-08-07 | 13F | Allworth Financial LP | 547,991 | 4.82 | 28,506 | 14.77 | ||||
| 2025-08-11 | 13F | Regal Investment Advisors LLC | 16,320 | 58.39 | 849 | 65.95 | ||||
| 2025-05-06 | 13F | Venturi Wealth Management, LLC | 0 | -100.00 | 0 | |||||
| 2025-07-29 | 13F | Koshinski Asset Management, Inc. | 56,110 | 36.69 | 2,919 | 43.32 | ||||
| 2025-07-29 | 13F | Fundamentun, Llc | 240,012 | 12,485 | ||||||
| 2025-07-25 | 13F | Tranquility Partners, LLC | 6,590 | 0.00 | 343 | 4.91 | ||||
| 2025-07-15 | 13F | Financial Partners Group, Inc | 0 | -100.00 | 0 | |||||
| 2025-08-14 | 13F | Hrt Financial Lp | 0 | -100.00 | 0 | |||||
| 2025-08-13 | 13F | Crescent Grove Advisors, LLC | 7,367 | 0.00 | 383 | 4.93 | ||||
| 2025-07-29 | 13F | Mb, Levis & Associates, Llc | 541 | 28 | ||||||
| 2025-05-02 | 13F | BluePointe Capital Management, LLC | 142,826 | 2.93 | 7,084 | 2.24 | ||||
| 2025-07-30 | 13F | Principle Wealth Partners Llc | 81,360 | -0.37 | 4,232 | 4.49 | ||||
| 2025-07-02 | 13F | Dentgroup LLC | 150,578 | -0.43 | 7,833 | 4.44 | ||||
| 2025-08-12 | 13F | Wayfinding Financial, LLC | 121,808 | -1.31 | 7 | 0.00 | ||||
| 2025-07-10 | 13F | Community Trust & Investment Co | 14,030 | -10.79 | 730 | -6.54 | ||||
| 2025-04-16 | 13F | Goldstone Financial Group, LLC | 0 | -100.00 | 0 | |||||
| 2025-07-16 | 13F | Southern Capital Advisors, Llc | 5,000 | 0.00 | 260 | 4.84 | ||||
| 2025-08-12 | 13F | Steward Partners Investment Advisory, Llc | 42,607 | 1.94 | 2,216 | 6.90 | ||||
| 2025-07-10 | 13F | Kmg Fiduciary Partners, Llc | 5,167 | 269 | ||||||
| 2025-08-14 | 13F | McIlrath & Eck, LLC | 709,671 | 4.26 | 36,917 | 9.35 | ||||
| 2025-08-06 | 13F | Soltis Investment Advisors LLC | 21,507 | 1.70 | 1,119 | 6.68 | ||||
| 2025-08-05 | 13F | Greater Midwest Financial Group, LLC | 0 | -100.00 | 0 | |||||
| 2025-07-29 | 13F | AssuredPartners Investment Advisors, LLC | 359,916 | -7.81 | 18,723 | -3.32 | ||||
| 2025-07-29 | 13F | Harbor Asset Planning, Inc. | 4,155 | 216 | ||||||
| 2025-08-13 | 13F | Nicolet Advisory Services, Llc | 11,258 | -17.41 | 597 | -3.40 | ||||
| 2025-07-07 | 13F | Accelerate Investment Advisors LLC | 5,810 | 302 | ||||||
| 2025-04-14 | 13F | City Center Advisors, LLC | 0 | -100.00 | 0 | |||||
| 2025-04-16 | 13F/A | Avaii Wealth Management, Llc | 0 | -100.00 | 0 | -100.00 | ||||
| 2025-08-04 | 13F | Bay Colony Advisory Group, Inc d/b/a Bay Colony Advisors | 11,068 | -0.99 | 576 | 4.74 | ||||
| 2025-08-04 | 13F | Flagship Harbor Advisors, Llc | 111,966 | 554.31 | 5,824 | 586.79 | ||||
| 2025-08-14 | 13F | EP Wealth Advisors, Inc. | 46,561 | 20.48 | 2,422 | 26.41 | ||||
| 2025-08-06 | 13F | Regimen Wealth, Llc | 369,090 | 19,200 | ||||||
| 2025-07-15 | 13F | Sheets Smith Wealth Management | 46,070 | 1.99 | 2,397 | 6.96 | ||||
| 2025-07-22 | 13F | Unique Wealth, Llc | 53,344 | 32.00 | 2,775 | 38.42 | ||||
| 2025-08-12 | 13F | Calton & Associates, Inc. | 265,918 | 66.75 | 13,833 | 74.90 | ||||
| 2025-07-24 | 13F | Tandem Capital Management Corp /adv | 9,620 | 0.47 | 500 | 5.49 | ||||
| 2025-08-14 | 13F | Harwood Advisory Group, LLC | 514 | 1.78 | 27 | 4.00 | ||||
| 2025-07-29 | 13F | Systelligence, LLC | 297,706 | 10.18 | 15,487 | 15.55 | ||||
| 2025-08-07 | 13F | Lakeridge Wealth Management LLC | 335,907 | 5.71 | 17,474 | 10.86 | ||||
| 2025-08-26 | NP | EVTTX - The E-Valuator Conservative/Moderate (30%-50%) RMS Fund Service Class Shares | 6,664 | -3.57 | 347 | 1.17 | ||||
| 2025-07-31 | 13F | 180 Wealth Advisors, Llc | 8,255 | -1.13 | 429 | 3.62 | ||||
| 2025-07-07 | 13F | Roxbury Financial LLC | 1,173 | 0.00 | 61 | 1.67 | ||||
| 2025-08-05 | 13F | Code Waechter LLC | 21,958 | 0.00 | 1,142 | 114,100.00 | ||||
| 2025-08-08 | 13F | Cetera Investment Advisers | 972,004 | 20.22 | 50,564 | 26.08 | ||||
| 2025-05-02 | 13F | Capital A Wealth Management, LLC | 190 | 11.76 | 9 | 12.50 | ||||
| 2025-07-23 | 13F | Element Wealth, LLC | 16,839 | 18.66 | 876 | 24.47 | ||||
| 2025-07-30 | 13F | Evermay Wealth Management Llc | 600 | 31 | ||||||
| 2025-08-13 | 13F | Jones Financial Companies Lllp | 321 | 17 | ||||||
| 2025-08-13 | 13F | MONECO Advisors, LLC | 7,221 | -11.44 | 376 | -7.18 | ||||
| 2025-07-23 | 13F | Prime Capital Investment Advisors, LLC | 300,474 | -29.50 | 15,631 | -26.06 | ||||
| 2025-08-08 | 13F | Thoroughbred Financial Services, Llc | 135,172 | 23.43 | 7 | 40.00 | ||||
| 2025-07-21 | 13F | Onyx Financial Advisors, LLC | 16,582 | 0.35 | 863 | 5.25 | ||||
| 2025-08-08 | 13F | Sculati Wealth Management, LLC | 136,002 | 1,877.92 | 7,075 | 1,974.49 | ||||
| 2025-05-08 | 13F | HHM Wealth Advisors, LLC | 0 | -100.00 | 0 | |||||
| 2025-07-22 | 13F | Mascoma Wealth Management LLC | 41,127 | -18.81 | 2,139 | -14.85 | ||||
| 2025-08-06 | 13F | Golden State Wealth Management, LLC | 36,846 | 1,917 | ||||||
| 2025-07-22 | 13F | Wealthcare Advisory Partners LLC | 3,945 | 205 | ||||||
| 2025-07-25 | 13F | Sequoia Financial Advisors, LLC | 13,544 | -13.98 | 705 | -9.86 | ||||
| 2025-07-30 | 13F | Retirement Planning Group | 1,997,711 | 9.31 | 103,921 | 14.64 | ||||
| 2025-06-11 | 13F | Fortitude Financial, LLC | 46,319 | 0.00 | 2,297 | -0.69 | ||||
| 2025-08-04 | 13F | Creekmur Asset Management LLC | 700 | 0.00 | 36 | 5.88 | ||||
| 2025-08-14 | 13F | Susquehanna International Group, Llp | 627,963 | 6.27 | 32,667 | 11.46 | ||||
| 2025-07-25 | 13F | Avion Wealth | 0 | -100.00 | 0 | |||||
| 2025-07-14 | 13F | Farmers & Merchants Investments Inc | 40 | 2 | ||||||
| 2025-07-21 | 13F | Patriot Financial Group Insurance Agency, LLC | 84,525 | 1.96 | 4,397 | 6.91 | ||||
| 2025-08-14 | 13F | Great Valley Advisor Group, Inc. | 35,439 | 45.46 | 1,843 | 52.57 | ||||
| 2025-08-14 | 13F | CoreCap Advisors, LLC | 26,877 | 10.06 | 1,398 | 15.44 | ||||
| 2025-04-10 | 13F | Iams Wealth Management, Llc | 0 | -100.00 | 0 | |||||
| 2025-08-08 | 13F | Gts Securities Llc | 6,406 | -86.30 | 333 | -85.63 | ||||
| 2025-08-14 | 13F | Widmann Financial Services, Inc. | 10,621 | 2.51 | 553 | 7.60 | ||||
| 2025-08-14 | 13F | IHT Wealth Management, LLC | 42,613 | -4.74 | 2,217 | -0.09 | ||||
| 2025-07-25 | 13F | Envestnet Portfolio Solutions, Inc. | 66,852 | 34.23 | 3,478 | 40.77 | ||||
| 2025-08-13 | 13F | Dana Investment Advisors, Inc. | 51,689 | -21.47 | 2,689 | -17.65 | ||||
| 2025-07-29 | 13F | International Assets Investment Management, Llc | 32,136 | 3.38 | 1,672 | 8.44 | ||||
| 2025-08-12 | 13F | Proequities, Inc. | 0 | 0 | ||||||
| 2025-07-07 | 13F | TruWealth Advisors, LLC | 24,749 | 53.86 | 1,287 | 61.48 | ||||
| 2025-07-11 | 13F | Caldwell Securities, Inc | 12 | 0.00 | 1 | |||||
| 2025-08-14 | 13F | Wells Fargo & Company/mn | 1,101,910 | 9.21 | 57,321 | 14.54 | ||||
| 2025-08-05 | 13F | Key FInancial Inc | 135 | 0.00 | 7 | 16.67 | ||||
| 2025-08-14 | 13F | Certified Advisory Corp | 32,678 | -4.17 | 1,700 | 0.47 | ||||
| 2025-07-18 | 13F | Powers Advisory Group, LLC | 54,788 | 135.43 | 2,850 | 146.97 | ||||
| 2025-08-13 | 13F | Strategic Family Wealth Counselors, L.L.C. | 4,260 | 0.88 | 222 | 5.74 | ||||
| 2025-08-26 | NP | EVAGX - The E-Valuator Aggressive Growth (85%-99%) RMS Fund Service Class Shares | 113,858 | 19.52 | 5,923 | 25.36 | ||||
| 2025-07-22 | 13F | Grimes & Company, Inc. | 5,420 | 0.00 | 282 | 4.85 | ||||
| 2025-07-31 | 13F | Richards, Merrill & Peterson, Inc. | 0 | -100.00 | 0 | |||||
| 2025-08-12 | 13F | Archer Investment Corp | 3,002 | 4.31 | 156 | 9.86 | ||||
| 2025-05-12 | 13F | Independent Advisor Alliance | 0 | -100.00 | 0 | |||||
| 2025-05-01 | 13F | Quest 10 Wealth Builders, Inc. | 2,000 | 0.00 | 99 | 0.00 | ||||
| 2025-07-08 | 13F | Atlas Brown,Inc. | 5,434 | 3.07 | 283 | 8.05 | ||||
| 2025-08-08 | 13F | Flaharty Asset Management, LLC | 1,171 | 0.00 | 61 | 3.45 | ||||
| 2025-07-14 | 13F | Armstrong Advisory Group, Inc | 2,361 | 0.43 | 123 | 4.27 | ||||
| 2025-09-04 | 13F/A | Advisor Group Holdings, Inc. | 1,127,657 | -2.81 | 58,685 | 1.94 | ||||
| 2025-08-11 | 13F | Aptus Capital Advisors, LLC | 7,769 | 14.84 | 404 | 20.60 | ||||
| 2025-08-18 | 13F/A | National Bank Of Canada /fi/ | 12 | 0.00 | 1 | |||||
| 2025-07-22 | 13F | DAVENPORT & Co LLC | 26,292 | 277.11 | 1,368 | 296.23 | ||||
| 2025-05-08 | NP | QALTX - Quantified Alternative Investment Fund Investor Class Shares | 22,752 | 64.32 | 1,128 | 63.24 | ||||
| 2025-08-13 | 13F | Level Four Advisory Services, Llc | 44,222 | 10.27 | 2,300 | 15.64 | ||||
| 2025-08-14 | 13F | Mml Investors Services, Llc | 526,520 | 42.74 | 27 | 50.00 | ||||
| 2025-08-13 | 13F | Renaissance Technologies Llc | 58,600 | 3,048 | ||||||
| 2025-07-18 | 13F | Madrona Financial Services, LLC | 0 | -100.00 | 0 | |||||
| 2025-08-08 | 13F | TD Capital Management LLC | 175 | 1.16 | 9 | 12.50 | ||||
| 2025-08-27 | 13F/A | Brinker Capital Investments, LLC | 88,783 | 23.07 | 4,619 | 29.07 | ||||
| 2025-07-09 | 13F | WealthCare Investment Partners, LLC | 11,228 | 10.39 | 597 | 28.66 | ||||
| 2025-07-18 | 13F | Truist Financial Corp | 160,732 | -3.45 | 8,361 | 1.26 | ||||
| 2025-08-12 | 13F | Putnam Fl Investment Management Co | 17,812 | 67.14 | 927 | 75.38 | ||||
| 2025-07-25 | 13F | Keener Financial Planning LLC | 422 | 0.00 | 0 | |||||
| 2025-08-08 | 13F | Meridian Wealth Management, LLC | 3,959 | 206 | ||||||
| 2025-08-14 | 13F | Betterment LLC | 8,387 | -4.92 | 0 | |||||
| 2025-08-14 | 13F | DHK Financial Advisors, Inc. | 7,189 | 0.88 | 374 | 5.67 | ||||
| 2025-08-11 | 13F | HighTower Advisors, LLC | 83,540 | 104.28 | 4,346 | 114.25 | ||||
| 2025-07-24 | 13F | Jfs Wealth Advisors, Llc | 1,655 | 0.85 | 86 | 6.17 | ||||
| 2025-08-08 | 13F | Advyzon Investment Management, LLC | 6,607 | 344 | ||||||
| 2025-07-22 | 13F | Hubbell Strickland Wealth Management, LLC | 13,816 | -0.60 | 719 | 3.46 | ||||
| 2025-08-12 | 13F | J.w. Cole Advisors, Inc. | 21,744 | 9.30 | 1,131 | 14.71 | ||||
| 2025-07-16 | 13F | Essex Financial Services, Inc. | 80,332 | 5.55 | 4,179 | 10.70 | ||||
| 2025-08-19 | 13F | National Asset Management, Inc. | 12,027 | 19.92 | 626 | 25.00 | ||||
| 2025-08-06 | 13F | Aspect Partners, LLC | 5,840 | 0.00 | 304 | 4.84 | ||||
| 2025-07-07 | 13F | Nova Wealth Management, Inc. | 8,547 | 448.94 | 445 | 476.62 | ||||
| 2025-07-10 | 13F | Exchange Traded Concepts, Llc | 700 | 36 | ||||||
| 2025-08-13 | 13F | Quadrant Capital Group Llc | 0 | -100.00 | 0 | |||||
| 2025-08-14 | 13F | Ancora Advisors, LLC | 1,975 | 103 | ||||||
| 2025-08-12 | 13F | Gladstone Institutional Advisory LLC | 21,601 | -6.29 | 1,124 | -1.75 | ||||
| 2025-08-20 | 13F | Forefront Wealth Partners, LLC | 4,946 | 257 | ||||||
| 2025-08-06 | 13F | Mark Sheptoff Financial Planning, Llc | 118 | 0.00 | 6 | 20.00 | ||||
| 2025-08-14 | 13F | D. E. Shaw & Co., Inc. | 5,336 | -38.21 | 278 | -35.28 | ||||
| 2025-07-17 | 13F | ERn Financial, LLC | 21,760 | 1,132 | ||||||
| 2025-08-12 | 13F | PKS Advisory Services, LLC | 5,852 | 15.38 | 304 | 21.12 | ||||
| 2025-08-05 | 13F | GHP Investment Advisors, Inc. | 2 | 0.00 | 0 | |||||
| 2025-08-14 | 13F | Wiley Bros.-aintree Capital, Llc | 14,836 | -9.43 | 772 | -4.10 | ||||
| 2025-04-28 | 13F | Mutual Advisors, LLC | 0 | -100.00 | 0 | -100.00 | ||||
| 2025-07-14 | 13F | Southland Equity Partners LLC | 6,499 | 46.90 | 338 | 54.34 | ||||
| 2025-07-21 | 13F | HighMark Wealth Management LLC | 208 | 0.97 | 11 | 0.00 | ||||
| 2025-07-08 | 13F | Parallel Advisors, LLC | 0 | 0 | ||||||
| 2025-08-13 | 13F | Northwestern Mutual Wealth Management Co | 795,510 | 11.56 | 41,382 | 17.01 | ||||
| 2025-07-14 | 13F | Abound Wealth Management | 926 | -0.54 | 48 | 4.35 | ||||
| 2025-04-28 | 13F | Buffington Mohr McNeal | 7,726 | 383 | ||||||
| 2025-08-01 | 13F | FSA Advisors, Inc. | 0 | -100.00 | 0 | |||||
| 2025-08-14 | 13F | Investmark Advisory Group LLC | 87,090 | 2.61 | 4,530 | 7.63 | ||||
| 2025-08-14 | 13F | Comerica Bank | 1,181 | -67.68 | 61 | -66.30 | ||||
| 2025-07-16 | 13F | Signaturefd, Llc | 679 | 3.51 | 35 | 9.38 | ||||
| 2025-07-21 | 13F | Ameriflex Group, Inc. | 0 | -100.00 | 0 | |||||
| 2025-08-06 | 13F | Atlantic Union Bankshares Corp | 1,250 | 65 | ||||||
| 2025-07-30 | 13F | BG Investment Services, Inc. | 59,710 | 17.55 | 3,106 | 23.40 | ||||
| 2025-07-29 | 13F | Stephens Inc /ar/ | 128,716 | 6.68 | 6,696 | 11.88 | ||||
| 2025-05-12 | 13F | Sandy Spring Bank | 9,518 | 3,020.66 | 472 | 3,046.67 | ||||
| 2025-08-01 | 13F | Schmidt P J Investment Management Inc | 30,867 | 35.19 | 1,606 | 41.78 | ||||
| 2025-08-12 | 13F | Pathstone Holdings, LLC | 5,176 | 0.04 | 269 | 5.08 | ||||
| 2025-08-13 | 13F | Lido Advisors, LLC | 169,806 | 648.08 | 8,833 | 685.16 | ||||
| 2025-08-14 | 13F | Royal Bank Of Canada | 156,873 | 44.84 | 8,161 | 51.89 | ||||
| 2025-07-14 | 13F | McGlone Suttner Wealth Management, Inc. | 114,388 | 1.80 | 5,950 | 6.76 | ||||
| 2025-04-23 | 13F | PBMares Wealth Management LLC | 0 | -100.00 | 0 | |||||
| 2025-05-09 | 13F | Belvedere Trading LLC | Call | 0 | -100.00 | 0 | ||||
| 2025-08-05 | 13F | Dynasty Wealth Management, Llc | 561,496 | -5.00 | 29,209 | -0.36 | ||||
| 2025-08-08 | 13F | Glassman Wealth Services | 13,850 | 0.00 | 720 | 4.96 | ||||
| 2025-08-26 | NP | EVCLX - The E-Valuator Conservative (15%-30%) RMS Fund Service Class Shares | 7,949 | -1.86 | 414 | 2.99 | ||||
| 2025-07-10 | 13F | Clare Market Investments LLC | 23,175 | 0.00 | 1,206 | 4.87 | ||||
| 2025-07-24 | 13F | Morton Brown Family Wealth, LLC | 236 | 0.00 | 12 | 9.09 | ||||
| 2025-08-04 | 13F | Arkadios Wealth Advisors | 500,499 | 369.21 | 26,036 | 392.16 | ||||
| 2025-07-28 | 13F | RFG Advisory, LLC | 121,678 | -7.11 | 6,330 | -2.59 | ||||
| 2025-07-29 | 13F | Private Trust Co Na | 0 | -100.00 | 0 | |||||
| 2025-08-14 | 13F | Qube Research & Technologies Ltd | 18,761 | 95.59 | 976 | 105.26 | ||||
| 2025-07-09 | 13F | Sapient Capital Llc | 20,126 | 1,047 | ||||||
| 2025-07-14 | 13F | UMA Financial Services, Inc. | 76 | -50.00 | 4 | -57.14 | ||||
| 2025-07-11 | 13F | Compass Ion Advisors, LLC | 4,843 | 0.00 | 252 | 4.58 | ||||
| 2025-08-13 | 13F | Greenwich Wealth Management LLC | 4,694 | 0.00 | 0 | |||||
| 2025-08-15 | 13F | Morgan Stanley | 2,196,224 | -0.32 | 114,248 | 4.54 | ||||
| 2025-08-08 | 13F | Creative Planning | 10,975 | 19.76 | 571 | 25.55 | ||||
| 2025-08-12 | 13F | Landing Point Financial Group, LLC | 348,657 | 2.08 | 18,137 | 7.06 | ||||
| 2025-07-23 | 13F | Valmark Advisers, Inc. | 70,722 | 4.02 | 3,679 | 9.07 | ||||
| 2025-08-12 | 13F | OneAscent Financial Services LLC | 21,860 | -35.00 | 1 | 0.00 | ||||
| 2025-08-15 | 13F | Equitable Holdings, Inc. | 180,591 | 105.36 | 9,394 | 115.41 | ||||
| 2025-08-14 | 13F | Godshalk Welsh Capital Management, Inc. | 33,390 | 4.26 | 1,737 | 9.32 | ||||
| 2025-07-23 | 13F | Kingswood Wealth Advisors, Llc | 5,479 | -0.83 | 285 | 4.01 | ||||
| 2025-08-12 | 13F | Founders Financial Alliance, LLC | 4 | 0.00 | 0 | |||||
| 2025-08-14 | 13F | Core Wealth Advisors, Inc. | 21,344 | 9.50 | 1,110 | 14.91 | ||||
| 2025-07-30 | 13F | Cullen/frost Bankers, Inc. | 25,568 | 2.28 | 1,330 | 7.34 | ||||
| 2025-08-12 | 13F | Coston, McIsaac & Partners | 81 | 0.00 | 0 | |||||
| 2025-08-08 | 13F | Smithfield Trust Co | 7,425 | 17.86 | 0 | |||||
| 2025-08-12 | 13F | Marshall & Sterling Wealth Advisors Inc. | 82,600 | -3.22 | 4,294 | 1.42 | ||||
| 2025-04-18 | 13F | Optivise Advisory Services LLC | 0 | -100.00 | 0 | |||||
| 2025-08-11 | 13F | Citigroup Inc | 800 | 0.00 | 42 | 5.13 | ||||
| 2025-07-16 | 13F | New Insight Wealth Advisors | 20,598 | 1,072 | ||||||
| 2025-07-31 | 13F | Glass Jacobson Investment Advisors llc | 452 | -70.46 | 24 | -69.74 | ||||
| 2025-08-14 | 13F | Ieq Capital, Llc | 0 | -100.00 | 0 | |||||
| 2025-08-07 | 13F | CENTRAL TRUST Co | 0 | 0 | ||||||
| 2025-09-02 | 13F/A | FSC Wealth Advisors, LLC | 10,816 | -2.41 | 563 | 2.37 | ||||
| 2025-07-17 | 13F | Janney Montgomery Scott LLC | 53,594 | 55.81 | 3 | 100.00 | ||||
| 2025-08-04 | 13F | Daymark Wealth Partners, Llc | 8,876 | -44.08 | 462 | -41.42 | ||||
| 2025-08-11 | 13F | Cornerstone Planning Group LLC | 110 | 6 | ||||||
| 2025-08-13 | 13F | Twin Peaks Wealth Advisors, LLC | 433 | 24 | ||||||
| 2025-07-14 | 13F | Sweeney & Michel, Llc | 17,497 | 0.87 | 931 | 23.02 | ||||
| 2025-07-29 | NP | EBI - Longview Advantage ETF | 0 | -100.00 | 0 | -100.00 | ||||
| 2025-07-16 | 13F | Perigon Wealth Management, LLC | 23,530 | -1.99 | 1,224 | 2.86 | ||||
| 2025-08-04 | 13F | Wealth Management Associates, Inc. | 8,906 | -0.35 | 463 | 4.51 | ||||
| 2025-08-01 | 13F | Private Wealth Partners, LLC | 22,800 | 0.00 | 1,186 | 4.96 | ||||
| 2025-08-13 | 13F | Victory Financial Group, Llc | 450,340 | 10.44 | 23,427 | 16.93 | ||||
| 2025-07-18 | 13F | Consolidated Planning Corp | 22,798 | -1.37 | 1,186 | 3.40 | ||||
| 2025-08-05 | 13F | Carolinas Wealth Consulting Llc | 0 | -100.00 | 0 | -100.00 | ||||
| 2025-08-08 | 13F | Avalon Trust Co | 400 | 0.00 | 21 | 5.26 | ||||
| 2025-08-08 | 13F | IMA Wealth, Inc. | 560 | 0.00 | 29 | 7.41 | ||||
| 2025-05-14 | 13F | CIBC Private Wealth Group, LLC | 0 | -100.00 | 0 | |||||
| 2025-07-17 | 13F | Melfa Wealth Management, Llc | 18,929 | 1.92 | 985 | 6.84 | ||||
| 2025-08-18 | 13F/A | Kestra Investment Management, LLC | 314,688 | 6.94 | 16,370 | 12.16 | ||||
| 2025-07-10 | 13F | Redhawk Wealth Advisors, Inc. | 27,672 | 1,439 | ||||||
| 2025-07-14 | 13F | Sowell Financial Services LLC | 19,903 | 26.86 | 1,035 | 33.03 | ||||
| 2025-08-25 | 13F | Silverlake Wealth Management Llc | 25,076 | 1,304 | ||||||
| 2025-08-08 | 13F | Horrell Capital Management, Inc. | 750 | 39 | ||||||
| 2025-08-06 | 13F | AE Wealth Management LLC | 44,850 | -44.81 | 2,333 | -42.11 | ||||
| 2025-08-11 | 13F | Nations Financial Group Inc, /ia/ /adv | 5,665 | -7.16 | 295 | -2.65 | ||||
| 2025-07-16 | 13F | Novem Group | 4,908 | 0.10 | 255 | 4.94 | ||||
| 2025-08-11 | 13F | Pin Oak Investment Advisors Inc | 0 | -100.00 | 0 | |||||
| 2025-08-05 | 13F | Sigma Planning Corp | 28,168 | 2.75 | 1,465 | 7.80 | ||||
| 2025-07-31 | 13F | Oppenheimer & Co Inc | 88,142 | 9.33 | 4,585 | 14.68 | ||||
| 2025-08-07 | 13F | PFG Advisors | 0 | -100.00 | 0 | |||||
| 2025-08-14 | 13F | Advisor OS, LLC | 7,504 | 0.00 | 390 | 4.84 | ||||
| 2025-08-08 | 13F | SageOak Financial, LLC | 6,129 | -39.36 | 319 | -36.53 | ||||
| 2025-07-15 | 13F | Fifth Third Bancorp | 100 | 0.00 | 5 | 25.00 | ||||
| 2025-07-02 | 13F | Central Pacific Bank - Trust Division | 58 | 0.00 | 3 | 50.00 | ||||
| 2025-07-22 | 13F | Iron Horse Wealth Management, LLC | 0 | -100.00 | 0 | |||||
| 2025-07-16 | 13F | Brown, Lisle/cummings, Inc. | 10,025 | 0.00 | 522 | 4.83 | ||||
| 2025-08-11 | 13F | Slagle Financial, LLC | 46,387 | -58.04 | 2,413 | -55.98 | ||||
| 2025-05-15 | 13F/A | Orion Portfolio Solutions, LLC | 72,138 | 3,578 | ||||||
| 2025-07-14 | 13F | AdvisorNet Financial, Inc | 113,906 | 2.98 | 5,925 | 8.00 | ||||
| 2025-07-22 | 13F | Valley National Advisers Inc | 7,945 | 10.61 | 0 | |||||
| 2025-08-14 | 13F/A | Rockefeller Capital Management L.P. | 143,911 | 1.35 | 7,486 | 6.29 | ||||
| 2025-07-25 | 13F | Verdence Capital Advisors LLC | 8,053 | 0.00 | 419 | 4.76 | ||||
| 2025-07-18 | 13F | Childress Capital Advisors, Llc | 826,517 | -3.22 | 42,995 | 1.50 | ||||
| 2025-07-15 | 13F | LVZ Advisors, Inc. | 18,826 | 10.53 | 979 | 16.00 | ||||
| 2025-08-12 | 13F | Jpmorgan Chase & Co | 935,539 | -2.82 | 48,667 | 1.92 | ||||
| 2025-08-08 | 13F | Pnc Financial Services Group, Inc. | 53 | -52.25 | 3 | -60.00 | ||||
| 2025-07-17 | 13F | KWB Wealth | 69,956 | 3,470 | ||||||
| 2025-07-30 | 13F | Financial Perspectives, Inc | 5,319 | 23.53 | 277 | 29.58 | ||||
| 2025-08-07 | 13F | Shared Vision Wealth Group LLC | 5,700 | 0.00 | 305 | 8.16 | ||||
| 2025-08-13 | 13F | Brown Advisory Inc | 6,146 | 320 | ||||||
| 2025-08-15 | 13F | Kestra Advisory Services, LLC | 560,055 | 50.92 | 29,134 | 58.29 | ||||
| 2025-08-12 | 13F | Global Retirement Partners, LLC | 75,273 | 113.18 | 3,916 | 122.06 | ||||
| 2025-08-04 | 13F | Pensionmark Financial Group, Llc | 222,614 | 2.58 | 11,580 | 7.59 | ||||
| 2025-08-07 | 13F | Summit X, LLC | 20,853 | 1,085 | ||||||
| 2025-08-14 | 13F | Jane Street Group, Llc | 524,699 | 301.86 | 27,295 | 321.46 | ||||
| 2025-07-16 | 13F | Rainier Family Wealth Inc | 0 | -100.00 | 0 | |||||
| 2025-07-29 | 13F | Stratos Wealth Partners, LTD. | 11,085 | 81.72 | 577 | 90.73 | ||||
| 2025-07-31 | 13F | Cambridge Investment Research Advisors, Inc. | 732,456 | 9.93 | 38 | 15.15 | ||||
| 2025-07-17 | 13F | Oakworth Capital, Inc. | 131 | 0.00 | 7 | 0.00 | ||||
| 2025-07-21 | 13F | Financial Services Advisory Inc | 141,107 | 93.25 | 7,340 | 102.71 | ||||
| 2025-07-15 | 13F | Axis Wealth Partners, LLC | 66,590 | 7.39 | 3,464 | 12.65 | ||||
| 2025-07-24 | 13F | Cyndeo Wealth Partners, LLC | 14,187 | 14.67 | 738 | 20.39 | ||||
| 2025-07-08 | 13F | Ballew Advisors, Inc | 29,265 | 0.85 | 1,556 | 15.95 | ||||
| 2025-08-18 | 13F | Front Row Advisors LLC | 282 | 15 | ||||||
| 2025-07-10 | 13F | High Net Worth Advisory Group LLC | 15,129 | 0.00 | 787 | 4.93 | ||||
| 2025-07-16 | 13F | Marmo Financial Group, LLC | 117,146 | 3.38 | 6,094 | 8.42 | ||||
| 2025-08-05 | 13F | GPS Wealth Strategies Group, LLC | 111,442 | 41.70 | 5,797 | 48.64 | ||||
| 2025-08-19 | 13F | Newbridge Financial Services Group, Inc. | 4,853 | -7.65 | 252 | -3.08 | ||||
| 2025-08-07 | 13F | New England Private Wealth Advisors LLC | 6,372 | 0.66 | 343 | 9.58 | ||||
| 2025-07-09 | 13F | Fiduciary Alliance LLC | 4,599 | 239 | ||||||
| 2025-08-13 | 13F | Smith, Moore & Co. | 5,895 | 0.00 | 307 | 4.79 | ||||
| 2025-08-14 | 13F | Gallagher Fiduciary Advisors, LLC | 14,912 | -88.08 | 776 | -87.50 | ||||
| 2025-08-12 | 13F | SRS Capital Advisors, Inc. | 8,706 | 0.00 | 453 | 4.87 | ||||
| 2025-07-28 | 13F | Sagespring Wealth Partners, Llc | 585,625 | 8.99 | 30,464 | 14.31 | ||||
| 2025-08-13 | 13F | Milestone Investment Advisors LLC | 319,085 | 2.96 | 16,599 | 7.98 | ||||
| 2025-08-04 | 13F | Savvy Advisors, Inc. | 17,497 | -5.00 | 910 | -0.33 | ||||
| 2025-07-17 | 13F | Investment Advisory Services Inc /tx /adv | 61,911 | 3,221 | ||||||
| 2025-05-07 | 13F | Spectrum Wealth Counsel, LLC | 135 | 0.00 | 7 | 0.00 | ||||
| 2025-08-26 | NP | EVVLX - The E-Valuator Very Conservative (0%-15%) RMS Fund Service Class Shares | 1,588 | 43.19 | 83 | 49.09 | ||||
| 2025-07-24 | 13F | JNBA Financial Advisors | 516 | 0.98 | 27 | 4.00 | ||||
| 2025-07-14 | 13F | Signature Securities Group Corporation | 49,362 | 625.38 | 2,568 | 661.72 | ||||
| 2025-07-30 | 13F | TFB Advisors LLC | 4,879 | 20.38 | 254 | 25.87 | ||||
| 2025-07-09 | 13F | Lineweaver Wealth Advisors, LLC | 114,122 | -0.60 | 5,937 | 4.25 | ||||
| 2025-07-11 | 13F | Mkd Wealth Coaches, Llc | 4,481 | 233 | ||||||
| 2025-07-02 | 13F | HBW Advisory Services LLC | 55,256 | 35.00 | 2,874 | 41.58 | ||||
| 2025-08-14 | 13F | UBS Group AG | 952 | 95,100.00 | 50 | |||||
| 2025-07-23 | 13F | Wise Wealth Partners | 0 | -100.00 | 0 | |||||
| 2025-08-11 | 13F | Brass Tax Wealth Management, Inc | 10,064 | 16.24 | 524 | 21.91 | ||||
| 2025-08-08 | 13F | Kingsview Wealth Management, LLC | 41,195 | -5.99 | 2,143 | -1.43 | ||||
| 2025-07-30 | 13F | Bogart Wealth, LLC | 1,104 | 37.48 | 57 | 46.15 | ||||
| 2025-08-07 | 13F | Flagship Wealth Advisors, Llc | 188,529 | 32.89 | 9,807 | 39.38 | ||||
| 2025-08-13 | 13F | WCG Wealth Advisors LLC | 84,247 | -4.25 | 4,383 | 0.41 | ||||
| 2025-08-05 | 13F | Advisors Preferred, LLC | 0 | -100.00 | 0 | |||||
| 2025-08-06 | 13F | RFG - Bristol Wealth Advisors, LLC | 31,766 | 1,652 | ||||||
| 2025-04-11 | 13F | Permanent Capital Management, LP | 7,097 | 352 | ||||||
| 2025-08-26 | NP | EVMLX - The E-Valuator Moderate (50%-70%) RMS Fund Service Class Shares | 57,068 | 20.93 | 2,969 | 26.84 | ||||
| 2025-07-22 | 13F | Brown Miller Wealth Management, LLC | 8,600 | -5.49 | 447 | -0.89 | ||||
| 2025-08-15 | 13F | Fsb Premier Wealth Management, Inc. | 4,661 | 0.32 | 242 | 5.22 | ||||
| 2025-08-14 | 13F | Citadel Advisors Llc | Call | 8,500 | -30.33 | 442 | -26.94 | |||
| 2025-08-14 | 13F | Citadel Advisors Llc | 203,806 | 687.17 | 10,602 | 725.62 | ||||
| 2025-08-01 | 13F | Y-Intercept (Hong Kong) Ltd | 14,782 | 769 | ||||||
| 2025-08-19 | 13F | Advisory Services Network, LLC | 157,024 | 15.27 | 8,405 | 24.41 | ||||
| 2025-08-01 | 13F | Chilton Capital Management Llc | 409 | 0.00 | 21 | 5.00 | ||||
| 2025-08-11 | 13F | PFG Private Wealth Management, LLC | 0 | -100.00 | 0 | |||||
| 2025-08-19 | 13F | Anchor Investment Management, LLC | 3,855 | 0.36 | 201 | 5.26 | ||||
| 2025-07-08 | 13F | Nbc Securities, Inc. | 6,625 | 42.11 | 0 | |||||
| 2025-08-04 | 13F | Spire Wealth Management | 18 | 0.00 | 1 | |||||
| 2025-07-24 | 13F | IFP Advisors, Inc | 161,837 | 6.61 | 8,419 | 11.81 | ||||
| 2025-08-26 | NP | EVGLX - The E-Valuator Growth (70%-85%) RMS Fund Service Class Shares | 110,579 | -0.95 | 5,752 | 3.88 | ||||
| 2025-07-31 | 13F | Prentice Wealth Management LLC | 238,266 | 8.11 | 12,395 | 13.38 | ||||
| 2025-08-13 | 13F | Baker Avenue Asset Management, LP | 4,038 | -0.86 | 210 | 3.96 | ||||
| 2025-08-14 | 13F | Citadel Advisors Llc | Put | 4,100 | 141.18 | 213 | 153.57 | |||
| 2025-07-30 | 13F | D.a. Davidson & Co. | 124,675 | 13.03 | 6,486 | 18.56 | ||||
| 2025-08-14 | 13F | Raymond James Financial Inc | 1,021,750 | 12.99 | 53,151 | 18.50 | ||||
| 2025-07-17 | 13F | Fifth Third Securities, Inc. | 210,364 | 34.72 | 10,943 | 41.31 | ||||
| 2025-07-17 | 13F | Barry Investment Advisors, LLC | 41,908 | 1.38 | 2,180 | 6.34 | ||||
| 2025-07-25 | 13F | Ellis Investment Partners, LLC | 4,828 | 5.23 | 251 | 10.57 | ||||
| 2025-08-04 | 13F | IFG Advisory, LLC | 12,034 | 0.76 | 626 | 5.74 | ||||
| 2025-07-07 | 13F | Centurion Wealth Management LLC | 5,688 | -3.27 | 296 | 0.68 | ||||
| 2025-07-25 | 13F | Carbahal Olsen Financial Services Group, LLC | 123,754 | 1.35 | 6,438 | 6.29 | ||||
| 2025-07-25 | 13F | Atria Wealth Solutions, Inc. | 226,140 | 309.79 | 11,771 | 330.07 | ||||
| 2025-08-11 | 13F | TD Waterhouse Canada Inc. | 611 | 32 | ||||||
| 2025-08-26 | 13F/A | Thrivent Financial For Lutherans | 96,229 | 18.50 | 5 | 25.00 | ||||
| 2025-08-14 | 13F | Sunbelt Securities, Inc. | 16,933 | -4.66 | 846 | -3.98 | ||||
| 2025-08-05 | 13F | Mission Wealth Management, Lp | 7,580 | 15.94 | 394 | 21.60 | ||||
| 2025-07-15 | 13F | Centerline Wealth Advisors, LLC | 66,914 | 3,481 | ||||||
| 2025-08-12 | 13F | Investor's Fiduciary Advisor Network, LLC | 12,790 | 16.62 | 1 | |||||
| 2025-07-28 | 13F | Harbour Investments, Inc. | 40,142 | 1.53 | 2,088 | 6.53 | ||||
| 2025-07-29 | 13F | BXM Wealth LLC | 16,000 | 0.00 | 832 | 4.92 | ||||
| 2025-08-04 | 13F | Integrity Alliance, Llc. | 44,860 | 1.30 | 2,334 | 6.24 | ||||
| 2025-08-08 | 13F | Avantax Advisory Services, Inc. | 457,765 | 5.71 | 23,813 | 10.87 | ||||
| 2025-08-14 | 13F | Synovus Financial Corp | 16,167 | 0.00 | 841 | 4.99 | ||||
| 2025-08-21 | 13F | Pathway Financial Advisers, LLC | 51,568 | 5.49 | 2,683 | 10.64 | ||||
| 2025-08-08 | 13F | Hartland & Co., LLC | 827 | 0.00 | 43 | 4.88 | ||||
| 2025-08-12 | 13F | Jaffetilchin Investment Partners, LLC | 6,364 | 0.87 | 331 | 6.09 | ||||
| 2025-08-12 | 13F | MWA Asset Management | 5,298 | -4.51 | 276 | 0.00 | ||||
| 2025-04-28 | 13F | Strategic Financial Concepts, LLC | 0 | -100.00 | 0 | -100.00 | ||||
| 2025-07-11 | 13F | Farther Finance Advisors, LLC | 212 | 0.95 | 11 | 10.00 | ||||
| 2025-07-22 | 13F | Sage Investment Counsel LLC | 0 | -100.00 | 0 | |||||
| 2025-07-30 | 13F | Strategic Blueprint, LLC | 77,812 | 981.17 | 4,048 | 1,036.80 | ||||
| 2025-07-24 | 13F | Us Bancorp \de\ | 4,390 | -0.72 | 228 | 4.11 | ||||
| 2025-08-14 | 13F | Bank Of America Corp /de/ | 1,654,774 | 10.88 | 86,081 | 16.29 | ||||
| 2025-07-29 | 13F | Level Wealth Management LLC | 4,297 | 0.82 | 224 | 5.69 | ||||
| 2025-08-13 | 13F | Mayfair Advisory Group, LLC | 30,977 | 61.84 | 1,681 | 77.03 | ||||
| 2025-08-13 | 13F | Capital Analysts, Inc. | 1,075 | 0.66 | 0 | |||||
| 2025-07-14 | 13F | Kfg Wealth Management, Llc | 29,139 | 27.99 | 1,516 | 34.19 | ||||
| 2025-08-12 | 13F | MAI Capital Management | 49,713 | 0.85 | 2,586 | 5.81 | ||||
| 2025-08-11 | 13F | Private Advisor Group, LLC | 107,659 | 11.47 | 5,600 | 16.91 | ||||
| 2025-07-22 | 13F | Merit Financial Group, LLC | 16,849 | 39.42 | 876 | 46.24 | ||||
| 2025-08-14 | 13F | Glen Eagle Advisors, LLC | 2,000 | 0.00 | 104 | 5.05 | ||||
| 2025-08-13 | 13F | EverSource Wealth Advisors, LLC | 11 | 0.00 | 1 | |||||
| 2025-07-11 | 13F | LongView Wealth Management | 17,677 | 0.96 | 920 | 5.88 | ||||
| 2025-08-06 | 13F | Moors & Cabot, Inc. | 8,097 | -1.22 | 421 | 3.69 | ||||
| 2025-08-08 | 13F | Independence Financial Advisors, LLC | 174,552 | 6.60 | 9,080 | 11.81 | ||||
| 2025-07-28 | 13F | JGP Wealth Management, LLC | 8,807 | 458 | ||||||
| 2025-08-08 | 13F | POM Investment Strategies, LLC | 0 | -100.00 | 0 | |||||
| 2025-07-30 | 13F | Rehmann Capital Advisory Group | 5,692 | 0.00 | 296 | 4.96 | ||||
| 2025-08-08 | 13F | Mjp Associates Inc /adv | 4,407 | 0.00 | 229 | 5.05 | ||||
| 2025-05-14 | 13F | Absolute Capital Management, LLC | 0 | -100.00 | 0 | |||||
| 2025-08-04 | 13F | Assetmark, Inc | 473 | 80.53 | 25 | 84.62 | ||||
| 2025-07-10 | 13F | Wealth Enhancement Advisory Services, Llc | 103,727 | -2.95 | 5,516 | 4.06 | ||||
| 2025-08-12 | 13F | Change Path, LLC | 5,643 | 22.97 | 294 | 29.07 | ||||
| 2025-08-15 | 13F | Keel Point, LLC | 7,433 | 0.00 | 387 | 4.89 | ||||
| 2025-08-01 | 13F | Gwn Securities Inc. | 7,829 | 407 | ||||||
| 2025-08-06 | 13F | Commonwealth Equity Services, Llc | 3,348,866 | -2.61 | 174 | 2.35 | ||||
| 2025-08-13 | 13F | StoneX Group Inc. | 11,532 | 600 | ||||||
| 2025-08-14 | 13F | Warren Averett Asset Management, LLC | 19,029 | 5.87 | 990 | 11.00 | ||||
| 2025-08-14 | 13F | Integrated Wealth Concepts LLC | 393,153 | 2.43 | 20,452 | 7.43 | ||||
| 2025-07-28 | 13F | Perfromance Wealth Partners, LLC | 107,637 | 5,599 | ||||||
| 2025-08-11 | 13F | Greykasell Wealth Strategies, Inc. | 4,835 | 0.00 | 252 | 5.02 | ||||
| 2025-07-29 | 13F | Primoris Wealth Advisors, Llc | 37,208 | -5.53 | 1,936 | -0.92 | ||||
| 2025-08-05 | 13F | Westside Investment Management, Inc. | 25,974 | 15.62 | 1,351 | 21.27 | ||||
| 2025-08-05 | 13F | Bank Of Montreal /can/ | 4,512 | 3.68 | 235 | 8.84 | ||||
| 2025-08-08 | 13F | Citizens Financial Group Inc/ri | 111,005 | 2,042.13 | 5,774 | 2,146.69 | ||||
| 2025-07-23 | 13F | Foresight Capital Management Advisors, Inc. | 72,825 | 3.39 | 3,788 | 8.45 | ||||
| 2025-07-25 | 13F | Concurrent Investment Advisors, LLC | 36,454 | -14.58 | 1,896 | -10.40 | ||||
| 2025-07-11 | 13F | SILVER OAK SECURITIES, Inc | 53,585 | 3.41 | 2,788 | 9.51 | ||||
| 2025-08-14 | 13F | Mariner, LLC | 263,488 | 34.73 | 13,707 | 41.30 | ||||
| 2025-07-10 | 13F | Oliver Lagore Vanvalin Investment Group | 100 | 100.00 | 5 | 100.00 | ||||
| 2025-08-19 | 13F | Asset Dedication, LLC | 191 | 10 | ||||||
| 2025-07-31 | 13F | Briaud Financial Planning, Inc | 52 | 0 | ||||||
| 2025-05-01 | 13F | Fulcrum Equity Management | 0 | -100.00 | 0 | |||||
| 2025-07-16 | 13F | Independent Wealth Network Inc. | 7,612 | 7.79 | 396 | 12.86 | ||||
| 2025-08-08 | 13F | Larson Financial Group LLC | 7,857 | 6.18 | 409 | 11.17 | ||||
| 2025-07-17 | 13F | Sound Income Strategies, LLC | 48 | 0.00 | 3 | 0.00 | ||||
| 2025-07-10 | 13F | Sovran Advisors, LLC | 37,690 | -12.23 | 1,990 | -0.50 | ||||
| 2025-08-13 | 13F | Russell Investments Group, Ltd. | 123 | 6 | ||||||
| 2025-08-08 | 13F | Biondo Investment Advisors, LLC | 37,180 | 3.39 | 1,934 | 8.47 | ||||
| 2025-08-12 | 13F | Zacks Investment Management | 0 | -100.00 | 0 | |||||
| 2025-08-08 | 13F | Tortoise Investment Management, LLC | 100 | 0.00 | 5 | 25.00 | ||||
| 2025-07-25 | 13F | Cwm, Llc | 1,392 | -19.86 | 0 | |||||
| 2025-08-14 | 13F | LaSalle St. Investment Advisors, LLC | 14,722 | -0.16 | 1 | |||||
| 2025-07-23 | 13F | Lakeshore Capital Group, Inc. | 5,577 | 0.18 | 290 | 5.07 | ||||
| 2025-07-09 | 13F | Dynamic Advisor Solutions LLC | 5,137 | 267 | ||||||
| 2025-08-01 | 13F | Liberty Wealth Management Llc | 5,399 | 0.69 | 281 | 5.66 | ||||
| 2025-08-06 | 13F | ZEGA Investments, LLC | 4,407 | 0.00 | 229 | 5.05 | ||||
| 2025-08-04 | 13F | Keybank National Association/oh | 6,883 | 358 | ||||||
| 2025-08-13 | 13F | First Trust Advisors Lp | 4,512 | 0.00 | 235 | 4.93 | ||||
| 2025-08-14 | 13F | Colony Group, LLC | 6,288 | 327 | ||||||
| 2025-08-14 | 13F | Mercer Global Advisors Inc /adv | 32,346 | 7.17 | 1,683 | 12.36 | ||||
| 2025-08-11 | 13F | Tidemark, LLC | 3,210 | 66.75 | 167 | 74.74 | ||||
| 2025-08-04 | 13F | Atria Investments Llc | 38,303 | -76.10 | 1,993 | -74.94 | ||||
| 2025-08-11 | 13F | Principal Securities, Inc. | 73,195 | 44.57 | 3,808 | 50.59 | ||||
| 2025-07-21 | 13F | Fairvoy Private Wealth, LLC | 7,680 | 4.32 | 400 | 9.32 | ||||
| 2025-07-16 | 13F | Castleview Partners, Llc | 54,094 | 107.22 | 2,814 | 117.39 | ||||
| 2025-08-12 | 13F | LPL Financial LLC | 2,758,206 | 25.32 | 143,482 | 31.44 | ||||
| 2025-07-18 | 13F | PFG Investments, LLC | 29,398 | 121.29 | 1,529 | 132.37 | ||||
| 2025-08-06 | 13F | Founders Financial Securities Llc | 13,594 | 707 | ||||||
| 2025-07-15 | 13F | Accurate Wealth Management, LLC | 13,852 | 2.03 | 739 | 17.68 | ||||
| 2025-08-05 | 13F | Atlas Private Wealth Advisors | 5,630 | 293 | ||||||
| 2025-07-21 | 13F | Precedent Wealth Partners, Llc | 25,894 | -1.24 | 1,347 | 3.62 | ||||
| 2025-08-14 | 13F/A | Skopos Labs, Inc. | 1,643 | -41.86 | 85 | -39.29 | ||||
| 2025-08-13 | 13F | Baird Financial Group, Inc. | 78,826 | 4,101 |