Mga Batayang Estadistika
| Pemilik Institusional | 235 total, 231 long only, 0 short only, 4 long/short - change of 5.38% MRQ |
| Alokasi Portofolio Rata-rata | 0.1604 % - change of 12.28% MRQ |
| Saham Institusional (Jangka Panjang) | 56,008,368 (ex 13D/G) - change of 1.02MM shares 1.85% MRQ |
| Nilai Institusional (Jangka Panjang) | $ 1,534,222 USD ($1000) |
Kepemilikan Institusional dan Pemegang Saham
Fresenius Medical Care AG - Depositary Receipt (Common Stock) (US:FMS) memiliki 235 pemilik institusional dan pemegang saham yang telah mengajukan formulir 13D/G atau 13F kepada Komisi Bursa Efek (Securities Exchange Commission/SEC). Lembaga-lembaga ini memegang total 56,008,368 saham. Pemegang saham terbesar meliputi Pzena Investment Management Llc, VWNDX - Vanguard Windsor Fund Investor Shares, Fiduciary Management Inc /wi/, Dodge & Cox, DODBX - Dodge & Cox Balanced Fund, VASVX - Vanguard Selected Value Fund Investor Shares, Morgan Stanley, FMIHX - Large Cap Fund Investor Class, Todd Asset Management Llc, and Liberty All Star Equity Fund .
Struktur kepemilikan institusional Fresenius Medical Care AG - Depositary Receipt (Common Stock) (NYSE:FMS) menunjukkan posisi terkini di perusahaan oleh institusi dan dana, serta perubahan terbaru dalam ukuran posisi. Pemegang saham utama dapat mencakup investor individu, reksa dana, dana lindung nilai, atau institusi. Jadwal 13D menunjukkan bahwa investor memegang (atau pernah memegang) lebih dari 5% saham perusahaan dan bermaksud (atau pernah bermaksud) untuk secara aktif mengejar perubahan strategi bisnis. Jadwal 13G menunjukkan investasi pasif lebih dari 5%.
The share price as of September 5, 2025 is 24.77 / share. Previously, on September 6, 2024, the share price was 19.68 / share. This represents an increase of 25.86% over that period.

Skor Sentimen Dana
Skor Sentimen Dana (sebelumnya dikenal sebagai Skor Akumulasi Kepemilikan) menemukan saham-saham yang paling banyak dibeli oleh dana. Ini adalah hasil dari model kuantitatif multi-faktor yang canggih yang mengidentifikasi perusahaan dengan tingkat akumulasi institusional tertinggi. Model penilaian menggunakan kombinasi dari total peningkatan pemilik yang diungkapkan, perubahan dalam alokasi portofolio pada pemilik tersebut, dan metrik lainnya. Angka berkisar dari 0 hingga 100, dengan angka yang lebih tinggi menunjukkan tingkat akumulasi yang lebih tinggi dibandingkan dengan perusahaan sejenisnya, dan 50 adalah rata-ratanya.
Frekuensi Pembaruan: Setiap Hari
Lihat Ownership Explorer, yang menyediakan daftar perusahaan dengan peringkat tertinggi.
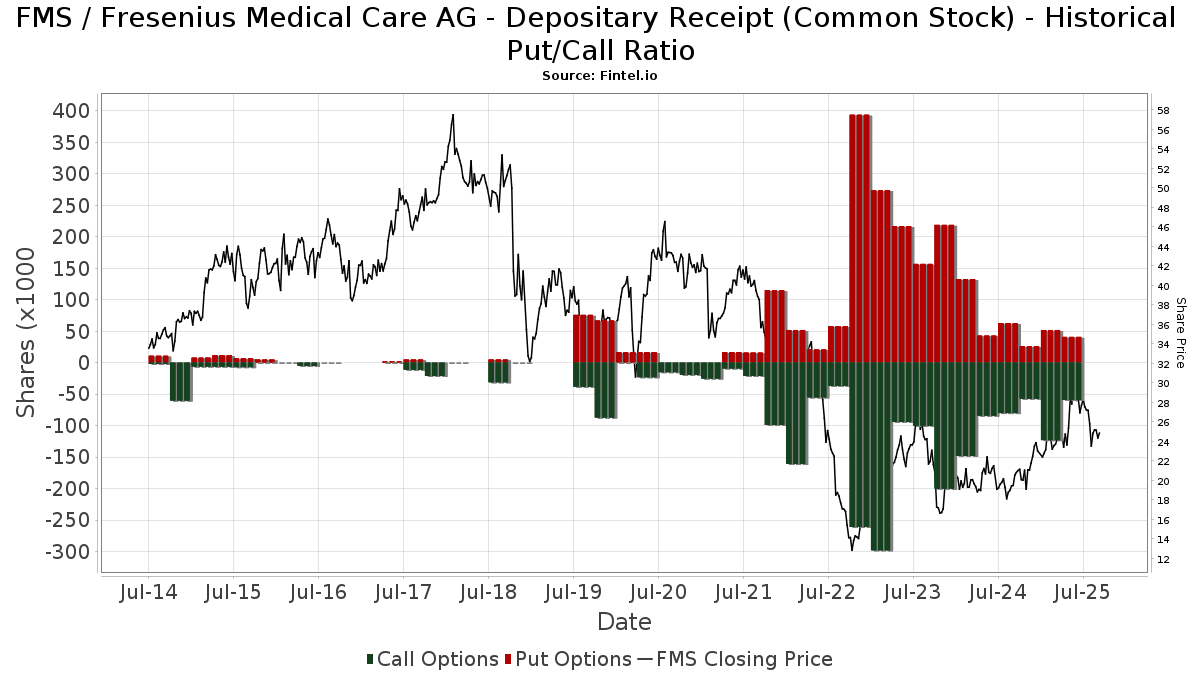
Rasio Put/Call Institusional
Selain melaporkan isu ekuitas dan utang standar, institusi dengan aset di bawah manajemen lebih dari 100 juta dolar AS juga harus mengungkapkan kepemilikan opsi put dan call mereka. Karena opsi put umumnya menunjukkan sentimen negatif, dan opsi call menunjukkan sentimen positif, kita dapat mengetahui sentimen institusional secara keseluruhan dengan memplot rasio put terhadap call. Grafik di sebelah kanan memplot rasio put/call historis untuk instrumen ini.
Menggunakan Rasio Put/Call sebagai indikator sentimen investor mengatasi salah satu kekurangan utama dari penggunaan total kepemilikan institusional, yaitu sejumlah besar aset yang dikelola diinvestasikan secara pasif untuk melacak indeks. Dana yang dikelola secara pasif biasanya tidak membeli opsi, sehingga indikator rasio put/call lebih akurat dalam melacak sentimen dana yang dikelola secara aktif.
Pengajuan 13D/G
Kami menyajikan pengajuan 13D/G secara terpisah dari pengajuan 13F karena perlakuan yang berbeda oleh SEC. Pengajuan 13D/G dapat diajukan oleh kelompok investor (dengan satu pemimpin), sedangkan pengajuan 13F tidak bisa. Hal ini mengakibatkan situasi di mana seorang investor dapat mengajukan 13D/G yang melaporkan satu nilai untuk total saham (mewakili semua saham yang dimiliki oleh kelompok investor), tetapi kemudian mengajukan 13F yang melaporkan nilai yang berbeda untuk total saham (mewakili kepemilikan mereka sendiri). Ini berarti bahwa kepemilikan saham dari pengajuan 13D/G dan pengajuan 13F seringkali tidak dapat dibandingkan secara langsung, sehingga kami menyajikannya secara terpisah.
Catatan: Mulai 16 Mei 2021, kami tidak lagi menampilkan pemilik yang belum mengajukan 13D/G dalam setahun terakhir. Sebelumnya, kami menampilkan riwayat lengkap pengajuan 13D/G. Secara umum, entitas yang diwajibkan untuk mengajukan pengajuan 13D/G harus mengajukan setidaknya setiap tahun sebelum mengirimkan pengajuan penutupan. Namun, terkadang dana keluar dari posisi tanpa mengirimkan pengajuan penutupan (misalnya, mereka menghentikan operasi), sehingga menampilkan riwayat lengkap terkadang menyebabkan kebingungan tentang kepemilikan saat ini. Untuk mencegah kebingungan, kami sekarang hanya menampilkan pemilik 'saat ini' - yaitu - pemilik yang telah mengajukan dalam setahun terakhir.
Upgrade to unlock premium data.
| Tanggal File | Formulir | Investor | Sebelumnya Saham |
Terbaru Saham |
Δ Saham (Persen) |
Kepemilikan (Persen) |
Δ Pagmamay-ari (Persen) |
|
|---|---|---|---|---|---|---|---|---|
| 2025-03-10 | Fresenius SE & Co. KGaA | 94,380,382 | 83,780,382 | -11.23 | 28.60 | -11.18 | ||
| 2025-02-14 | HARRIS ASSOCIATES L P | 15,173,585 | 11,717,575 | -22.78 | 3.90 | -24.56 |
Pengajuan 13F dan NPORT
Detail pada pengajuan 13F tersedia gratis. Detail pada pengajuan NP memerlukan keanggotaan premium. Baris berwarna hijau menunjukkan posisi baru. Baris berwarna merah menunjukkan posisi yang sudah ditutup. Klik tautan ini ikon untuk melihat riwayat transaksi selengkapnya.
Tingkatkan
untuk membuka data premium dan mengekspor ke Excel ![]() .
.
| Tanggal File | Sumber | Investor | Ketik | Presyo ng Avg (Silangan) |
Saham | Δ Saham (%) |
Dilaporkan Nilai ($1000) |
Nilai Δ (%) |
Alokasi Port (%) |
|
|---|---|---|---|---|---|---|---|---|---|---|
| 2025-07-24 | 13F | Us Bancorp \de\ | 75,660 | 225.53 | 2,162 | 273.88 | ||||
| 2025-06-26 | NP | Elevation Series Trust - The Opal International Dividend Income ETF | 0 | -100.00 | 0 | -100.00 | ||||
| 2025-08-11 | 13F | Hexagon Capital Partners LLC | 0 | -100.00 | 0 | |||||
| 2025-07-24 | 13F | IFP Advisors, Inc | 464 | 0.00 | 13 | 18.18 | ||||
| 2025-07-30 | 13F | Loring Wolcott & Coolidge Fiduciary Advisors Llp/ma | 926 | 0.00 | 26 | 23.81 | ||||
| 2025-08-11 | 13F | HighTower Advisors, LLC | 16,640 | -4.14 | 475 | 9.95 | ||||
| 2025-08-05 | 13F | NewSquare Capital LLC | 151 | 788.24 | 4 | |||||
| 2025-08-14 | 13F | Mml Investors Services, Llc | 22,911 | 26.92 | 1 | |||||
| 2025-05-15 | 13F | Virtus Investment Advisers, Inc. | 0 | -100.00 | 0 | |||||
| 2025-07-16 | 13F | Signaturefd, Llc | 7,423 | 3.25 | 212 | 18.44 | ||||
| 2025-08-05 | 13F | Huntington National Bank | 2,355 | 219.54 | 67 | 272.22 | ||||
| 2025-08-14 | 13F | Engineers Gate Manager LP | 25,874 | 739 | ||||||
| 2025-08-07 | 13F | Zions Bancorporation, National Association /ut/ | 17 | 0.00 | 0 | |||||
| 2025-08-13 | 13F | Northern Trust Corp | 422,727 | 11.17 | 12,077 | 27.56 | ||||
| 2025-04-28 | 13F | DAVENPORT & Co LLC | 0 | -100.00 | 0 | |||||
| 2025-07-09 | 13F | Veracity Capital LLC | 14,684 | -59.31 | 420 | -53.34 | ||||
| 2025-08-12 | 13F | Clearbridge Investments, LLC | 9,624 | -1.06 | 275 | 13.22 | ||||
| 2025-07-15 | 13F | Signet Financial Management, Llc | 30,261 | 3.39 | 865 | 18.68 | ||||
| 2025-08-08 | 13F | SG Americas Securities, LLC | 10,150 | -0.02 | 0 | |||||
| 2025-08-12 | 13F | MAI Capital Management | 152 | 4 | ||||||
| 2025-07-11 | 13F | Farther Finance Advisors, LLC | 768 | 0.39 | 22 | 16.67 | ||||
| 2025-08-13 | 13F | New York State Common Retirement Fund | 6,573 | 0.00 | 0 | |||||
| 2025-08-14 | 13F | UBS Group AG | 79,151 | 13.73 | 2,261 | 30.54 | ||||
| 2025-08-14 | 13F | Raymond James Financial Inc | 277,995 | -3.39 | 7,942 | 10.86 | ||||
| 2025-07-08 | 13F | Parallel Advisors, LLC | 3,838 | 2.13 | 110 | 17.20 | ||||
| 2025-04-22 | 13F | Mendota Financial Group, LLC | 0 | -100.00 | 0 | |||||
| 2025-08-13 | 13F | Todd Asset Management Llc | 1,239,113 | 156.92 | 35,402 | 194.79 | ||||
| 2025-08-14 | 13F | Bank Of America Corp /de/ | 337,316 | 279.69 | 9,637 | 335.67 | ||||
| 2025-05-14 | 13F | Colonial Trust Advisors | 0 | -100.00 | 0 | -100.00 | ||||
| 2025-08-12 | 13F | Atlas Capital Advisors Llc | 22,604 | 1.60 | 646 | 16.43 | ||||
| 2025-07-30 | 13F | Forum Financial Management, LP | 8,946 | -17.86 | 256 | -5.90 | ||||
| 2025-07-30 | 13F | Arbor Investment Advisors, LLC | 8,850 | 0.00 | 253 | 14.55 | ||||
| 2025-08-14 | 13F | Susquehanna International Group, Llp | Put | 22,700 | 47.40 | 649 | 69.19 | |||
| 2025-08-04 | 13F | Assetmark, Inc | 31,148 | 248.65 | 890 | 300.45 | ||||
| 2025-08-14 | 13F | Susquehanna International Group, Llp | Call | 56,000 | 400.00 | 1,600 | 475.18 | |||
| 2025-07-29 | NP | NIAGX - Nia Impact Solutions Fund | 44,380 | 1,260 | ||||||
| 2025-07-22 | 13F | Valley National Advisers Inc | 3,066 | -6.38 | 0 | |||||
| 2025-08-14 | 13F | Wetherby Asset Management Inc | 9,134 | -8.03 | 261 | 16.07 | ||||
| 2025-07-14 | 13F | UMA Financial Services, Inc. | 194 | -16.38 | 6 | 0.00 | ||||
| 2025-08-12 | 13F | American Century Companies Inc | 29,173 | 21.32 | 833 | 39.30 | ||||
| 2025-08-14 | 13F | Two Sigma Investments, Lp | 20,642 | -16.81 | 590 | -4.54 | ||||
| 2025-07-16 | 13F | Arlington Capital Management, Inc. | 89,930 | 2,569 | ||||||
| 2025-07-28 | NP | AVSD - Avantis Responsible International Equity ETF | 2,751 | 0.00 | 78 | 18.18 | ||||
| 2025-04-29 | 13F | Callan Capital, LLC | 13,974 | 6.64 | 348 | 17.23 | ||||
| 2025-07-17 | 13F | Uncommon Cents Investing LLC | 40,065 | -1.46 | 1,145 | 13.04 | ||||
| 2025-06-30 | NP | VASVX - Vanguard Selected Value Fund Investor Shares | 2,975,541 | -9.44 | 75,519 | -7.59 | ||||
| 2025-08-11 | 13F | GW&K Investment Management, LLC | 70 | 0.00 | 0 | |||||
| 2025-05-06 | 13F | Venturi Wealth Management, LLC | 0 | -100.00 | 0 | |||||
| 2025-07-29 | NP | SGLIX - SGI Global Equity Fund Class I Shares | 29,748 | 845 | ||||||
| 2025-08-12 | 13F | Charles Schwab Investment Management Inc | 41,618 | 16.59 | 1,189 | 33.90 | ||||
| 2025-06-26 | NP | DFIEX - International Core Equity Portfolio - Institutional Class This fund is a listed as child fund of Dimensional Fund Advisors Lp and if that institution has disclosed ownership in this security, then these positions will not be double counted when calculating total shares and total value | 1,074 | 0.00 | 27 | 3.85 | ||||
| 2025-08-11 | 13F | Cornerstone Planning Group LLC | 82 | 17.14 | 2 | 100.00 | ||||
| 2025-08-12 | 13F | Summit Global Investments | 7,675 | -86.76 | 0 | -100.00 | ||||
| 2025-08-11 | 13F | TD Waterhouse Canada Inc. | 1,256 | 36 | ||||||
| 2025-07-29 | NP | GINX - SGI Enhanced Global Income ETF | 17,644 | 501 | ||||||
| 2025-08-14 | 13F | Wells Fargo & Company/mn | 54,555 | -16.93 | 1,559 | -4.71 | ||||
| 2025-08-13 | 13F/A | StoneX Group Inc. | 0 | -100.00 | 0 | -100.00 | ||||
| 2025-08-13 | 13F | Russell Investments Group, Ltd. | 5,096 | 21.33 | 146 | 39.42 | ||||
| 2025-07-31 | 13F | Hartford Financial Management Inc. | 1,837 | -10.83 | 52 | 1.96 | ||||
| 2025-08-06 | 13F | First Horizon Advisors, Inc. | 176 | 417.65 | 5 | |||||
| 2025-08-13 | 13F | First Trust Advisors Lp | 18,873 | 0.40 | 539 | 15.17 | ||||
| 2025-08-13 | 13F | Quadrant Capital Group Llc | 17,952 | -0.99 | 513 | 13.53 | ||||
| 2025-07-25 | 13F | Yousif Capital Management, Llc | 9,804 | 6.81 | 280 | 22.81 | ||||
| 2025-05-14 | 13F/A | Group One Trading, L.p. | Call | 0 | -100.00 | 0 | ||||
| 2025-07-25 | 13F | Lodestar Private Asset Management Llc | 13,932 | 0.00 | 398 | 15.03 | ||||
| 2025-07-16 | 13F | Brown, Lisle/cummings, Inc. | 419 | 0.00 | 12 | 10.00 | ||||
| 2025-07-23 | 13F | BankPlus Trust Department | 154 | 0.00 | 4 | 33.33 | ||||
| 2025-08-12 | 13F | Kimelman & Baird, LLC | 9,734 | 0.00 | 278 | 14.88 | ||||
| 2025-08-14 | 13F | Ameriprise Financial Inc | 67,703 | 10.54 | 1,934 | 27.24 | ||||
| 2025-08-05 | 13F | Simplex Trading, Llc | Put | 3,900 | 50.00 | 0 | ||||
| 2025-08-05 | 13F | Simplex Trading, Llc | Call | 3,400 | -88.36 | 0 | ||||
| 2025-07-21 | 13F | Credential Qtrade Securities Inc. | 0 | -100.00 | 0 | -100.00 | ||||
| 2025-08-12 | 13F | Wayfinding Financial, LLC | 0 | -100.00 | 0 | |||||
| 2025-04-22 | 13F | Castleview Partners, Llc | 0 | -100.00 | 0 | |||||
| 2025-08-26 | NP | AZBAX - AllianzGI Small-Cap Fund Class A | 11,033 | 0.00 | 315 | 14.96 | ||||
| 2025-08-13 | 13F | Cresset Asset Management, LLC | 11,706 | -24.15 | 334 | -13.02 | ||||
| 2025-08-14 | 13F | Harris Associates L P | 9,750 | -8.84 | 279 | 4.51 | ||||
| 2025-08-14 | 13F | Quantinno Capital Management LP | 182,222 | 2.87 | 5,206 | 18.05 | ||||
| 2025-08-14 | 13F | Fiduciary Management Inc /wi/ | 5,656,372 | -4.94 | 161,603 | 9.08 | ||||
| 2025-07-08 | 13F | Atwood & Palmer Inc | 100 | 0.00 | 3 | 0.00 | ||||
| 2025-08-08 | 13F | Crossmark Global Holdings, Inc. | 64,829 | -0.06 | 1,852 | 14.67 | ||||
| 2025-05-15 | 13F | Glenmede Trust Co Na | 20,864 | 5.30 | 520 | 15.85 | ||||
| 2025-07-11 | 13F | Pinnacle Bancorp, Inc. | 418 | 12 | ||||||
| 2025-07-16 | 13F | Meyer Handelman Co | 16,000 | 0.00 | 457 | 14.82 | ||||
| 2025-08-14 | 13F | Goldman Sachs Group Inc | 796,804 | 9.29 | 22,765 | 25.39 | ||||
| 2025-07-25 | 13F | Pzena Investment Management Llc | 14,662,982 | -4.64 | 418,921 | 9.41 | ||||
| 2025-07-07 | 13F | Northwest & Ethical Investments L.P. | 0 | -100.00 | 0 | -100.00 | ||||
| 2025-07-15 | 13F | Fifth Third Bancorp | 19,654 | 156.58 | 562 | 195.26 | ||||
| 2025-08-12 | 13F | Advisors Asset Management, Inc. | 18,528 | 137.02 | 529 | 172.68 | ||||
| 2025-08-13 | 13F | Natixis Advisors, L.p. | 72,124 | 462.33 | 2 | |||||
| 2025-08-14 | 13F | Syon Capital Llc | 12,360 | -9.44 | 353 | 4.13 | ||||
| 2025-07-24 | 13F | JNBA Financial Advisors | 301 | 0.00 | 9 | 14.29 | ||||
| 2025-08-08 | 13F | Creative Planning | 53,073 | 6.08 | 1,516 | 21.77 | ||||
| 2025-07-01 | 13F | Cacti Asset Management Llc | 6,000 | 0.00 | 169 | 14.19 | ||||
| 2025-07-29 | 13F | Mb, Levis & Associates, Llc | 478 | 0.00 | 14 | 18.18 | ||||
| 2025-07-17 | 13F | Halbert Hargrove Global Advisors, Llc | 0 | -100.00 | 0 | |||||
| 2025-08-12 | 13F | Proequities, Inc. | Put | 0 | 0 | |||||
| 2025-08-12 | 13F | Proequities, Inc. | Call | 0 | 0 | |||||
| 2025-08-12 | 13F | Proequities, Inc. | 0 | 0 | ||||||
| 2025-08-12 | 13F | Global Retirement Partners, LLC | 3,293 | 94 | ||||||
| 2025-08-01 | 13F | Koss-Olinger Consulting, LLC | 14,509 | -3.27 | 415 | 10.70 | ||||
| 2025-08-04 | 13F | Spire Wealth Management | 0 | -100.00 | 0 | |||||
| 2025-08-13 | 13F | Townsquare Capital Llc | 0 | -100.00 | 0 | |||||
| 2025-06-09 | NP | Bmc Fund Inc | 8,420 | -49.88 | 214 | -48.92 | ||||
| 2025-08-12 | 13F | Clear Street Markets Llc | 0 | -100.00 | 0 | |||||
| 2025-08-11 | 13F | Citigroup Inc | 93,747 | 7,824.51 | 2,678 | 9,134.48 | ||||
| 2025-08-12 | 13F | Dimensional Fund Advisors Lp | 23,861 | 1.18 | 682 | 16.01 | ||||
| 2025-08-13 | 13F | Twin Peaks Wealth Advisors, LLC | 148 | 4 | ||||||
| 2025-06-30 | NP | VWNDX - Vanguard Windsor Fund Investor Shares | 8,204,589 | 0.00 | 208,232 | 2.05 | ||||
| 2025-08-14 | 13F | Two Sigma Advisers, Lp | 20,600 | -49.01 | 589 | -41.49 | ||||
| 2025-08-06 | 13F | True Wealth Design, LLC | 35 | 0.00 | 1 | |||||
| 2025-08-13 | 13F | Northwestern Mutual Wealth Management Co | 1,661 | -21.61 | 47 | -9.62 | ||||
| 2025-07-07 | 13F | Investors Research Corp | 21 | 0.00 | 1 | |||||
| 2025-08-12 | 13F | O'shaughnessy Asset Management, Llc | 35,524 | 10.12 | 1,015 | 26.28 | ||||
| 2025-06-26 | NP | PZFVX - Classic Value Fund Class A | 1,016,962 | -12.57 | 25,810 | -10.78 | ||||
| 2025-08-13 | 13F | Bare Financial Services, Inc | 34 | 0.00 | 1 | |||||
| 2025-08-12 | 13F | BlackRock, Inc. | 445,366 | 6.39 | 12,724 | 22.08 | ||||
| 2025-08-14 | 13F | CoreCap Advisors, LLC | 0 | -100.00 | 0 | |||||
| 2025-08-19 | 13F | Cape Investment Advisory, Inc. | 328 | 37.82 | 9 | 80.00 | ||||
| 2025-08-14 | 13F | Millennium Management Llc | 308,390 | -71.54 | 8,811 | -67.35 | ||||
| 2025-08-12 | 13F | Franklin Resources Inc | 75,034 | 3.82 | 2,144 | 19.12 | ||||
| 2025-08-14 | 13F | Mariner, LLC | 48,010 | 2.27 | 1,372 | 17.38 | ||||
| 2025-07-09 | 13F | Bruce G. Allen Investments, LLC | 1,583 | 2.06 | 45 | 18.42 | ||||
| 2025-08-14 | 13F | Old Mission Capital Llc | 0 | -100.00 | 0 | |||||
| 2025-08-11 | 13F | One Capital Management, LLC | 10,482 | 0.00 | 299 | 14.56 | ||||
| 2025-08-25 | 13F/A | Neuberger Berman Group LLC | 9,809 | 2.76 | 280 | 18.14 | ||||
| 2025-04-09 | 13F | Legacy Wealth Asset Management, LLC | 0 | -100.00 | 0 | |||||
| 2025-07-16 | 13F | ORG Wealth Partners, LLC | 1,676 | -56.02 | 48 | -48.94 | ||||
| 2025-07-24 | 13F | Callan Family Office, LLC | 29,877 | 50.15 | 854 | 72.32 | ||||
| 2025-08-07 | 13F | Kestra Private Wealth Services, Llc | 11,685 | 1.74 | 334 | 16.84 | ||||
| 2025-08-08 | 13F | Pnc Financial Services Group, Inc. | 10,161 | 11.75 | 290 | 28.32 | ||||
| 2025-06-26 | NP | CVAR - Cultivar ETF | 16,505 | 0.73 | 419 | 2.70 | ||||
| 2025-08-14 | 13F | Nia Impact Advisors, Llc | 122,198 | -0.10 | 3,491 | 14.65 | ||||
| 2025-07-29 | 13F | Salomon & Ludwin, LLC | 5 | 0 | ||||||
| 2025-08-12 | 13F | Rhumbline Advisers | 16,233 | -0.73 | 464 | 13.76 | ||||
| 2025-08-08 | 13F | SBI Securities Co., Ltd. | 317 | 4,428.57 | 9 | |||||
| 2025-08-13 | 13F | Trustmark National Bank Trust Department | 35,963 | 1,027 | ||||||
| 2025-08-06 | 13F | Paradigm Asset Management Co Llc | 1,800 | 0.00 | 51 | 15.91 | ||||
| 2025-08-11 | 13F | Principal Securities, Inc. | 2,267 | 105.34 | 65 | 166.67 | ||||
| 2025-07-25 | 13F | PrairieView Partners, LLC | 418 | 0.00 | 0 | |||||
| 2025-08-12 | 13F | Manchester Capital Management LLC | 18 | 1 | ||||||
| 2025-08-06 | 13F | SOUTH STATE Corp | 31 | 1 | ||||||
| 2025-08-14 | 13F | GWM Advisors LLC | 206 | 1.98 | 6 | 0.00 | ||||
| 2025-07-28 | 13F | Moran Wealth Management, LLC | 149,551 | 1.38 | 4,273 | 16.31 | ||||
| 2025-08-14 | 13F | Citadel Advisors Llc | Call | 0 | -100.00 | 0 | ||||
| 2025-07-11 | 13F/A | Umb Bank N A/mo | 150 | 0.00 | 4 | 33.33 | ||||
| 2025-06-26 | NP | HFCGX - Hennessy Cornerstone Growth Fund Investor Class | 300,400 | 7,624 | ||||||
| 2025-08-04 | 13F | Hantz Financial Services, Inc. | 2,079 | 568.49 | 0 | |||||
| 2025-08-15 | 13F | Tower Research Capital LLC (TRC) | 62,815 | 616.49 | 1,795 | 722.94 | ||||
| 2025-08-07 | 13F | Sierra Ocean, Llc | 312 | 2.30 | 9 | 14.29 | ||||
| 2025-08-14 | 13F | Lazard Asset Management Llc | 0 | -100.00 | 0 | |||||
| 2025-08-14 | 13F | Glen Eagle Advisors, LLC | 109 | 1.87 | 3 | 50.00 | ||||
| 2025-08-06 | 13F | Commonwealth Equity Services, Llc | 12,364 | -7.46 | 0 | |||||
| 2025-08-27 | NP | Liberty All Star Equity Fund | 1,139,792 | -0.74 | 32,564 | 13.89 | ||||
| 2025-08-08 | 13F | Everett Harris & Co /ca/ | 13,259 | 0.00 | 379 | 14.55 | ||||
| 2025-07-25 | 13F | Stephens Consulting, LLC | 31 | 1 | ||||||
| 2025-07-30 | 13F | Bogart Wealth, LLC | 1 | 0.00 | 0 | |||||
| 2025-08-14 | 13F | Barometer Capital Management Inc. | 18,300 | 523 | ||||||
| 2025-08-12 | 13F | Nuveen, LLC | 38,564 | -31.12 | 1,102 | -21.02 | ||||
| 2025-08-14 | 13F | Toroso Investments, LLC | 11,078 | -32.94 | 316 | -23.11 | ||||
| 2025-08-14 | 13F | Evergreen Capital Management Llc | 8,151 | -4.73 | 233 | 8.92 | ||||
| 2025-09-04 | 13F/A | Advisor Group Holdings, Inc. | 14,351 | 635.95 | 410 | 752.08 | ||||
| 2025-08-14 | 13F | Fmr Llc | 143,412 | 1.94 | 4,097 | 16.96 | ||||
| 2025-07-28 | NP | AVDEX - Avantis International Equity Fund Institutional Class This fund is a listed as child fund of American Century Companies Inc and if that institution has disclosed ownership in this security, then these positions will not be double counted when calculating total shares and total value | 1,743 | 0.00 | 50 | 16.67 | ||||
| 2025-08-11 | 13F | Dorsey & Whitney Trust CO LLC | 7,789 | 223 | ||||||
| 2025-08-14 | 13F | Broyhill Asset Management | 60,952 | -58.69 | 1,741 | -52.60 | ||||
| 2025-08-14 | 13F | Jane Street Group, Llc | 18,362 | 525 | ||||||
| 2025-08-14 | 13F | Point72 Asset Management, L.P. | 0 | -100.00 | 0 | |||||
| 2025-07-21 | 13F | Franklin Street Advisors Inc /nc | 8,896 | 0.00 | 0 | |||||
| 2025-08-12 | 13F | Wulff, Hansen & Co. | 0 | -100.00 | 0 | |||||
| 2025-08-13 | 13F | Jones Financial Companies Lllp | 9,958 | 3.00 | 281 | 17.15 | ||||
| 2025-08-14 | 13F | Summit Trail Advisors, Llc | 12,468 | 356 | ||||||
| 2025-08-14 | 13F | Sei Investments Co | 12,592 | 26.91 | 360 | 45.34 | ||||
| 2025-08-14 | 13F | Mercer Global Advisors Inc /adv | 21,156 | 47.93 | 604 | 69.66 | ||||
| 2025-08-06 | 13F | Fox Run Management, L.l.c. | 0 | -100.00 | 0 | |||||
| 2025-08-08 | 13F | Larson Financial Group LLC | 31 | 0.00 | 1 | |||||
| 2025-08-13 | 13F | Marshall Wace, Llp | 10,074 | -50.57 | 288 | -43.39 | ||||
| 2025-08-12 | 13F | AlphaCore Capital LLC | 2,544 | 73 | ||||||
| 2025-08-13 | 13F | Cerity Partners LLC | 41,126 | 3.06 | 1,175 | 18.23 | ||||
| 2025-08-07 | 13F | Midwest Trust Co | 9,861 | 282 | ||||||
| 2025-04-28 | 13F | Fedenia Advisers LLC | 0 | -100.00 | 0 | |||||
| 2025-08-12 | 13F | Coldstream Capital Management Inc | 0 | -100.00 | 0 | |||||
| 2025-07-31 | 13F | Glass Jacobson Investment Advisors llc | 0 | -100.00 | 0 | |||||
| 2025-07-21 | 13F | Hennessy Advisors Inc | 401,800 | 11,479 | ||||||
| 2025-08-14 | 13F | Glenmede Investment Management, LP | 20,811 | 595 | ||||||
| 2025-07-29 | 13F | Commons Capital, Llc | 8,895 | 0.00 | 254 | 14.93 | ||||
| 2025-08-14 | 13F | Vident Advisory, LLC | 34,355 | -36.70 | 982 | -27.39 | ||||
| 2025-07-28 | NP | AVDE - Avantis International Equity ETF This fund is a listed as child fund of American Century Companies Inc and if that institution has disclosed ownership in this security, then these positions will not be double counted when calculating total shares and total value | 24,285 | 26.76 | 690 | 48.81 | ||||
| 2025-07-15 | 13F | Td Private Client Wealth Llc | 4,925 | 6,380.26 | 141 | 13,900.00 | ||||
| 2025-08-11 | 13F | Rothschild Investment Llc | 640 | 4.75 | 18 | 20.00 | ||||
| 2025-08-01 | 13F | Envestnet Asset Management Inc | 373,961 | 26.76 | 10,684 | 45.46 | ||||
| 2025-08-14 | 13F | Bnp Paribas Arbitrage, Sa | 32,117 | 133,720.83 | 918 | |||||
| 2025-08-07 | 13F | Teachers Retirement System Of The State Of Kentucky | 753,500 | 152.85 | 22 | 200.00 | ||||
| 2025-06-26 | NP | FSGEX - Fidelity Series Global ex U.S. Index Fund This fund is a listed as child fund of Fmr Llc and if that institution has disclosed ownership in this security, then these positions will not be double counted when calculating total shares and total value | 73,378 | -19.14 | 1,862 | -17.46 | ||||
| 2025-07-15 | 13F | Mather Group, Llc. | 0 | -100.00 | 0 | |||||
| 2025-08-13 | 13F | Guggenheim Capital Llc | 22,651 | 30.44 | 647 | 49.77 | ||||
| 2025-07-30 | NP | APIE - ActivePassive International Equity ETF | 58,899 | 4.89 | 1,673 | 23.03 | ||||
| 2025-07-21 | 13F | Credential Securities Inc. | 10,456 | -6.94 | 526 | -8.20 | ||||
| 2025-08-14 | 13F | RBF Capital, LLC | 8,100 | 0.00 | 231 | 14.93 | ||||
| 2025-08-14 | 13F | Integral Health Asset Management, LLC | 750,000 | 10.29 | 21,428 | 26.55 | ||||
| 2025-08-07 | 13F | Parkside Financial Bank & Trust | 81 | 22.73 | 2 | 100.00 | ||||
| 2025-07-21 | 13F | Qrg Capital Management, Inc. | 81,574 | 14.42 | 2,331 | 31.27 | ||||
| 2025-07-30 | NP | ENDW - Cambria Endowment Style ETF | 8 | 0 | ||||||
| 2025-08-07 | 13F | Acadian Asset Management Llc | 1,746 | 0 | ||||||
| 2025-08-11 | 13F | Traub Capital Management LLC | 22 | 1 | ||||||
| 2025-07-31 | 13F | CVA Family Office, LLC | 67 | -34.95 | 2 | -50.00 | ||||
| 2025-07-29 | 13F | TrueMark Investments, LLC | 0 | -100.00 | 0 | |||||
| 2025-08-12 | 13F | Steward Partners Investment Advisory, Llc | 222 | -41.27 | 6 | -33.33 | ||||
| 2025-08-12 | 13F | CIBC Private Wealth Group, LLC | 277 | -76.41 | 8 | -73.08 | ||||
| 2025-07-14 | 13F | Park Avenue Securities Llc | 8,976 | 0 | ||||||
| 2025-07-30 | NP | PZVMX - Pzena Mid Cap Value Fund Investor Class | 147,696 | -14.65 | 4,195 | 0.12 | ||||
| 2025-08-11 | 13F | United Capital Financial Advisers, Llc | 8,308 | 237 | ||||||
| 2025-08-04 | 13F | Creative Financial Designs Inc /adv | 28 | -56.25 | 1 | -100.00 | ||||
| 2025-08-14 | 13F/A | Skopos Labs, Inc. | 4,072 | 216.89 | 116 | 274.19 | ||||
| 2025-08-07 | 13F | Searle & Co. | 23,288 | 0.00 | 665 | 14.85 | ||||
| 2025-08-12 | 13F | LPL Financial LLC | 33,780 | 965 | ||||||
| 2025-08-07 | 13F | Allworth Financial LP | 1,498 | 4.61 | 43 | 23.53 | ||||
| 2025-05-14 | 13F | CI Private Wealth, LLC | 0 | -100.00 | 0 | -100.00 | ||||
| 2025-07-22 | 13F | Highland Capital Management, Llc | 39,100 | -2.62 | 1,117 | 11.81 | ||||
| 2025-07-24 | 13F | Eastern Bank | 209 | 0.00 | 6 | 0.00 | ||||
| 2025-08-14 | 13F | Verition Fund Management LLC | 11,927 | 341 | ||||||
| 2025-08-15 | 13F | WealthCollab, LLC | 219 | 0.00 | 6 | 20.00 | ||||
| 2025-08-13 | 13F | Dodge & Cox | 3,826,910 | -8.30 | 109,335 | 5.21 | ||||
| 2025-08-14 | 13F | Citadel Advisors Llc | 62,533 | 1,042,116.67 | 1,787 | |||||
| 2025-08-14 | 13F | Citadel Advisors Llc | Put | 15,000 | -55.88 | 429 | -49.41 | |||
| 2025-05-12 | 13F | Sandy Spring Bank | 1,500 | 0.00 | 37 | 12.12 | ||||
| 2025-08-13 | 13F | Centiva Capital, LP | 0 | -100.00 | 0 | |||||
| 2025-08-13 | 13F | Arrowstreet Capital, Limited Partnership | 0 | -100.00 | 0 | |||||
| 2025-08-01 | 13F | Bessemer Group Inc | 18 | 0.00 | 0 | |||||
| 2025-08-11 | 13F | CBIZ Investment Advisory Services, LLC | 556 | 0.00 | 16 | 15.38 | ||||
| 2025-08-01 | 13F | Centerpoint Advisors, LLC | 944 | 0.00 | 0 | |||||
| 2025-07-16 | 13F | Highline Wealth Partners Llc | 85 | 0.00 | 2 | 0.00 | ||||
| 2025-08-14 | 13F | Principia Wealth Advisory, LLC | 6 | 0 | ||||||
| 2025-08-14 | 13F | Optiver Holding B.V. | 50,045 | -22.61 | 1,430 | -11.24 | ||||
| 2025-08-14 | 13F | Optiver Holding B.V. | Call | 100 | -99.12 | 3 | -99.29 | |||
| 2025-08-14 | 13F | Optiver Holding B.V. | Put | 100 | 3 | |||||
| 2025-07-24 | 13F | Jfs Wealth Advisors, Llc | 188 | 0.00 | 5 | 25.00 | ||||
| 2025-08-14 | 13F | Corient IA LLC | 25,000 | 0.00 | 714 | 14.79 | ||||
| 2025-05-12 | 13F | Simplex Trading, Llc | 0 | -100.00 | 0 | |||||
| 2025-07-29 | 13F | Private Trust Co Na | 328 | 290.48 | 9 | 350.00 | ||||
| 2025-08-01 | 13F | Riverwater Partners LLC | 15,306 | 0.00 | 437 | 14.70 | ||||
| 2025-08-15 | NP | FMIHX - Large Cap Fund Investor Class | 1,475,000 | -3.28 | 42,141 | 10.98 | ||||
| 2025-08-05 | 13F | Bank of New York Mellon Corp | 21,567 | -2.28 | 616 | 12.20 | ||||
| 2025-07-28 | 13F | Ritholtz Wealth Management | 18,941 | 1.27 | 541 | 16.34 | ||||
| 2025-08-13 | 13F | Barclays Plc | 0 | -100.00 | 0 | |||||
| 2025-08-14 | 13F | Aqr Capital Management Llc | 27,024 | 89.02 | 772 | 116.85 | ||||
| 2025-05-05 | 13F | Lindbrook Capital, Llc | 1,114 | -2.45 | 28 | 8.00 | ||||
| 2025-08-12 | 13F | Jpmorgan Chase & Co | 37,610 | 160.33 | 1,075 | 199.16 | ||||
| 2025-05-15 | 13F | Mork Capital Management, LLC | 0 | -100.00 | 0 | |||||
| 2025-07-28 | 13F | BRYN MAWR TRUST Co | 2,097 | 0.00 | 60 | 13.46 | ||||
| 2025-08-11 | 13F | Bell Investment Advisors, Inc | 30 | 0.00 | 1 | |||||
| 2025-08-05 | 13F | GHP Investment Advisors, Inc. | 2,140 | 0.00 | 61 | 15.09 | ||||
| 2025-08-14 | 13F | Qube Research & Technologies Ltd | 199,563 | 175.30 | 5,702 | 215.84 | ||||
| 2025-07-14 | 13F | GAMMA Investing LLC | 9,852 | 2.59 | 281 | 17.57 | ||||
| 2025-07-22 | 13F | Autumn Glory Partners, LLC | 11,198 | 21.74 | 591 | 157.64 | ||||
| 2025-08-11 | 13F | Annis Gardner Whiting Capital Advisors, LLC | 64 | 2 | ||||||
| 2025-08-14 | 13F | Susquehanna International Group, Llp | 0 | -100.00 | 0 | |||||
| 2025-07-30 | 13F | Ethic Inc. | 52,497 | 2.77 | 1,481 | 17.18 | ||||
| 2025-06-26 | NP | SNTKX - Steward International Enhanced Index Fund Class A | 36,535 | 0.00 | 927 | 2.09 | ||||
| 2025-08-06 | 13F | Atlantic Union Bankshares Corp | 1,500 | 43 | ||||||
| 2025-07-14 | 13F | Abound Wealth Management | 6 | -14.29 | 0 | |||||
| 2025-05-15 | 13F | Squarepoint Ops LLC | 0 | -100.00 | 0 | |||||
| 2025-07-25 | 13F | Cwm, Llc | 1,184 | -9.96 | 0 | |||||
| 2025-08-15 | 13F | Morgan Stanley | 2,369,089 | 125.48 | 67,685 | 158.71 | ||||
| 2025-08-28 | NP | DODBX - Dodge & Cox Balanced Fund | 3,826,910 | -8.30 | 109,335 | 5.21 | ||||
| 2025-07-24 | 13F | Ronald Blue Trust, Inc. | 6,185 | 55.83 | 177 | 79.59 | ||||
| 2025-08-07 | 13F | Campbell & CO Investment Adviser LLC | 0 | -100.00 | 0 | |||||
| 2025-08-12 | 13F | Pathstone Holdings, LLC | 66,204 | -0.61 | 1,891 | 14.05 | ||||
| 2025-08-08 | 13F | Abc Arbitrage Sa | 229,375 | 18.20 | 6,553 | 35.62 | ||||
| 2025-08-18 | 13F/A | National Bank Of Canada /fi/ | 34,954 | 12.29 | 999 | 28.94 | ||||
| 2025-08-13 | 13F | EverSource Wealth Advisors, LLC | 2,906 | 141.76 | 83 | 186.21 | ||||
| 2025-07-18 | 13F | Truist Financial Corp | 7,501 | 214 | ||||||
| 2025-08-08 | 13F | Geode Capital Management, Llc | 57,905 | -21.09 | 1,654 | -9.47 | ||||
| 2025-07-21 | 13F | Cromwell Holdings LLC | 2,275 | 0.00 | 65 | 14.29 | ||||
| 2025-07-09 | 13F | VisionPoint Advisory Group, LLC | 52,578 | -54.72 | 1,502 | -48.05 | ||||
| 2025-08-12 | 13F | XTX Topco Ltd | 20,563 | 587 | ||||||
| 2025-07-07 | 13F | Versant Capital Management, Inc | 8,951 | 34.64 | 256 | 54.55 | ||||
| 2025-07-25 | 13F | JustInvest LLC | 38,942 | 14.07 | 1,113 | 30.82 | ||||
| 2025-08-14 | 13F | Smartleaf Asset Management LLC | 1,074 | -9.67 | 30 | 3.45 | ||||
| 2025-08-18 | 13F | Geneos Wealth Management Inc. | 345 | -7.01 | 10 | 0.00 | ||||
| 2025-08-14 | 13F | Royal Bank Of Canada | 55,671 | 94.25 | 1,590 | 122.69 |
Other Listings
| DE:FMEA | € 20.60 |