Mga Batayang Estadistika
| Pemilik Institusional | 237 total, 237 long only, 0 short only, 0 long/short - change of -1.66% MRQ |
| Alokasi Portofolio Rata-rata | 0.4384 % - change of -4.00% MRQ |
| Saham Institusional (Jangka Panjang) | 25,002,968 (ex 13D/G) - change of 0.47MM shares 1.91% MRQ |
| Nilai Institusional (Jangka Panjang) | $ 1,601,548 USD ($1000) |
Kepemilikan Institusional dan Pemegang Saham
First Trust Exchange-Traded Fund III - First Trust Long/Short Equity ETF (US:FTLS) memiliki 237 pemilik institusional dan pemegang saham yang telah mengajukan formulir 13D/G atau 13F kepada Komisi Bursa Efek (Securities Exchange Commission/SEC). Lembaga-lembaga ini memegang total 25,002,968 saham. Pemegang saham terbesar meliputi Morgan Stanley, Royal Bank Of Canada, Ameriprise Financial Inc, LPL Financial LLC, Raymond James Financial Inc, Cetera Investment Advisers, Envestnet Asset Management Inc, Truist Financial Corp, CENTRAL TRUST Co, and Stifel Financial Corp .
Struktur kepemilikan institusional First Trust Exchange-Traded Fund III - First Trust Long/Short Equity ETF (ARCA:FTLS) menunjukkan posisi terkini di perusahaan oleh institusi dan dana, serta perubahan terbaru dalam ukuran posisi. Pemegang saham utama dapat mencakup investor individu, reksa dana, dana lindung nilai, atau institusi. Jadwal 13D menunjukkan bahwa investor memegang (atau pernah memegang) lebih dari 5% saham perusahaan dan bermaksud (atau pernah bermaksud) untuk secara aktif mengejar perubahan strategi bisnis. Jadwal 13G menunjukkan investasi pasif lebih dari 5%.
The share price as of September 5, 2025 is 67.84 / share. Previously, on September 9, 2024, the share price was 61.91 / share. This represents an increase of 9.58% over that period.

Skor Sentimen Dana
Skor Sentimen Dana (sebelumnya dikenal sebagai Skor Akumulasi Kepemilikan) menemukan saham-saham yang paling banyak dibeli oleh dana. Ini adalah hasil dari model kuantitatif multi-faktor yang canggih yang mengidentifikasi perusahaan dengan tingkat akumulasi institusional tertinggi. Model penilaian menggunakan kombinasi dari total peningkatan pemilik yang diungkapkan, perubahan dalam alokasi portofolio pada pemilik tersebut, dan metrik lainnya. Angka berkisar dari 0 hingga 100, dengan angka yang lebih tinggi menunjukkan tingkat akumulasi yang lebih tinggi dibandingkan dengan perusahaan sejenisnya, dan 50 adalah rata-ratanya.
Frekuensi Pembaruan: Setiap Hari
Lihat Ownership Explorer, yang menyediakan daftar perusahaan dengan peringkat tertinggi.
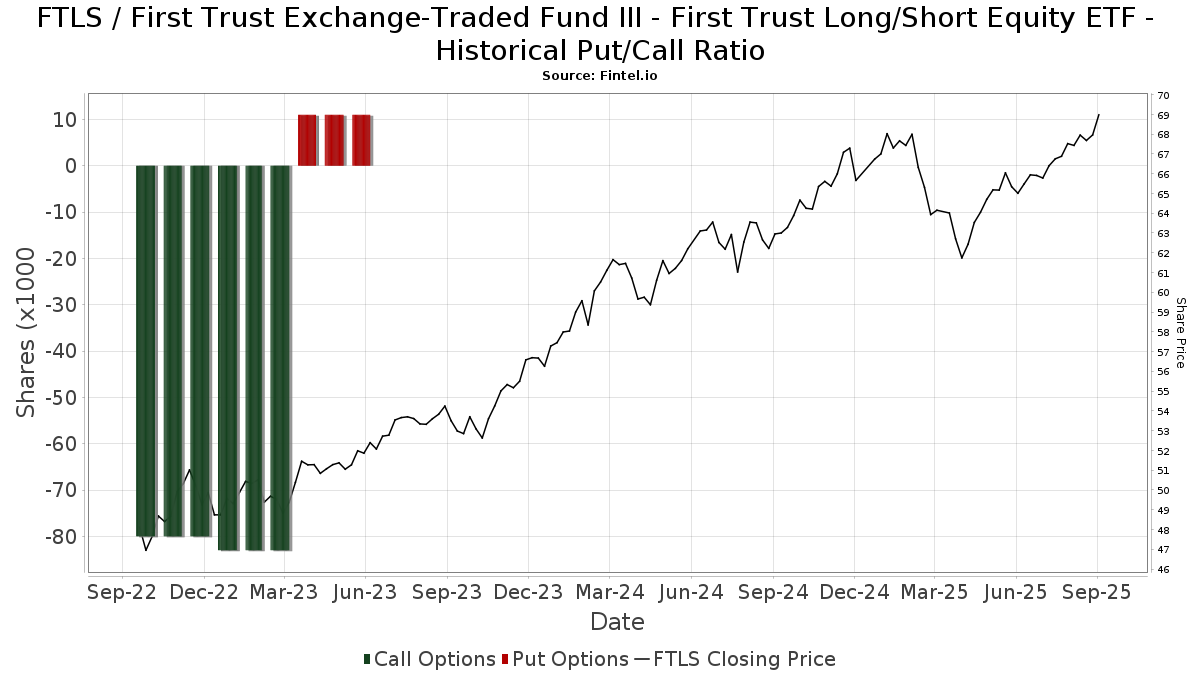
Rasio Put/Call Institusional
Selain melaporkan isu ekuitas dan utang standar, institusi dengan aset di bawah manajemen lebih dari 100 juta dolar AS juga harus mengungkapkan kepemilikan opsi put dan call mereka. Karena opsi put umumnya menunjukkan sentimen negatif, dan opsi call menunjukkan sentimen positif, kita dapat mengetahui sentimen institusional secara keseluruhan dengan memplot rasio put terhadap call. Grafik di sebelah kanan memplot rasio put/call historis untuk instrumen ini.
Menggunakan Rasio Put/Call sebagai indikator sentimen investor mengatasi salah satu kekurangan utama dari penggunaan total kepemilikan institusional, yaitu sejumlah besar aset yang dikelola diinvestasikan secara pasif untuk melacak indeks. Dana yang dikelola secara pasif biasanya tidak membeli opsi, sehingga indikator rasio put/call lebih akurat dalam melacak sentimen dana yang dikelola secara aktif.
Pengajuan 13F dan NPORT
Detail pada pengajuan 13F tersedia gratis. Detail pada pengajuan NP memerlukan keanggotaan premium. Baris berwarna hijau menunjukkan posisi baru. Baris berwarna merah menunjukkan posisi yang sudah ditutup. Klik tautan ini ikon untuk melihat riwayat transaksi selengkapnya.
Tingkatkan
untuk membuka data premium dan mengekspor ke Excel ![]() .
.
| Tanggal File | Sumber | Investor | Ketik | Presyo ng Avg (Silangan) |
Saham | Δ Saham (%) |
Dilaporkan Nilai ($1000) |
Nilai Δ (%) |
Alokasi Port (%) |
|
|---|---|---|---|---|---|---|---|---|---|---|
| 2025-04-18 | 13F | Insigneo Advisory Services, Llc | 0 | -100.00 | 0 | |||||
| 2025-08-28 | NP | TFAFX - Tactical Growth Allocation Fund Class I | 6,739 | 0.00 | 447 | 3.48 | ||||
| 2025-08-13 | 13F | Baird Financial Group, Inc. | 43,329 | 0.24 | 2,872 | 3.68 | ||||
| 2025-08-14 | 13F | Harvest Investment Services, LLC | 10,485 | -0.29 | 695 | 3.12 | ||||
| 2025-07-08 | 13F | Richard P Slaughter Associates Inc | 30,704 | -73.73 | 2,035 | -72.83 | ||||
| 2025-07-16 | 13F | EdgeRock Capital LLC | 184,682 | 18.21 | 12,250 | 22.37 | ||||
| 2025-08-29 | 13F | Centaurus Financial, Inc. | 5,658 | -25.20 | 0 | |||||
| 2025-07-14 | 13F | Park Avenue Securities Llc | 9,301 | -0.52 | 1 | |||||
| 2025-08-12 | 13F | Cornerstone Wealth Management, LLC | 14,297 | 37.75 | 948 | 42.41 | ||||
| 2025-08-14 | 13F | Snowden Capital Advisors LLC | 6,912 | -0.32 | 458 | 3.15 | ||||
| 2025-07-11 | 13F | Seacrest Wealth Management, Llc | 0 | -100.00 | 0 | |||||
| 2025-07-21 | 13F | Ntv Asset Management Llc | 5,808 | 0.00 | 385 | 3.23 | ||||
| 2025-07-25 | 13F | Prostatis Group LLC | 55,485 | -10.13 | 3,678 | -7.05 | ||||
| 2025-08-06 | 13F | Savant Capital, LLC | 7,277 | -14.23 | 482 | -11.23 | ||||
| 2025-08-15 | 13F | Morgan Stanley | 6,137,971 | 0.21 | 406,825 | 3.65 | ||||
| 2025-08-05 | 13F | Frederick Financial Consultants, LLC | 26,483 | 15.12 | 1,755 | 19.06 | ||||
| 2025-07-17 | 13F | Montis Financial, LLC | 23,242 | 12.18 | 1,540 | 16.05 | ||||
| 2025-08-13 | 13F | Jones Financial Companies Lllp | 0 | -100.00 | 0 | |||||
| 2025-07-30 | 13F | First Citizens Bank & Trust Co | 6,642 | -63.25 | 440 | -62.00 | ||||
| 2025-08-11 | 13F | Nations Financial Group Inc, /ia/ /adv | 17,268 | 3.89 | 1,145 | 7.42 | ||||
| 2025-07-22 | 13F | Old National Bancorp /in/ | 38,141 | 6.08 | 2,528 | 9.73 | ||||
| 2025-08-15 | 13F | Kestra Advisory Services, LLC | 44,054 | 8.43 | 2,920 | 12.14 | ||||
| 2025-07-15 | 13F | Avaii Wealth Management, Llc | 11,707 | -8.75 | 776 | -5.72 | ||||
| 2025-07-23 | 13F | RiverTree Advisors, LLC | 15,550 | -20.05 | 1,031 | -17.34 | ||||
| 2025-08-08 | 13F | Pnc Financial Services Group, Inc. | 2,464 | 815.99 | 163 | 858.82 | ||||
| 2025-07-30 | 13F | Meadow Creek Wealth Advisors Llc | 13,319 | 6.28 | 883 | 9.84 | ||||
| 2025-08-12 | 13F | LPL Financial LLC | 2,363,387 | 4.56 | 156,645 | 8.15 | ||||
| 2025-08-11 | 13F | Synergy Investment Management, LLC | 0 | -100.00 | 0 | |||||
| 2025-08-12 | 13F | BlackRock, Inc. | 1,455 | -13.85 | 96 | -11.11 | ||||
| 2025-08-14 | 13F | Mariner, LLC | 13,465 | 55.25 | 892 | 60.72 | ||||
| 2025-08-14 | 13F | Comerica Bank | 236,207 | 81.77 | 15,656 | 88.00 | ||||
| 2025-08-06 | 13F | Ethos Financial Group, LLC | 170,099 | 8.83 | 11,274 | 9.61 | ||||
| 2025-07-24 | 13F | Ronald Blue Trust, Inc. | 0 | -100.00 | 0 | |||||
| 2025-07-28 | 13F | WealthPlan Investment Management, LLC | 215,979 | 47.30 | 14,315 | 52.37 | ||||
| 2025-07-29 | 13F | Koshinski Asset Management, Inc. | 56,181 | -1.77 | 3,724 | 1.61 | ||||
| 2025-08-06 | 13F | SOUTH STATE Corp | 0 | -100.00 | 0 | |||||
| 2025-07-18 | 13F | Cooper Financial Group | 17,682 | -4.05 | 1,172 | -0.76 | ||||
| 2025-07-14 | 13F | Sowell Financial Services LLC | 108,047 | 32.09 | 7,161 | 36.63 | ||||
| 2025-08-07 | 13F | Kestra Private Wealth Services, Llc | 17,471 | -36.11 | 1,158 | -33.96 | ||||
| 2025-07-21 | 13F | Ameritas Advisory Services, LLC | 12,748 | -41.80 | 845 | -40.10 | ||||
| 2025-08-14 | 13F | Advisor OS, LLC | 17,782 | 297.45 | 1,179 | 311.89 | ||||
| 2025-07-03 | 13F | City Center Advisors, LLC | 9,831 | -4.22 | 652 | -0.91 | ||||
| 2025-08-07 | 13F | Runnymede Capital Advisors, Inc. | 0 | -100.00 | 0 | -100.00 | ||||
| 2025-07-09 | 13F | FOCUS Wealth Advisors, LLC | 91,696 | 0.62 | 6,078 | 4.08 | ||||
| 2025-08-14 | 13F | Wiley Bros.-aintree Capital, Llc | 0 | -100.00 | 0 | |||||
| 2025-08-14 | 13F | Royal Bank Of Canada | 2,549,033 | 29.37 | 168,950 | 33.81 | ||||
| 2025-07-10 | 13F | Kmg Fiduciary Partners, Llc | 25,308 | -0.51 | 1,677 | 2.88 | ||||
| 2025-07-14 | 13F | Golden State Equity Partners | 17,520 | -2.97 | 1,161 | 0.35 | ||||
| 2025-08-04 | 13F | Pensionmark Financial Group, Llc | 34,076 | -8.11 | 2,259 | -4.97 | ||||
| 2025-08-14 | 13F | Integrated Wealth Concepts LLC | 66,477 | -8.14 | 4,406 | -4.98 | ||||
| 2025-07-18 | 13F | Philip James Wealth Mangement, LLC | 122,878 | 0.19 | 8,144 | 3.63 | ||||
| 2025-08-07 | 13F | Rathbone Brothers plc | 7,901 | 10.97 | 524 | 14.69 | ||||
| 2025-07-17 | 13F | Janney Montgomery Scott LLC | 76,501 | 9.58 | 5 | 25.00 | ||||
| 2025-05-15 | 13F/A | Orion Portfolio Solutions, LLC | 98,311 | -4.44 | 6,300 | -6.96 | ||||
| 2025-07-14 | 13F | GAMMA Investing LLC | 1,357 | 0.00 | 90 | 3.49 | ||||
| 2025-08-06 | 13F | Wedbush Securities Inc | 9,858 | 5.16 | 1 | |||||
| 2025-08-11 | 13F | Cornerstone Planning Group LLC | 218,908 | 9.61 | 14,492 | 16.23 | ||||
| 2025-07-29 | 13F | Balboa Wealth Partners | 9,938 | 189.06 | 659 | 199.09 | ||||
| 2025-08-11 | 13F | Principal Securities, Inc. | 1,061 | 11.10 | 70 | 12.90 | ||||
| 2025-08-01 | 13F | Envestnet Asset Management Inc | 579,756 | 8.55 | 38,426 | 12.28 | ||||
| 2025-08-12 | 13F | Financial Advocates Investment Management | 7,482 | -35.90 | 496 | -33.73 | ||||
| 2025-07-23 | 13F | L.K. Benson & Company, P.C. | 3,791 | 0.00 | 251 | 3.72 | ||||
| 2025-08-07 | 13F | Allworth Financial LP | 2,176 | -12.58 | 144 | -7.69 | ||||
| 2025-07-24 | 13F | Cyndeo Wealth Partners, LLC | 12,964 | 2.34 | 859 | 5.92 | ||||
| 2025-08-12 | 13F | Steward Partners Investment Advisory, Llc | 47,814 | -43.15 | 3,169 | -41.20 | ||||
| 2025-08-13 | 13F | Cerity Partners LLC | 55,304 | 57.66 | 3,666 | 63.11 | ||||
| 2025-07-15 | 13F | Traction Financial Partners, LLC | 3,190 | 211 | ||||||
| 2025-07-24 | 13F | Live Oak Investment Partners | 75,620 | 0.14 | 5,012 | 3.60 | ||||
| 2025-08-07 | 13F | LFA - Lugano Financial Advisors SA | 64,285 | 11.24 | 4,261 | 15.07 | ||||
| 2025-08-12 | 13F | Maripau Wealth Management Llc | 3,313 | -2.47 | 220 | 0.92 | ||||
| 2025-08-01 | 13F | Ashton Thomas Private Wealth, LLC | 16,379 | 24.38 | 1,086 | 28.71 | ||||
| 2025-08-04 | 13F | Flagship Harbor Advisors, Llc | 107,543 | 0.37 | 7,128 | 3.80 | ||||
| 2025-08-12 | 13F | Centric Wealth Management | 135,858 | 0.64 | 9,101 | 5.21 | ||||
| 2025-08-12 | 13F | Calton & Associates, Inc. | 6,224 | 413 | ||||||
| 2025-08-19 | 13F | Advisory Services Network, LLC | 45,373 | 10.60 | 3,029 | 15.22 | ||||
| 2025-08-14 | 13F | Stifel Financial Corp | 310,932 | 0.51 | 20,612 | 3.96 | ||||
| 2025-07-29 | 13F | Stratos Wealth Partners, LTD. | 79,636 | 4.15 | 5,278 | 7.74 | ||||
| 2025-08-18 | 13F | Geneos Wealth Management Inc. | 12,882 | 52.58 | 854 | 57.67 | ||||
| 2025-07-21 | 13F | Matauro, Llc | 4,203 | -8.31 | 279 | -5.12 | ||||
| 2025-05-15 | 13F | Newbridge Financial Services Group, Inc. | 0 | -100.00 | 0 | |||||
| 2025-07-22 | 13F | Simplicity Wealth,LLC | 53,577 | 204.87 | 3,551 | 215.36 | ||||
| 2025-08-14 | 13F | UBS Group AG | 45,863 | -10.81 | 3,040 | -7.77 | ||||
| 2025-08-14 | 13F | Susquehanna International Group, Llp | 0 | -100.00 | 0 | |||||
| 2025-04-22 | 13F | Breakthru Advisory Services, Llc | 0 | -100.00 | 0 | |||||
| 2025-08-12 | 13F | Jpmorgan Chase & Co | 27,654 | -96.47 | 1,833 | -96.35 | ||||
| 2025-08-05 | 13F | Sigma Planning Corp | 48,865 | -23.24 | 3,239 | -20.62 | ||||
| 2025-08-13 | 13F | GeoWealth Management, LLC | 11,319 | -0.60 | 750 | 2.88 | ||||
| 2025-08-01 | 13F | Rossby Financial, LCC | 468 | 0.00 | 31 | 6.90 | ||||
| 2025-07-29 | 13F | Stratos Wealth Advisors, LLC | 25,878 | -0.60 | 1,715 | 2.82 | ||||
| 2025-08-14 | 13F | Harwood Advisory Group, LLC | 35,349 | 21.37 | 2,343 | 22.23 | ||||
| 2025-08-08 | 13F | Crossmark Global Holdings, Inc. | 7,633 | -0.27 | 505 | 3.27 | ||||
| 2025-08-14 | 13F | Benjamin Edwards Inc | 53,779 | 41.00 | 3,564 | 45.83 | ||||
| 2025-07-29 | 13F | Signature Estate & Investment Advisors Llc | 27,988 | -0.04 | 1,855 | 3.40 | ||||
| 2025-08-14 | 13F | Raymond James Financial Inc | 673,403 | 45.19 | 44,633 | 50.17 | ||||
| 2025-08-06 | 13F | First Horizon Advisors, Inc. | 0 | 0 | ||||||
| 2025-08-13 | 13F | SMART Wealth LLC | 20,367 | 7.71 | 1,350 | 11.40 | ||||
| 2025-08-14 | 13F | Chilton Investment Co Llc | 5,196 | 344 | ||||||
| 2025-07-17 | 13F | Oakworth Capital, Inc. | 1,400 | 0.00 | 93 | 3.37 | ||||
| 2025-08-11 | 13F | Amara Financial, Llc. | 5,401 | 0.02 | 358 | 3.18 | ||||
| 2025-07-30 | 13F | TFB Advisors LLC | 7,102 | 26.37 | 471 | 30.56 | ||||
| 2025-07-31 | 13F | Oppenheimer & Co Inc | 52,411 | 11.72 | 3,474 | 15.54 | ||||
| 2025-08-14 | 13F | GWM Advisors LLC | 18,915 | 157.80 | 1,254 | 166.60 | ||||
| 2025-05-16 | 13F | Laidlaw Wealth Management LLC | 0 | -100.00 | 0 | -100.00 | ||||
| 2025-07-17 | 13F | Park Place Capital Corp | 357 | 0.00 | 24 | 4.55 | ||||
| 2025-08-14 | 13F | Wells Fargo & Company/mn | 119 | -64.90 | 8 | -66.67 | ||||
| 2025-08-14 | 13F | IHT Wealth Management, LLC | 14,177 | -50.91 | 940 | -49.24 | ||||
| 2025-07-24 | 13F | MSH Capital Advisors LLC | 22,160 | 1,469 | ||||||
| 2025-08-14 | 13F | Graney & King, LLC | 2,957 | 0.07 | 196 | 3.70 | ||||
| 2025-08-15 | 13F | Captrust Financial Advisors | 75,517 | -4.77 | 5,005 | -1.50 | ||||
| 2025-07-25 | 13F | Envestnet Portfolio Solutions, Inc. | 14,441 | -74.05 | 957 | -73.16 | ||||
| 2025-08-12 | 13F | CIBC Private Wealth Group, LLC | 1 | -97.73 | 0 | -100.00 | ||||
| 2025-08-05 | 13F | Lord & Richards Wealth Management, LLC | 0 | -100.00 | 0 | |||||
| 2025-08-08 | 13F | SBI Securities Co., Ltd. | 327 | -41.50 | 22 | -40.00 | ||||
| 2025-07-29 | 13F | International Assets Investment Management, Llc | 5,268 | -2.10 | 349 | 1.45 | ||||
| 2025-08-15 | 13F | Fsb Premier Wealth Management, Inc. | 5,966 | 11.37 | 395 | 15.16 | ||||
| 2025-07-15 | 13F | Armis Advisers, LLC | 79,182 | 1.35 | 5,248 | 4.83 | ||||
| 2025-08-11 | 13F | TD Waterhouse Canada Inc. | 3,263 | 0.00 | 215 | 3.37 | ||||
| 2025-08-14 | 13F | Hilltop Holdings Inc. | 7,659 | 1.69 | 508 | 5.19 | ||||
| 2025-07-25 | 13F | Apollon Wealth Management, LLC | 28,428 | -0.36 | 1,884 | 3.06 | ||||
| 2025-05-12 | 13F | Owen LaRue, LLC | 0 | -100.00 | 0 | |||||
| 2025-07-22 | 13F | Belpointe Asset Management LLC | 59,150 | -13.14 | 3,921 | -10.15 | ||||
| 2025-08-14 | 13F | Quantinno Capital Management LP | 5,192 | 344 | ||||||
| 2025-08-13 | 13F | Virtue Capital Management, LLC | 0 | -100.00 | 0 | |||||
| 2025-07-14 | 13F | Iams Wealth Management, Llc | 8,658 | -11.33 | 574 | -8.32 | ||||
| 2025-08-13 | 13F | WCG Wealth Advisors LLC | 12,272 | -6.01 | 813 | -2.75 | ||||
| 2025-07-22 | 13F | Wealthcare Advisory Partners LLC | 3,192 | 212 | ||||||
| 2025-05-01 | 13F | Stephens Inc /ar/ | 0 | -100.00 | 0 | -100.00 | ||||
| 2025-07-30 | 13F | Fairway Wealth LLC | 28,575 | 0.28 | 1,894 | 3.73 | ||||
| 2025-08-05 | 13F | GPS Wealth Strategies Group, LLC | 213 | -99.70 | 14 | -99.70 | ||||
| 2025-08-28 | NP | TFAQX - TFA Quantitative Fund Class I | 25,000 | 96.85 | 1,657 | 103.81 | ||||
| 2025-07-25 | NP | LALT - First Trust Multi-Strategy Alternative ETF | 64,462 | 25.50 | 4,224 | 23.80 | ||||
| 2025-07-21 | 13F | Ameriflex Group, Inc. | 0 | -100.00 | 0 | |||||
| 2025-08-11 | 13F | Western Wealth Management, LLC | 7,468 | 0.04 | 495 | 3.35 | ||||
| 2025-08-08 | 13F | Beacon Harbor Wealth Advisors, Inc. | 0 | -100.00 | 0 | |||||
| 2025-08-08 | 13F | Cetera Investment Advisers | 631,308 | 7.58 | 41,843 | 11.27 | ||||
| 2025-07-28 | 13F | WealthPLAN Partners, LLC | 101,265 | -39.40 | 6,712 | -37.32 | ||||
| 2025-08-05 | 13F | Optivise Advisory Services LLC | 4,122 | -0.02 | 273 | 3.41 | ||||
| 2025-08-06 | 13F | Golden State Wealth Management, LLC | 70,501 | -1.30 | 4,673 | 2.08 | ||||
| 2025-08-12 | 13F | Richmond Investment Services, LLC | 39,513 | 105.68 | 2,619 | 112.67 | ||||
| 2025-07-31 | 13F | Cambridge Investment Research Advisors, Inc. | 240,105 | 9.76 | 16 | 7.14 | ||||
| 2025-05-12 | 13F | American Alpha Advisors, LLC | 0 | -100.00 | 0 | -100.00 | ||||
| 2025-08-13 | 13F | Plan Group Financial, LLC | 3,472 | 0.00 | 230 | 3.60 | ||||
| 2025-07-17 | 13F | Wagner Wealth Management, Llc | 21 | -58.82 | 1 | -66.67 | ||||
| 2025-07-22 | 13F | DAVENPORT & Co LLC | 4,653 | -2.62 | 308 | 0.65 | ||||
| 2025-08-04 | 13F | IFG Advisory, LLC | 5,623 | 0.07 | 373 | 3.33 | ||||
| 2025-08-27 | 13F/A | Brinker Capital Investments, LLC | 89,340 | -9.13 | 5,921 | -6.00 | ||||
| 2025-07-29 | 13F | Crux Wealth Advisors | 9,268 | 25.68 | 614 | 30.08 | ||||
| 2025-08-08 | 13F | Avantax Advisory Services, Inc. | 68,886 | -5.77 | 4,566 | -2.54 | ||||
| 2025-08-14 | 13F | Bank Of America Corp /de/ | 10,494 | 578.78 | 696 | 602.02 | ||||
| 2025-07-18 | 13F | Provident Wealth Management, LLC | 8,810 | -11.31 | 584 | -8.33 | ||||
| 2025-08-05 | 13F | Carolinas Wealth Consulting Llc | 0 | -100.00 | 0 | -100.00 | ||||
| 2025-08-08 | 13F | Larson Financial Group LLC | 728 | 0.41 | 48 | 4.35 | ||||
| 2025-07-31 | 13F | Sage Mountain Advisors LLC | 3,040 | 201 | ||||||
| 2025-07-17 | 13F | Fifth Third Securities, Inc. | 7,625 | 505 | ||||||
| 2025-07-17 | 13F | Sound Income Strategies, LLC | 0 | -100.00 | 0 | |||||
| 2025-08-06 | 13F | Quadrant Private Wealth Management, LLC | 0 | -100.00 | 0 | |||||
| 2025-07-23 | 13F | Morey & Quinn Wealth Partners, LLC | 4,769 | 0.00 | 316 | 3.61 | ||||
| 2025-08-08 | 13F | Kingsview Wealth Management, LLC | 56,770 | 12.86 | 3,763 | 16.72 | ||||
| 2025-08-07 | 13F | Legacy Financial Advisors, Inc. | 41,250 | 2,734 | ||||||
| 2025-08-12 | 13F | Wood Tarver Financial Group, LLC | 4,592 | 0 | ||||||
| 2025-08-06 | 13F | AE Wealth Management LLC | 12,518 | -26.24 | 830 | -23.74 | ||||
| 2025-05-12 | 13F | Independent Advisor Alliance | 0 | -100.00 | 0 | |||||
| 2025-08-14 | 13F | CoreCap Advisors, LLC | 801 | 46.44 | 53 | 51.43 | ||||
| 2025-08-13 | 13F | EverSource Wealth Advisors, LLC | 265 | 126.50 | 18 | 142.86 | ||||
| 2025-08-19 | 13F | National Asset Management, Inc. | 28,218 | -7.24 | 1,870 | -6.55 | ||||
| 2025-05-09 | 13F | Cary Street Partners Financial Llc | 0 | -100.00 | 0 | |||||
| 2025-07-30 | 13F | Patten Group, Inc. | 29,687 | -3.93 | 1,968 | -0.66 | ||||
| 2025-08-15 | 13F | First Heartland Consultants, Inc. | 9,927 | 9.12 | 658 | 12.89 | ||||
| 2025-07-08 | 13F | Nbc Securities, Inc. | 6,108 | 660.65 | 0 | |||||
| 2025-07-31 | 13F | Moloney Securities Asset Management, LLC | 11,246 | 0.74 | 745 | 4.20 | ||||
| 2025-08-06 | 13F | Moors & Cabot, Inc. | 6,418 | 19.21 | 425 | 23.19 | ||||
| 2025-07-22 | 13F | Merit Financial Group, LLC | 30,707 | 2,035 | ||||||
| 2025-08-12 | 13F | Proequities, Inc. | 0 | 0 | ||||||
| 2025-08-14 | 13F | Modern Wealth Management, LLC | 18,581 | -85.77 | 1,232 | -85.28 | ||||
| 2025-05-01 | 13F | Grant/GrossMendelsohn, LLC | 4,936 | -29.10 | 312 | -31.88 | ||||
| 2025-08-04 | 13F | Assetmark, Inc | 74,147 | 3.14 | 4,914 | 6.69 | ||||
| 2025-07-29 | 13F | Private Trust Co Na | 3,581 | 10.18 | 237 | 13.94 | ||||
| 2025-07-25 | 13F | Atria Wealth Solutions, Inc. | 12,318 | -69.25 | 816 | -68.20 | ||||
| 2025-08-12 | 13F | Gladstone Institutional Advisory LLC | 3,626 | 4.65 | 240 | 8.11 | ||||
| 2025-07-18 | 13F | Truist Financial Corp | 427,431 | 1.29 | 28,330 | 4.77 | ||||
| 2025-08-18 | 13F/A | National Bank Of Canada /fi/ | 1,305 | 0.00 | 86 | 3.61 | ||||
| 2025-07-14 | 13F | U.S. Capital Wealth Advisors, LLC | 21,631 | 0.32 | 1,434 | 3.77 | ||||
| 2025-07-28 | 13F | BRYN MAWR TRUST Co | 1,834 | 54.90 | 122 | 61.33 | ||||
| 2025-07-24 | 13F | IFP Advisors, Inc | 25,340 | 5.60 | 1,680 | 9.24 | ||||
| 2025-08-14 | 13F | Sunbelt Securities, Inc. | 187 | 12 | ||||||
| 2025-04-11 | 13F | Insight Advisors, LLC/ PA | 0 | -100.00 | 0 | |||||
| 2025-08-14 | 13F | Jane Street Group, Llc | 7,585 | -69.26 | 503 | -68.25 | ||||
| 2025-08-01 | 13F | Transcend Wealth Collective, Llc | 0 | -100.00 | 0 | |||||
| 2025-08-13 | 13F | Transce3nd, LLC | 129 | 3,125.00 | 9 | |||||
| 2025-08-12 | 13F | Change Path, LLC | 61,952 | 3.37 | 4,106 | 6.93 | ||||
| 2025-04-29 | 13F | Onyx Bridge Wealth Group LLC | 0 | -100.00 | 0 | |||||
| 2025-07-14 | 13F | Financial Enhancement Group LLC | 116,993 | -50.59 | 7,699 | -47.65 | ||||
| 2025-07-16 | 13F/A | CX Institutional | 623 | -1.74 | 0 | |||||
| 2025-05-06 | 13F | Rsm Us Wealth Management Llc | 0 | -100.00 | 0 | |||||
| 2025-07-31 | 13F | Hobart Private Capital, LLC | 307,223 | 0.98 | 20,363 | 4.45 | ||||
| 2025-08-04 | 13F | Creekmur Asset Management LLC | 402 | 27 | ||||||
| 2025-08-05 | 13F | Bank of New York Mellon Corp | 22,934 | 2.75 | 1,520 | 6.29 | ||||
| 2025-08-11 | 13F | NewEdge Wealth, LLC | 8,302 | 6.42 | 550 | 10.22 | ||||
| 2025-08-13 | 13F | StoneX Group Inc. | 11,896 | 2.97 | 788 | 6.49 | ||||
| 2025-08-06 | 13F | Prospera Financial Services Inc | 14,912 | -1.38 | 989 | 1.96 | ||||
| 2025-05-16 | 13F/A | Kestra Investment Management, LLC | 0 | -100.00 | 0 | |||||
| 2025-08-13 | 13F | Capital Analysts, Inc. | 4,938 | -1.65 | 0 | |||||
| 2025-08-11 | 13F | Lcnb Corp | 46,211 | -6.62 | 3,063 | -3.41 | ||||
| 2025-07-11 | 13F | Farther Finance Advisors, LLC | 467 | 455.95 | 31 | 500.00 | ||||
| 2025-09-04 | 13F/A | Advisor Group Holdings, Inc. | 218,598 | 8.10 | 14,485 | 11.76 | ||||
| 2025-08-15 | 13F | Asset Allocation Strategies LLC | 36,827 | 16.82 | 2,441 | 20.79 | ||||
| 2025-05-15 | 13F | Creative Planning | 0 | -100.00 | 0 | |||||
| 2025-08-11 | 13F | United Advisor Group, LLC | 4,238 | 1.51 | 281 | 4.87 | ||||
| 2025-07-31 | 13F | Stegent Equity Advisors, Inc. | 61,093 | -2.13 | 4,049 | 1.25 | ||||
| 2025-07-07 | 13F | Thurston, Springer, Miller, Herd & Titak, Inc. | 237 | 16 | ||||||
| 2025-08-08 | 13F | Citizens Financial Group Inc/ri | 20,774 | -47.43 | 1,377 | -45.66 | ||||
| 2025-08-14 | 13F | Colony Group, LLC | 18,216 | -20.47 | 1,207 | -17.72 | ||||
| 2025-08-20 | 13F/A | Coppell Advisory Solutions LLC | 116,591 | 29.85 | 7,699 | 35.60 | ||||
| 2025-08-15 | 13F | Equitable Holdings, Inc. | 68,334 | 11.43 | 4,529 | 15.27 | ||||
| 2025-07-07 | 13F | Nova Wealth Management, Inc. | 189 | 13 | ||||||
| 2025-08-14 | 13F | Warren Averett Asset Management, LLC | 3,636 | -33.91 | 241 | -31.82 | ||||
| 2025-07-15 | 13F | World Equity Group, Inc. | 261,966 | 10.37 | 17,363 | 14.16 | ||||
| 2025-08-07 | 13F | Resources Investment Advisors, LLC. | 12,673 | -14.15 | 840 | -11.22 | ||||
| 2025-08-12 | 13F | MAI Capital Management | 134 | 0.75 | 9 | 0.00 | ||||
| 2025-04-21 | 13F | O'Dell Group, LLC | 0 | -100.00 | 0 | |||||
| 2025-05-08 | 13F | Heritage Wealth Advisors | 0 | -100.00 | 0 | |||||
| 2025-08-13 | 13F | Maia Wealth LLC | 25,311 | 20.07 | 1,678 | 27.33 | ||||
| 2025-08-14 | 13F | Pinnacle Family Advisors, LLC | 4,037 | 10.09 | 268 | 14.10 | ||||
| 2025-08-12 | 13F | Global Retirement Partners, LLC | 35,789 | 46.95 | 2,372 | 48.06 | ||||
| 2025-08-11 | 13F | HighTower Advisors, LLC | 186,486 | -8.35 | 12,360 | -5.20 | ||||
| 2025-08-08 | 13F | Comprehensive Financial Planning, Inc./PA | 512 | -0.58 | 34 | 0.00 | ||||
| 2025-08-13 | 13F | First Trust Advisors Lp | 67,002 | -7.18 | 4,441 | -4.00 | ||||
| 2025-07-28 | 13F | Harbour Investments, Inc. | 98,714 | 28.17 | 6,543 | 32.56 | ||||
| 2025-08-14 | 13F | Ausdal Financial Partners, Inc. | 50,795 | 8.30 | 3,367 | 12.01 | ||||
| 2025-07-11 | 13F | SILVER OAK SECURITIES, Inc | 18,405 | 0.12 | 1,220 | 4.55 | ||||
| 2025-08-14 | 13F | Ameriprise Financial Inc | 2,417,461 | 10.57 | 160,161 | 14.31 | ||||
| 2025-07-25 | 13F | Cwm, Llc | 186,296 | -2.42 | 12 | 0.00 | ||||
| 2025-07-31 | 13F | Cardinal Point Capital Management, ULC | 118,969 | -4.18 | 7,885 | -0.89 | ||||
| 2025-08-01 | 13F | Brookwood Investment Group LLC | 12,268 | 8.56 | 813 | 12.29 | ||||
| 2025-04-29 | 13F | Pure Portfolios Holdings Llc | 0 | -100.00 | 0 | |||||
| 2025-08-11 | 13F | Private Advisor Group, LLC | 126,301 | -16.47 | 8,371 | -13.60 | ||||
| 2025-07-16 | 13F | Twelve Points Wealth Management LLC | 11,988 | 6.54 | 795 | 10.12 | ||||
| 2025-07-30 | 13F | IMG Wealth Management, Inc. | 71,719 | 9.40 | 4,754 | 13.17 | ||||
| 2025-08-13 | 13F | Northwestern Mutual Wealth Management Co | 82 | 0.00 | 5 | 0.00 | ||||
| 2025-07-15 | 13F | Oregon Pacific Wealth Management, LLC | 31,834 | -3.45 | 2,110 | -0.14 | ||||
| 2025-07-09 | 13F | Dynamic Advisor Solutions LLC | 29,626 | 19.69 | 1,964 | 23.77 | ||||
| 2025-08-14 | 13F | Mml Investors Services, Llc | 85,539 | 8.84 | 6 | 0.00 | ||||
| 2025-08-14 | 13F | Acas, Llc | 50,045 | -1.47 | 3,379 | 4.39 | ||||
| 2025-08-12 | 13F | Viawealth, Llc | 70,396 | -10.69 | 4,666 | -7.62 | ||||
| 2025-08-13 | 13F | Legacy Capital Wealth Partners, LLC | 14,105 | -4.82 | 935 | -1.58 | ||||
| 2025-08-06 | 13F | Commonwealth Equity Services, Llc | 93,521 | -23.14 | 6 | -14.29 | ||||
| 2025-07-15 | 13F | Revisor Wealth Management LLC | 5,659 | 374 | ||||||
| 2025-08-07 | 13F | Brio Consultants, LLC | 84,485 | -2.74 | 5,600 | 0.59 | ||||
| 2025-08-14 | 13F | Atomi Financial Group, Inc. | 167,359 | 0.71 | 11,093 | 4.17 | ||||
| 2025-07-10 | 13F | Signal Advisors Wealth, LLC | 16,407 | 22.25 | 1,087 | 26.40 | ||||
| 2025-08-11 | 13F | Rothschild Investment Llc | 12,728 | 0.00 | 844 | 3.44 | ||||
| 2025-08-29 | NP | COIDX - IDX Commodity Opportunities Fund Institutional Class Shares | 7,500 | 497 | ||||||
| 2025-07-28 | 13F | RFG Advisory, LLC | 25,948 | 610.13 | 1,720 | 634.62 | ||||
| 2025-08-07 | 13F | CENTRAL TRUST Co | 414,753 | 12.05 | 27,490 | 15.90 | ||||
| 2025-08-11 | 13F | Lake Street Financial Llc | 8,496 | 563 | ||||||
| 2025-08-12 | 13F | O'shaughnessy Asset Management, Llc | 0 | -100.00 | 0 | |||||
| 2025-04-17 | 13F | Authentikos Wealth Advisory, LLC | 0 | -100.00 | 0 | |||||
| 2025-08-07 | 13F | PFG Advisors | 16,965 | 14.21 | 1,124 | 18.19 | ||||
| 2025-07-24 | 13F | Us Bancorp \de\ | 1,145 | 21.04 | 76 | 25.00 | ||||
| 2025-08-12 | 13F | SRS Capital Advisors, Inc. | 17,926 | -0.05 | 1,188 | 3.39 | ||||
| 2025-07-07 | 13F | Global Wealth Strategies & Associates | 16,553 | -7.43 | 1,097 | -4.19 | ||||
| 2025-07-25 | 13F | Concurrent Investment Advisors, LLC | 12,953 | -35.43 | 859 | -33.23 | ||||
| 2025-08-04 | 13F | Atria Investments Llc | 12,087 | 6.35 | 801 | 10.03 | ||||
| 2025-07-30 | 13F | Parcion Private Wealth LLC | 16,182 | 10.59 | 1,073 | 14.41 | ||||
| 2025-08-14 | 13F | LaSalle St. Investment Advisors, LLC | 24,158 | 1.86 | 2 | 0.00 | ||||
| 2025-07-09 | 13F | Reyes Financial Architecture, Inc. | 4,168 | -31.90 | 276 | -29.59 | ||||
| 2025-04-29 | 13F | Brookstone Capital Management | 0 | -100.00 | 0 | |||||
| 2025-07-10 | 13F | Wealth Enhancement Advisory Services, Llc | 67,518 | -0.61 | 4,476 | 2.85 | ||||
| 2025-08-05 | 13F | Strategic Financial Concepts, LLC | 0 | -100.00 | 0 | |||||
| 2025-08-13 | 13F | Proactive Wealth Strategies LLC | 87,093 | 2.96 | 6 | 0.00 | ||||
| 2025-07-23 | 13F | Kingswood Wealth Advisors, Llc | 67,929 | 8.12 | 4,502 | 11.82 | ||||
| 2025-08-14 | 13F/A | Rockefeller Capital Management L.P. | 25,735 | 20.49 | 1,706 | 24.63 | ||||
| 2025-08-05 | 13F | Bank Of Montreal /can/ | 5,786 | 11.29 | 384 | 15.02 | ||||
| 2025-05-15 | 13F | Concorde Asset Management, LLC | 7,482 | 10.24 | 469 | 5.16 | ||||
| 2025-08-07 | 13F | Vise Technologies, Inc. | 13,848 | 104.19 | 918 | 105.61 | ||||
| 2025-08-13 | 13F | Mount Yale Investment Advisors, LLC | 0 | -100.00 | 0 | |||||
| 2025-08-13 | 13F | Gateway Wealth Partners, LLC | 29,892 | -10.75 | 1,981 | -7.69 |