Mga Batayang Estadistika
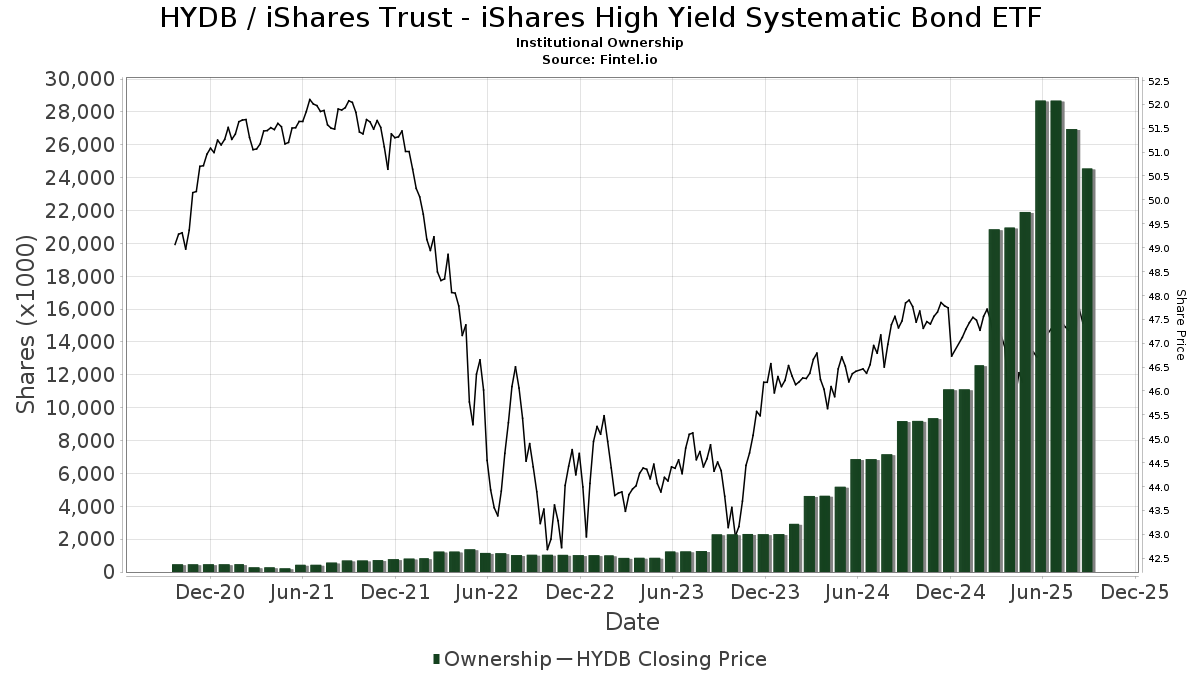
| Pemilik Institusional | 233 total, 233 long only, 0 short only, 0 long/short - change of -11.03% MRQ |
| Alokasi Portofolio Rata-rata | 0.5174 % - change of 4.37% MRQ |
| Saham Institusional (Jangka Panjang) | 24,557,262 (ex 13D/G) - change of -4.13MM shares -14.40% MRQ |
| Nilai Institusional (Jangka Panjang) | $ 1,118,244 USD ($1000) |
Kepemilikan Institusional dan Pemegang Saham
iShares Trust - iShares High Yield Systematic Bond ETF (US:HYDB) memiliki 233 pemilik institusional dan pemegang saham yang telah mengajukan formulir 13D/G atau 13F kepada Komisi Bursa Efek (Securities Exchange Commission/SEC). Lembaga-lembaga ini memegang total 24,557,262 saham. Pemegang saham terbesar meliputi Renaissancere Holdings Ltd, Bank Of America Corp /de/, Envestnet Asset Management Inc, Wealthspire Advisors, LLC, LPL Financial LLC, Ameriprise Financial Inc, State of New Jersey Common Pension Fund D, Strategic Planning Group, Llc, Insight Wealth Strategies, LLC, and Northern Lights Fund Trust - Sierra Tactical Bond Fund Investor Class Shares .
Struktur kepemilikan institusional iShares Trust - iShares High Yield Systematic Bond ETF (BATS:HYDB) menunjukkan posisi terkini di perusahaan oleh institusi dan dana, serta perubahan terbaru dalam ukuran posisi. Pemegang saham utama dapat mencakup investor individu, reksa dana, dana lindung nilai, atau institusi. Jadwal 13D menunjukkan bahwa investor memegang (atau pernah memegang) lebih dari 5% saham perusahaan dan bermaksud (atau pernah bermaksud) untuk secara aktif mengejar perubahan strategi bisnis. Jadwal 13G menunjukkan investasi pasif lebih dari 5%.
The share price as of September 5, 2025 is 47.58 / share. Previously, on September 6, 2024, the share price was 47.39 / share. This represents an increase of 0.41% over that period.
Skor Sentimen Dana
Skor Sentimen Dana (sebelumnya dikenal sebagai Skor Akumulasi Kepemilikan) menemukan saham-saham yang paling banyak dibeli oleh dana. Ini adalah hasil dari model kuantitatif multi-faktor yang canggih yang mengidentifikasi perusahaan dengan tingkat akumulasi institusional tertinggi. Model penilaian menggunakan kombinasi dari total peningkatan pemilik yang diungkapkan, perubahan dalam alokasi portofolio pada pemilik tersebut, dan metrik lainnya. Angka berkisar dari 0 hingga 100, dengan angka yang lebih tinggi menunjukkan tingkat akumulasi yang lebih tinggi dibandingkan dengan perusahaan sejenisnya, dan 50 adalah rata-ratanya.
Frekuensi Pembaruan: Setiap Hari
Lihat Ownership Explorer, yang menyediakan daftar perusahaan dengan peringkat tertinggi.
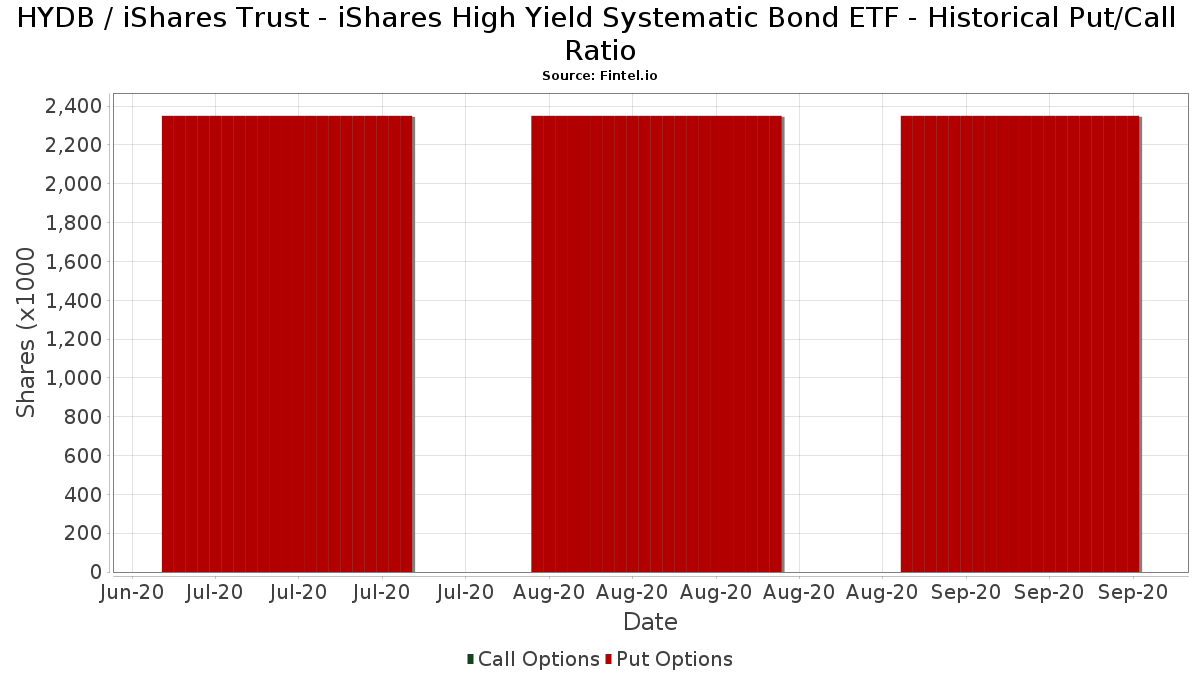
Rasio Put/Call Institusional
Selain melaporkan isu ekuitas dan utang standar, institusi dengan aset di bawah manajemen lebih dari 100 juta dolar AS juga harus mengungkapkan kepemilikan opsi put dan call mereka. Karena opsi put umumnya menunjukkan sentimen negatif, dan opsi call menunjukkan sentimen positif, kita dapat mengetahui sentimen institusional secara keseluruhan dengan memplot rasio put terhadap call. Grafik di sebelah kanan memplot rasio put/call historis untuk instrumen ini.
Menggunakan Rasio Put/Call sebagai indikator sentimen investor mengatasi salah satu kekurangan utama dari penggunaan total kepemilikan institusional, yaitu sejumlah besar aset yang dikelola diinvestasikan secara pasif untuk melacak indeks. Dana yang dikelola secara pasif biasanya tidak membeli opsi, sehingga indikator rasio put/call lebih akurat dalam melacak sentimen dana yang dikelola secara aktif.
Pengajuan 13F dan NPORT
Detail pada pengajuan 13F tersedia gratis. Detail pada pengajuan NP memerlukan keanggotaan premium. Baris berwarna hijau menunjukkan posisi baru. Baris berwarna merah menunjukkan posisi yang sudah ditutup. Klik tautan ini ikon untuk melihat riwayat transaksi selengkapnya.
Tingkatkan
untuk membuka data premium dan mengekspor ke Excel ![]() .
.
| Tanggal File | Sumber | Investor | Ketik | Presyo ng Avg (Silangan) |
Saham | Δ Saham (%) |
Dilaporkan Nilai ($1000) |
Nilai Δ (%) |
Alokasi Port (%) |
|
|---|---|---|---|---|---|---|---|---|---|---|
| 2025-08-04 | 13F | Arkadios Wealth Advisors | 15,761 | 12.88 | 748 | 13.85 | ||||
| 2025-07-21 | 13F | Ascent Group, LLC | 21,150 | -62.18 | 1,004 | -61.87 | ||||
| 2025-08-14 | 13F | Synovus Financial Corp | 28,840 | 113.38 | 1,369 | 115.25 | ||||
| 2025-07-24 | 13F | Endeavor Private Wealth, Inc. | 0 | -100.00 | 0 | |||||
| 2025-05-22 | NP | MNHYX - High Yield Bond Series Class S | 392,550 | -6.44 | 18,485 | -6.28 | ||||
| 2025-08-14 | 13F | Ancora Advisors, LLC | 101 | 0.00 | 5 | 0.00 | ||||
| 2025-07-30 | 13F | Onyx Bridge Wealth Group LLC | 9,629 | 457 | ||||||
| 2025-08-07 | 13F | Allworth Financial LP | 22,286 | -1.53 | 1,058 | 0.95 | ||||
| 2025-05-06 | 13F | Venturi Wealth Management, LLC | 0 | -100.00 | 0 | |||||
| 2025-07-29 | 13F | Stratos Wealth Partners, LTD. | 53,407 | 6.49 | 2,536 | 7.37 | ||||
| 2025-08-06 | 13F | Commonwealth Equity Services, Llc | 28,599 | -73.83 | 1 | -80.00 | ||||
| 2025-07-29 | 13F | Two West Capital Advisors LLC | 4,879 | 5.54 | 231 | 11.06 | ||||
| 2025-07-18 | 13F | SigFig Wealth Management, LLC | 4,602 | -58.42 | 218 | -58.27 | ||||
| 2025-08-11 | 13F | Copperleaf Capital, LLC | 10,555 | 16.44 | 501 | 17.61 | ||||
| 2025-07-15 | 13F | North Star Investment Management Corp. | 1,175 | 0.00 | 56 | 0.00 | ||||
| 2025-07-07 | 13F | Retirement Wealth Solutions LLC | 171 | -76.80 | 8 | -76.47 | ||||
| 2025-07-24 | 13F | JB Capital LLC | 4,769 | -24.13 | 226 | -23.39 | ||||
| 2025-08-08 | 13F | Kingsview Wealth Management, LLC | 14,597 | 0.81 | 693 | 1.62 | ||||
| 2025-07-09 | 13F | Breakwater Capital Group | 10,920 | 55.76 | 518 | 56.97 | ||||
| 2025-08-05 | 13F | Bank Of Montreal /can/ | 0 | -100.00 | 0 | |||||
| 2025-08-12 | 13F | BlackRock, Inc. | 182,180 | -62.99 | 8,649 | -62.69 | ||||
| 2025-07-31 | 13F | State of New Jersey Common Pension Fund D | 563,120 | 0.00 | 26,734 | 0.82 | ||||
| 2025-07-30 | 13F | Brookstone Capital Management | 0 | -100.00 | 0 | |||||
| 2025-05-07 | 13F | Spectrum Wealth Counsel, LLC | 5,383 | 10.74 | 253 | 10.96 | ||||
| 2025-08-11 | 13F | United Capital Financial Advisers, Llc | 49,329 | -59.22 | 2,342 | -58.89 | ||||
| 2025-04-22 | 13F | Veridan Wealth LLC | 48,822 | 3.60 | 2,299 | 3.37 | ||||
| 2025-08-15 | 13F | Captrust Financial Advisors | 250,133 | -48.89 | 11,874 | -48.47 | ||||
| 2025-08-01 | 13F | Liberty Wealth Management Llc | 5,496 | -54.20 | 261 | -22.62 | ||||
| 2025-08-07 | 13F | Resources Investment Advisors, LLC. | 73,142 | -9.50 | 3,472 | -8.75 | ||||
| 2025-08-14 | 13F | Peapack Gladstone Financial Corp | 0 | -100.00 | 0 | |||||
| 2025-08-12 | 13F | CIBC Private Wealth Group, LLC | 0 | -100.00 | 0 | |||||
| 2025-07-17 | 13F | Park Place Capital Corp | 70 | -36.94 | 3 | -40.00 | ||||
| 2025-07-15 | 13F | FLP Wealth Management, LLC | 0 | -100.00 | 0 | |||||
| 2025-05-15 | 13F | Citadel Advisors Llc | 0 | -100.00 | 0 | |||||
| 2025-08-14 | 13F | Kovitz Investment Group Partners, LLC | 0 | -100.00 | 0 | -100.00 | ||||
| 2025-07-29 | 13F | Horst & Graben Wealth Management LLC | 0 | -100.00 | 0 | |||||
| 2025-08-13 | 13F | Johnson Financial Group, Inc. | 0 | -100.00 | 0 | |||||
| 2025-08-14 | 13F | Mariner, LLC | 74,203 | 3,523 | ||||||
| 2025-08-14 | 13F | UBS Group AG | 227,285 | 22.83 | 10,790 | 23.84 | ||||
| 2025-08-14 | 13F | CoreCap Advisors, LLC | 88 | -79.63 | 4 | -80.00 | ||||
| 2025-08-18 | 13F | Front Row Advisors LLC | 100 | 0.00 | 5 | 0.00 | ||||
| 2025-07-25 | 13F | Sequoia Financial Advisors, LLC | 0 | -100.00 | 0 | |||||
| 2025-07-14 | 13F | U.S. Capital Wealth Advisors, LLC | 9,281 | -64.52 | 441 | -64.26 | ||||
| 2025-08-14 | 13F | Atomi Financial Group, Inc. | 208,301 | 8.49 | 9,889 | 9.38 | ||||
| 2025-07-24 | 13F | Leo Wealth, LLC | 29,345 | 1,393 | ||||||
| 2025-08-14 | 13F | Sunbelt Securities, Inc. | 1,879 | 76.76 | 88 | 76.00 | ||||
| 2025-08-14 | 13F | Mml Investors Services, Llc | 222,439 | -19.05 | 11 | -16.67 | ||||
| 2025-07-18 | 13F | Madrona Financial Services, LLC | 7,694 | 6.80 | 365 | 7.67 | ||||
| 2025-08-11 | 13F | Mach-1 Financial Group, Inc. | 0 | -100.00 | 0 | |||||
| 2025-08-11 | 13F | Outlook Wealth Advisors, LLC | 292,055 | 1.46 | 13,865 | 2.29 | ||||
| 2025-07-16 | 13F | Moisand Fitzgerald Tamayo, LLC | 306 | 0.00 | 15 | 0.00 | ||||
| 2025-08-12 | 13F | Steward Partners Investment Advisory, Llc | 2,074 | -75.35 | 98 | -75.25 | ||||
| 2025-08-08 | 13F | Advisory Resource Group | 74,098 | 8.68 | 3,518 | 9.56 | ||||
| 2025-07-25 | 13F | Retirement Planning Group, Llc / Ny | 56,218 | 0.33 | 2,669 | 1.14 | ||||
| 2025-07-25 | 13F | Wells Financial Advisors INC | 320 | 0.00 | 15 | 0.00 | ||||
| 2025-08-07 | 13F | Shared Vision Wealth Group LLC | 4,803 | -51.85 | 228 | -51.60 | ||||
| 2025-07-28 | 13F | Cypress Wealth Services, LLC | 0 | -100.00 | 0 | |||||
| 2025-08-26 | NP | EVMLX - The E-Valuator Moderate (50%-70%) RMS Fund Service Class Shares | 26,618 | -12.58 | 1,264 | -11.86 | ||||
| 2025-04-28 | 13F | Actinver Wealth Management, Inc. | 0 | -100.00 | 0 | |||||
| 2025-08-11 | 13F | Summit Wealth Partners, LLC | 11,760 | -49.28 | 558 | -48.85 | ||||
| 2025-07-14 | 13F | Abound Wealth Management | 0 | -100.00 | 0 | |||||
| 2025-07-10 | 13F | Exchange Traded Concepts, Llc | 11,975 | 0.06 | 569 | 0.89 | ||||
| 2025-07-24 | 13F | MA Private Wealth | 137,856 | 1,340.35 | 6,545 | 1,354.22 | ||||
| 2025-09-04 | 13F/A | Advisor Group Holdings, Inc. | 277,421 | 22.14 | 13,156 | 22.99 | ||||
| 2025-07-25 | 13F | ONE Advisory Partners, LLC | 0 | -100.00 | 0 | |||||
| 2025-07-23 | 13F | Prime Capital Investment Advisors, LLC | 7,777 | -2.71 | 369 | -1.86 | ||||
| 2025-07-29 | 13F | ShoreHaven Wealth Partners, LLC | 0 | -100.00 | 0 | |||||
| 2025-08-14 | 13F | Guardian Wealth Advisors, Llc / Nc | 0 | -100.00 | 0 | |||||
| 2025-08-14 | 13F | Royal Bank Of Canada | 19,994 | -14.30 | 949 | -13.65 | ||||
| 2025-07-14 | 13F | Strategic Planning Group, Llc | 496,220 | 8.65 | 23,558 | 9.54 | ||||
| 2025-08-12 | 13F | Coldstream Capital Management Inc | 0 | -100.00 | 0 | |||||
| 2025-08-14 | 13F | Balanced Rock Investment Advisor | 6,385 | 7.09 | 303 | 8.21 | ||||
| 2025-08-13 | 13F | Twin Peaks Wealth Advisors, LLC | 48 | 2 | ||||||
| 2025-07-23 | 13F | Watershed Private Wealth Llc | 23,609 | -1.40 | 1,121 | -0.62 | ||||
| 2025-07-31 | 13F | Cambridge Investment Research Advisors, Inc. | 44,203 | -20.27 | 2 | 0.00 | ||||
| 2025-07-10 | 13F | Sovran Advisors, LLC | 24,346 | 71.01 | 1,147 | 76.04 | ||||
| 2025-07-23 | 13F | Steel Peak Wealth Management LLC | 18,399 | -49.81 | 873 | -49.42 | ||||
| 2025-07-22 | 13F | Bay Harbor Wealth Management, LLC | 2,358 | -61.46 | 112 | -61.46 | ||||
| 2025-08-13 | 13F | BCJ Capital Management, LLC | 13,121 | -50.19 | 623 | -49.84 | ||||
| 2025-07-24 | 13F | Jfs Wealth Advisors, Llc | 16,902 | 1.52 | 802 | 2.30 | ||||
| 2025-05-15 | 13F/A | Orion Portfolio Solutions, LLC | 5,830 | 17.87 | 275 | 18.10 | ||||
| 2025-07-11 | 13F | Matthew Goff Investment Advisor, LLC | 5,321 | -16.47 | 253 | -15.72 | ||||
| 2025-07-09 | 13F | Dynamic Advisor Solutions LLC | 45,373 | 5.27 | 2,154 | 6.16 | ||||
| 2025-08-12 | 13F | MAI Capital Management | 16 | 0.00 | 1 | |||||
| 2025-08-06 | 13F | Summit Investment Advisors, Inc. | 8,065 | 1.90 | 380 | 3.84 | ||||
| 2025-08-14 | 13F | Diversify Advisory Services, LLC | 0 | -100.00 | 0 | |||||
| 2025-08-27 | 13F | Barnes Wealth Management Group, Inc | 0 | -100.00 | 0 | |||||
| 2025-08-26 | NP | EVGLX - The E-Valuator Growth (70%-85%) RMS Fund Service Class Shares | 13,031 | -0.97 | 619 | -0.16 | ||||
| 2025-08-08 | 13F | Meridian Wealth Management, LLC | 10,787 | 36.20 | 512 | 37.63 | ||||
| 2025-07-21 | 13F | Ameriflex Group, Inc. | 1,795 | 66.36 | 85 | 68.00 | ||||
| 2025-07-11 | 13F | Adirondack Trust Co | 882 | 0.00 | 42 | 0.00 | ||||
| 2025-07-29 | 13F | Liberty Square Wealth Partners Llc | 100,852 | 134.14 | 4,788 | 136.05 | ||||
| 2025-08-04 | 13F | Atria Investments Llc | 21,832 | -46.51 | 1,036 | -46.07 | ||||
| 2025-07-09 | 13F | Westbourne Investments, Inc. | 17,123 | 0.00 | 813 | 0.74 | ||||
| 2025-08-11 | 13F | Tidemark, LLC | 14,987 | -9.06 | 711 | -8.38 | ||||
| 2025-08-14 | 13F | Wells Fargo & Company/mn | 21 | -89.50 | 1 | -88.89 | ||||
| 2025-08-08 | 13F | Emerald Investment Partners, Llc | 4,599 | -47.49 | 218 | -47.09 | ||||
| 2025-07-22 | 13F | Merit Financial Group, LLC | 22,428 | -58.55 | 1,065 | -58.24 | ||||
| 2025-08-08 | 13F | IMA Wealth, Inc. | 269,294 | 2.40 | 12,785 | 3.24 | ||||
| 2025-08-26 | 13F/A | Thrivent Financial For Lutherans | 20,672 | 11.85 | 1 | |||||
| 2025-05-14 | 13F | Caitlin John, LLC | 0 | -100.00 | 0 | |||||
| 2025-07-14 | 13F | Cobblestone Asset Management LLC | 0 | -100.00 | 0 | |||||
| 2025-07-17 | 13F/A | Capital Investment Advisors, LLC | 8,495 | -5.56 | 403 | -4.73 | ||||
| 2025-08-11 | 13F | PAX Financial Group, LLC | 0 | -100.00 | 0 | |||||
| 2025-07-10 | 13F | Oliver Lagore Vanvalin Investment Group | 415 | -2.35 | 20 | 0.00 | ||||
| 2025-08-08 | 13F | Pnc Financial Services Group, Inc. | 1,434 | 36.70 | 68 | 38.78 | ||||
| 2025-08-12 | 13F | Change Path, LLC | 57,148 | 4.35 | 2,713 | 5.24 | ||||
| 2025-07-25 | 13F | Cwm, Llc | 264,339 | -47.41 | 13 | -47.83 | ||||
| 2025-08-05 | 13F | Claro Advisors LLC | 0 | -100.00 | 0 | |||||
| 2025-08-13 | 13F | Victory Financial Group, Llc | 0 | -100.00 | 0 | |||||
| 2025-08-14 | 13F | Brinker Capital Investments, LLC | 0 | -100.00 | 0 | |||||
| 2025-08-12 | 13F | Integrated Advisors Network LLC | 0 | -100.00 | 0 | |||||
| 2025-04-30 | 13F | POM Investment Strategies, LLC | 0 | -100.00 | 0 | |||||
| 2025-07-21 | 13F | Ameritas Advisory Services, LLC | 2,430 | 115 | ||||||
| 2025-07-25 | 13F | Atria Wealth Solutions, Inc. | 23,019 | -43.73 | 1,093 | -43.30 | ||||
| 2025-08-14 | 13F | Icon Wealth Advisors, LLC | 4,911 | -61.19 | 233 | -60.84 | ||||
| 2025-08-14 | 13F | Ameriprise Financial Inc | 853,852 | 12.77 | 40,537 | 13.68 | ||||
| 2025-07-31 | 13F | Glass Jacobson Investment Advisors llc | 0 | -100.00 | 0 | |||||
| 2025-07-31 | 13F | TSA Wealth Managment LLC | 10,874 | -60.01 | 516 | -59.69 | ||||
| 2025-08-12 | 13F | Cook Wealth Management Group Llc | 0 | -100.00 | 0 | |||||
| 2025-07-17 | 13F | Janney Montgomery Scott LLC | 34,131 | -66.60 | 2 | -75.00 | ||||
| 2025-08-01 | 13F | Rossby Financial, LCC | 91 | 4 | ||||||
| 2025-08-11 | 13F | Aptus Capital Advisors, LLC | 2,666 | -19.77 | 127 | -19.23 | ||||
| 2025-08-12 | 13F | LPL Financial LLC | 897,478 | -20.50 | 42,608 | -19.85 | ||||
| 2025-07-30 | 13F | TFB Advisors LLC | 24,275 | 19.39 | 1,152 | 20.38 | ||||
| 2025-08-08 | 13F | Cetera Investment Advisers | 301,795 | -31.03 | 14,328 | -30.47 | ||||
| 2025-05-27 | NP | BlackRock Funds II - BLACKROCK 40/60 TARGET ALLOCATION FUND INSTITUTIONAL SHARES | 298,821 | 9.78 | 14,071 | 9.97 | ||||
| 2025-08-11 | 13F | Independent Advisor Alliance | 7,243 | 33.00 | 344 | 33.98 | ||||
| 2025-08-13 | 13F | Cerity Partners LLC | 16,142 | 766 | ||||||
| 2025-07-24 | 13F | Us Bancorp \de\ | 18,430 | -53.26 | 875 | -52.91 | ||||
| 2025-04-11 | 13F | Snider Financial Group | 0 | -100.00 | 0 | |||||
| 2025-04-21 | 13F | Nelson, Van Denburg & Campbell Wealth Management Group, LLC | 0 | -100.00 | 0 | |||||
| 2025-04-14 | 13F | Strategic Wealth Designers | 0 | -100.00 | 0 | -100.00 | ||||
| 2025-08-14 | 13F | Tennessee Valley Asset Management Partners | 0 | -100.00 | 0 | |||||
| 2025-08-01 | 13F | Capital Investment Counsel, LLC | 320,003 | 9.91 | 15,192 | 10.81 | ||||
| 2025-08-07 | 13F | Summit X, LLC | 46,940 | -16.72 | 2,229 | -16.05 | ||||
| 2025-07-28 | 13F | Pettinga Financial Advisors, LLC | 0 | -100.00 | 0 | |||||
| 2025-07-29 | 13F | Systelligence, LLC | 81,442 | -16.91 | 3,866 | -16.23 | ||||
| 2025-08-05 | 13F | Tsfg, Llc | 1,556 | -66.99 | 0 | |||||
| 2025-08-11 | 13F | Wealthspire Advisors, LLC | 1,263,546 | 1.57 | 59,987 | 2.40 | ||||
| 2025-08-14 | 13F/A | Rockefeller Capital Management L.P. | 15,058 | 715 | ||||||
| 2025-07-25 | 13F | Apollon Wealth Management, LLC | 316,362 | 868.03 | 15,019 | 876.53 | ||||
| 2025-07-10 | 13F | Sharkey, Howes & Javer | 4,690 | -79.06 | 223 | -78.94 | ||||
| 2025-08-04 | 13F | Spire Wealth Management | 937 | -14.27 | 44 | -13.73 | ||||
| 2025-08-01 | 13F | Cedar Point Capital Partners, LLC | 0 | -100.00 | 0 | |||||
| 2025-08-06 | 13F | Legacy Wealth Managment, LLC/ID | 0 | -100.00 | 0 | |||||
| 2025-08-14 | 13F | Integrated Wealth Concepts LLC | 14,253 | -58.46 | 677 | -58.14 | ||||
| 2025-08-14 | 13F | Wiley Bros.-aintree Capital, Llc | 8,402 | 399 | ||||||
| 2025-08-18 | 13F/A | Kestra Investment Management, LLC | 90,080 | 41.88 | 4,277 | 43.06 | ||||
| 2025-08-11 | 13F | HighTower Advisors, LLC | 21,663 | -1.50 | 1,028 | -0.68 | ||||
| 2025-08-13 | 13F | Manning & Napier Advisors Llc | 1,111 | -99.72 | 53 | -99.72 | ||||
| 2025-07-14 | 13F | AdvisorNet Financial, Inc | 112 | -40.43 | 5 | -37.50 | ||||
| 2025-08-08 | 13F | Security Financial Services, INC. | 28,383 | -11.07 | 1,347 | -10.32 | ||||
| 2025-08-12 | 13F | Armor Investment Advisors, LLC | 20,781 | 5.73 | 987 | 6.59 | ||||
| 2025-08-14 | 13F | IHT Wealth Management, LLC | 161,078 | -63.56 | 7,647 | -63.26 | ||||
| 2025-08-14 | 13F | Raymond James Financial Inc | 121,426 | 14.57 | 5,765 | 15.51 | ||||
| 2025-05-14 | 13F | Huntington National Bank | 0 | |||||||
| 2025-08-14 | 13F | EP Wealth Advisors, Inc. | 2,904 | 138 | ||||||
| 2025-08-05 | 13F | Summit Investment Advisory Services, LLC | 8,018 | 381 | ||||||
| 2025-04-15 | 13F | Collier Financial | 184 | -98.30 | 9 | -98.43 | ||||
| 2025-08-13 | 13F | Capital Analysts, Inc. | 2,882 | -32.30 | 0 | |||||
| 2025-08-13 | 13F | Northwestern Mutual Wealth Management Co | 4,864 | -15.22 | 231 | -14.81 | ||||
| 2025-08-14 | 13F | Stifel Financial Corp | 28,166 | -54.68 | 1,337 | -54.31 | ||||
| 2025-08-12 | 13F | J.w. Cole Advisors, Inc. | 28,902 | 1,372 | ||||||
| 2025-07-18 | 13F | SOA Wealth Advisors, LLC. | 2,940 | 140 | ||||||
| 2025-08-11 | 13F | Cornerstone Planning Group LLC | 339,170 | 6.64 | 16,016 | 9.68 | ||||
| 2025-08-04 | 13F | Savvy Advisors, Inc. | 79,087 | 32.64 | 3,755 | 33.74 | ||||
| 2025-08-08 | 13F | Foundations Investment Advisors, LLC | 55,174 | -61.72 | 2,619 | -61.41 | ||||
| 2025-08-26 | NP | BlackRock Funds II - BLACKROCK 20/80 TARGET ALLOCATION FUND INSTITUTIONAL SHARES | 181,082 | -3.13 | 8,597 | -2.34 | ||||
| 2025-07-25 | 13F | Midwest Capital Advisors, LLC | 3,655 | -85.74 | 174 | -85.66 | ||||
| 2025-07-25 | 13F | Apollon Financial, LLC | 9,918 | 471 | ||||||
| 2025-08-13 | 13F | Colonial Trust Co / SC | 196 | 9 | ||||||
| 2025-04-25 | 13F | TBH Global Asset Management, LLC | 0 | -100.00 | 0 | |||||
| 2025-08-12 | 13F | Proequities, Inc. | 0 | 0 | ||||||
| 2025-04-22 | 13F | Synergy Financial Management, LLC | 0 | -100.00 | 0 | |||||
| 2025-07-11 | 13F | Farther Finance Advisors, LLC | 5,307 | -49.48 | 252 | -48.98 | ||||
| 2025-05-14 | 13F | GM Advisory Group, Inc. | 0 | -100.00 | 0 | |||||
| 2025-07-17 | 13F | Raleigh Capital Management Inc. | 0 | -100.00 | 0 | |||||
| 2025-07-21 | 13F | Mirae Asset Global Investments Co., Ltd. | 0 | -100.00 | 0 | |||||
| 2025-07-21 | 13F | Keystone Financial Group, Inc. | 2,978 | 53.03 | 141 | 57.30 | ||||
| 2025-08-13 | 13F | Continuum Advisory, LLC | 34,837 | -0.65 | 1,654 | 0.12 | ||||
| 2025-07-16 | 13F | St Germain D J Co Inc | 190 | 9 | ||||||
| 2025-07-23 | 13F | Lansing Street Advisors | 13,651 | 14.90 | 648 | 15.92 | ||||
| 2025-08-11 | 13F | Regal Investment Advisors LLC | 17,429 | -34.41 | 827 | -33.89 | ||||
| 2025-07-29 | 13F | Cottonwood Capital Advisors, Llc | 116,806 | 10.51 | 5,545 | 11.41 | ||||
| 2025-07-22 | 13F | Wealthcare Advisory Partners LLC | 4,335 | 206 | ||||||
| 2025-07-28 | 13F | Harbour Investments, Inc. | 84 | 4 | ||||||
| 2025-07-08 | 13F | Nbc Securities, Inc. | 1,155 | 1.85 | 0 | |||||
| 2025-07-15 | 13F | Beacon Financial Planning, Inc | 67,167 | 18.34 | 3,189 | 19.31 | ||||
| 2025-08-15 | 13F | Kestra Advisory Services, LLC | 47,490 | -3.57 | 2,255 | -2.80 | ||||
| 2025-08-12 | 13F | New Republic Capital, LLC | 0 | -100.00 | 0 | |||||
| 2025-08-12 | 13F | O'shaughnessy Asset Management, Llc | 0 | -100.00 | 0 | |||||
| 2025-07-16 | 13F | Perigon Wealth Management, LLC | 6,459 | 307 | ||||||
| 2025-08-05 | 13F | Dahring | Cusmano Llc | 178,596 | -0.45 | 8,479 | 0.36 | ||||
| 2025-08-06 | 13F | Quadrant Private Wealth Management, LLC | 0 | -100.00 | 0 | |||||
| 2025-08-05 | 13F | 5T Wealth, LLC | 9,221 | -25.86 | 438 | -25.30 | ||||
| 2025-07-16 | 13F | BOS Asset Management, LLC | 0 | -100.00 | 0 | |||||
| 2025-07-15 | 13F | Oxinas Partners Wealth Management LLC | 9,303 | -5.91 | 442 | -5.16 | ||||
| 2025-08-14 | 13F | Snowden Capital Advisors LLC | 0 | -100.00 | 0 | -100.00 | ||||
| 2025-08-14 | 13F | Comerica Bank | 3,952 | -29.34 | 188 | -28.90 | ||||
| 2025-08-05 | 13F | Prosperity Consulting Group, LLC | 0 | -100.00 | 0 | |||||
| 2025-08-12 | 13F | Park Square Financial Group, LLC | 172 | -14.00 | 8 | -11.11 | ||||
| 2025-07-17 | 13F | Kelly Financial Services LLC | 16,134 | -80.42 | 766 | -80.28 | ||||
| 2025-08-15 | 13F | Morgan Stanley | 370,713 | -25.33 | 17,600 | -24.72 | ||||
| 2025-07-30 | 13F | LGT Financial Advisors LLC | 2 | 0.00 | 0 | |||||
| 2025-07-31 | 13F | Fedenia Advisers LLC | 7,822 | -34.54 | 371 | -33.99 | ||||
| 2025-08-13 | 13F | Milestone Investment Advisors LLC | 140 | 0.00 | 7 | 0.00 | ||||
| 2025-08-04 | 13F | Pensionmark Financial Group, Llc | 13,651 | -12.35 | 648 | -11.60 | ||||
| 2025-08-12 | 13F | BlueStem Wealth Partners, LLC | 230,328 | 5,089.91 | 10,935 | 5,156.73 | ||||
| 2025-05-14 | 13F | Jane Street Group, Llc | 0 | -100.00 | 0 | |||||
| 2025-07-07 | 13F | Insight Wealth Strategies, LLC | 461,563 | 99.88 | 21,786 | 100.36 | ||||
| 2025-07-23 | 13F | Seamount Financial Group Inc | 27,370 | 3.53 | 1,299 | 4.42 | ||||
| 2025-08-04 | 13F | Creative Financial Designs Inc /adv | 2,322 | -97.88 | 110 | -97.86 | ||||
| 2025-08-13 | 13F | Avestar Capital, LLC | 29,852 | 1.58 | 1,417 | 2.46 | ||||
| 2025-07-14 | 13F | Buttonwood Financial Group, LLC | 0 | -100.00 | 0 | |||||
| 2025-08-13 | 13F | West Wealth Group, LLC | 0 | -100.00 | 0 | |||||
| 2025-08-26 | NP | EVTTX - The E-Valuator Conservative/Moderate (30%-50%) RMS Fund Service Class Shares | 9,904 | -3.21 | 470 | -2.29 | ||||
| 2025-07-31 | 13F | Opus Capital Group, LLC | 6,141 | 4.49 | 0 | |||||
| 2025-07-15 | 13F | Cranbrook Wealth Management, LLC | 9,747 | 28.49 | 463 | 29.41 | ||||
| 2025-08-08 | 13F | Avantax Advisory Services, Inc. | 57,445 | 1.91 | 2,727 | 2.75 | ||||
| 2025-07-31 | 13F | Wright Fund Managment, LLC | 240,799 | 0.00 | 11,339 | 0.00 | ||||
| 2025-08-13 | 13F | Mount Yale Investment Advisors, LLC | 2,655 | 126 | ||||||
| 2025-08-08 | 13F | Thoroughbred Financial Services, Llc | 23,600 | 0.34 | 1 | 0.00 | ||||
| 2025-08-06 | 13F | First Horizon Advisors, Inc. | 3,147 | -35.72 | 149 | -35.22 | ||||
| 2025-08-11 | 13F | Sofi Wealth, Llc | 231,698 | 11,000 | ||||||
| 2025-08-26 | NP | EVVLX - The E-Valuator Very Conservative (0%-15%) RMS Fund Service Class Shares | 14,960 | -7.20 | 710 | -6.46 | ||||
| 2025-07-24 | 13F | IFP Advisors, Inc | 50,217 | 82.26 | 2,384 | 83.73 | ||||
| 2025-08-14 | 13F | Warren Averett Asset Management, LLC | 116,319 | -1.17 | 5,522 | -0.36 | ||||
| 2025-07-18 | 13F | Pennsylvania Capital Management Inc /adv | 5,091 | 1.72 | 242 | 2.55 | ||||
| 2025-08-28 | NP | Northern Lights Fund Trust - Sierra Tactical Bond Fund Investor Class Shares | 427,800 | 77.81 | 20,310 | 79.27 | ||||
| 2025-07-17 | 13F | Sound Income Strategies, LLC | 1,091 | 1.30 | 52 | 2.00 | ||||
| 2025-08-14 | 13F | Fmr Llc | 789 | 6.62 | 37 | 8.82 | ||||
| 2025-08-14 | 13F | GWM Advisors LLC | 42,073 | -57.90 | 1,997 | -57.56 | ||||
| 2025-08-13 | 13F | GeoWealth Management, LLC | 3,964 | 188 | ||||||
| 2025-07-29 | 13F | International Assets Investment Management, Llc | 5,049 | -23.49 | 240 | -22.90 | ||||
| 2025-08-12 | 13F | Absolute Capital Management, LLC | 8,070 | -17.69 | 383 | -16.92 | ||||
| 2025-08-26 | NP | EVAGX - The E-Valuator Aggressive Growth (85%-99%) RMS Fund Service Class Shares | 2,292 | -60.93 | 109 | -60.87 | ||||
| 2025-08-05 | 13F | Dynasty Wealth Management, Llc | 64,735 | -2.37 | 3,073 | -1.57 | ||||
| 2025-07-23 | 13F | True Vision MN LLC | 0 | -100.00 | 0 | |||||
| 2025-08-05 | 13F | Bank of New York Mellon Corp | 84,846 | -42.96 | 4,028 | -42.50 | ||||
| 2025-08-11 | 13F | Principal Securities, Inc. | 9,253 | 66.87 | 439 | 68.85 | ||||
| 2025-07-15 | 13F | Mather Group, Llc. | 0 | -100.00 | 0 | |||||
| 2025-08-06 | 13F | Eukles Asset Management | 477 | 0.00 | 23 | 0.00 | ||||
| 2025-04-21 | 13F | Bay Colony Advisory Group, Inc d/b/a Bay Colony Advisors | 0 | -100.00 | 0 | -100.00 | ||||
| 2025-08-11 | 13F | Private Advisor Group, LLC | 23,946 | -3.66 | 1,137 | -2.91 | ||||
| 2025-08-14 | 13F | Modern Wealth Management, LLC | 17,288 | -40.05 | 821 | -39.57 | ||||
| 2025-07-29 | 13F | Arista Wealth Management, LLC | 10,425 | 495 | ||||||
| 2025-08-15 | 13F | High Falls Advisors, Inc | 0 | -100.00 | 0 | |||||
| 2025-08-13 | 13F | EverSource Wealth Advisors, LLC | 575 | -38.70 | 27 | -38.64 | ||||
| 2025-07-30 | 13F | Strategic Blueprint, LLC | 12,500 | -23.63 | 593 | -22.99 | ||||
| 2025-08-05 | 13F | Scarborough Advisors, LLC | 1,423 | 68 | ||||||
| 2025-08-07 | 13F | Hennion & Walsh Asset Management, Inc. | 21,614 | -1.57 | 1,026 | -0.77 | ||||
| 2025-08-04 | 13F | Twin City Private Wealth, Llc | 1,169 | 4.19 | 55 | 5.77 | ||||
| 2025-08-26 | NP | EVCLX - The E-Valuator Conservative (15%-30%) RMS Fund Service Class Shares | 14,637 | -34.03 | 695 | -33.52 | ||||
| 2025-08-12 | 13F | OneAscent Financial Services LLC | 0 | -100.00 | 0 | |||||
| 2025-08-06 | 13F | Hoxton Planning & Management, LLC | 0 | -100.00 | 0 | |||||
| 2025-07-15 | 13F | Regatta Capital Group, Llc | 5,989 | 284 | ||||||
| 2025-08-11 | 13F | CFS Investment Advisory Services, LLC | 5,233 | -71.99 | 0 | |||||
| 2025-07-23 | 13F | Nbt Bank N A /ny | 9,045 | 5.24 | 429 | 6.19 | ||||
| 2025-05-06 | 13F | Advocacy Wealth Management Services, LLC | 0 | -100.00 | 0 | |||||
| 2025-08-12 | 13F | PKS Advisory Services, LLC | 5,048 | -7.83 | 240 | -7.00 | ||||
| 2025-08-28 | NP | GPARX - GuidePath(R) Absolute Return Allocation Fund Service Shares | 107,224 | -50.91 | 5,090 | -50.51 | ||||
| 2025-07-28 | 13F | Sagespring Wealth Partners, Llc | 0 | -100.00 | 0 | |||||
| 2025-08-01 | 13F | Envestnet Asset Management Inc | 1,309,871 | -51.73 | 62,186 | -51.34 | ||||
| 2025-08-06 | 13F | AE Wealth Management LLC | 6,286 | -57.84 | 298 | -57.55 | ||||
| 2025-07-22 | 13F | Simplicity Wealth,LLC | 11,150 | 9.09 | 529 | 9.98 | ||||
| 2025-07-25 | 13F | Richardson Financial Services Inc. | 22 | -26.67 | 1 | 0.00 | ||||
| 2025-08-06 | 13F | ROI Financial Advisors, LLC | 16,116 | 59.38 | 765 | 60.71 | ||||
| 2025-08-12 | 13F | Global Retirement Partners, LLC | 6,410 | 37.64 | 304 | 39.45 | ||||
| 2025-07-29 | 13F | Private Trust Co Na | 1,176 | -48.47 | 56 | -48.60 | ||||
| 2025-08-06 | 13F | Stone House Investment Management, LLC | 344 | -89.46 | 16 | -89.54 | ||||
| 2025-08-12 | 13F | SRS Capital Advisors, Inc. | 316 | -64.89 | 15 | -64.29 | ||||
| 2025-08-19 | 13F | Cape Investment Advisory, Inc. | 344 | -8.99 | 16 | -5.88 | ||||
| 2025-07-21 | 13F | Triad Wealth Partners, LLC | 54,495 | -19.96 | 2,587 | -19.28 | ||||
| 2025-07-30 | 13F | Blume Capital Management, Inc. | 0 | -100.00 | 0 | |||||
| 2025-07-24 | 13F | Riverchase Wealth Management, Llc | 12,594 | 3.87 | 598 | 4.74 | ||||
| 2025-04-15 | 13F | Braun-Bostich & Associates Inc. | 0 | -100.00 | 0 | |||||
| 2025-08-06 | 13F | Financial Advisory Corp /ut/ /adv | 29,291 | 7.96 | 1 | 0.00 | ||||
| 2025-08-06 | 13F | Mascagni Wealth Management, Inc. | 95,560 | 1.58 | 4,537 | 2.42 | ||||
| 2025-07-25 | 13F | Envestnet Portfolio Solutions, Inc. | 80,666 | -69.40 | 3,830 | -69.15 | ||||
| 2025-04-21 | 13F | ORG Partners LLC | 0 | -100.00 | 0 | |||||
| 2025-08-13 | 13F | Correct Capital Wealth Management | 92,769 | -2.42 | 4,404 | -1.61 | ||||
| 2025-06-26 | NP | FARX - Frontier Asset Absolute Return ETF | 11,968 | -6.38 | 555 | -8.57 | ||||
| 2025-07-23 | 13F | Sax Wealth Advisors, Llc | 159,550 | 1.61 | 7,575 | 2.45 | ||||
| 2025-07-08 | 13F | TL Private Wealth | 200,616 | 1.40 | 9,463 | 7.16 | ||||
| 2025-07-08 | 13F | Parallel Advisors, LLC | 79 | 0.00 | 4 | 0.00 | ||||
| 2025-08-14 | 13F | Bank Of America Corp /de/ | 2,929,987 | -1.53 | 139,101 | -0.73 | ||||
| 2025-08-11 | 13F | Renaissancere Holdings Ltd | 5,057,726 | 0.00 | 240,116 | 0.82 | ||||
| 2025-05-16 | 13F | Jones Financial Companies Lllp | 0 | -100.00 | 0 | |||||
| 2025-07-24 | 13F | Cyndeo Wealth Partners, LLC | 0 | -100.00 | 0 | |||||
| 2025-08-15 | 13F | Equitable Holdings, Inc. | 14,371 | -34.52 | 682 | -33.98 | ||||
| 2025-07-24 | 13F | Ronald Blue Trust, Inc. | 6,390 | -56.18 | 303 | -55.83 | ||||
| 2025-08-13 | 13F | Rsm Us Wealth Management Llc | 6,225 | 296 | ||||||
| 2025-08-14 | 13F | Betterment LLC | 247,289 | 11.31 | 12 | 10.00 | ||||
| 2025-06-03 | 13F | Invst, LLC | 6,656 | -28.04 | 313 | -27.88 | ||||
| 2025-08-04 | 13F | Assetmark, Inc | 223,929 | -63.04 | 10,631 | -62.74 | ||||
| 2025-04-30 | 13F | Synergy Investment Management, LLC | 0 | -100.00 | 0 | |||||
| 2025-07-14 | 13F | Park Avenue Securities Llc | 57,598 | -61.39 | 3 | -71.43 | ||||
| 2025-08-14 | 13F | JPL Wealth Management, LLC | 8,260 | 5.83 | 392 | 6.81 | ||||
| 2025-07-18 | 13F | Truist Financial Corp | 18,615 | -58.48 | 884 | -58.17 | ||||
| 2025-08-05 | 13F | Sigma Planning Corp | 0 | -100.00 | 0 | |||||
| 2025-08-12 | 13F | Jpmorgan Chase & Co | 225,545 | -57.07 | 10,708 | -56.72 | ||||
| 2025-08-18 | 13F | Geneos Wealth Management Inc. | 635 | -33.44 | 30 | -31.82 |