Mga Batayang Estadistika
| Pemilik Institusional | 241 total, 238 long only, 0 short only, 3 long/short - change of 0.83% MRQ |
| Alokasi Portofolio Rata-rata | 0.3389 % - change of 26.75% MRQ |
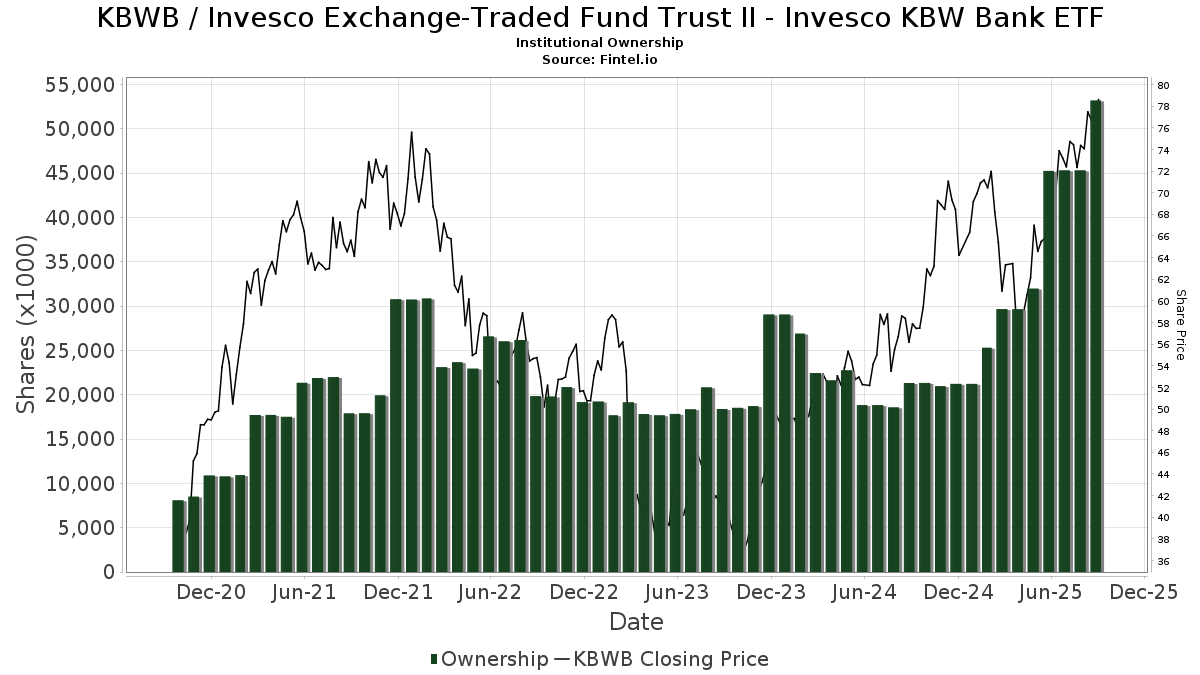
| Saham Institusional (Jangka Panjang) | 53,187,480 (ex 13D/G) - change of 7.94MM shares 17.54% MRQ |
| Nilai Institusional (Jangka Panjang) | $ 2,759,730 USD ($1000) |
Kepemilikan Institusional dan Pemegang Saham
Invesco Exchange-Traded Fund Trust II - Invesco KBW Bank ETF (US:KBWB) memiliki 241 pemilik institusional dan pemegang saham yang telah mengajukan formulir 13D/G atau 13F kepada Komisi Bursa Efek (Securities Exchange Commission/SEC). Lembaga-lembaga ini memegang total 53,187,480 saham. Pemegang saham terbesar meliputi Bank Of America Corp /de/, Migdal Insurance & Financial Holdings Ltd., Clal Insurance Enterprises Holdings Ltd, Jpmorgan Chase & Co, Menora Mivtachim Holdings Ltd., Fisher Asset Management, LLC, Goldman Sachs Group Inc, Harel Insurance Investments & Financial Services Ltd., Wharton Business Group, LLC, and Morgan Stanley .
Struktur kepemilikan institusional Invesco Exchange-Traded Fund Trust II - Invesco KBW Bank ETF (NasdaqGM:KBWB) menunjukkan posisi terkini di perusahaan oleh institusi dan dana, serta perubahan terbaru dalam ukuran posisi. Pemegang saham utama dapat mencakup investor individu, reksa dana, dana lindung nilai, atau institusi. Jadwal 13D menunjukkan bahwa investor memegang (atau pernah memegang) lebih dari 5% saham perusahaan dan bermaksud (atau pernah bermaksud) untuk secara aktif mengejar perubahan strategi bisnis. Jadwal 13G menunjukkan investasi pasif lebih dari 5%.
The share price as of September 5, 2025 is 76.55 / share. Previously, on September 6, 2024, the share price was 56.44 / share. This represents an increase of 35.63% over that period.
Skor Sentimen Dana
Skor Sentimen Dana (sebelumnya dikenal sebagai Skor Akumulasi Kepemilikan) menemukan saham-saham yang paling banyak dibeli oleh dana. Ini adalah hasil dari model kuantitatif multi-faktor yang canggih yang mengidentifikasi perusahaan dengan tingkat akumulasi institusional tertinggi. Model penilaian menggunakan kombinasi dari total peningkatan pemilik yang diungkapkan, perubahan dalam alokasi portofolio pada pemilik tersebut, dan metrik lainnya. Angka berkisar dari 0 hingga 100, dengan angka yang lebih tinggi menunjukkan tingkat akumulasi yang lebih tinggi dibandingkan dengan perusahaan sejenisnya, dan 50 adalah rata-ratanya.
Frekuensi Pembaruan: Setiap Hari
Lihat Ownership Explorer, yang menyediakan daftar perusahaan dengan peringkat tertinggi.
Rasio Put/Call Institusional
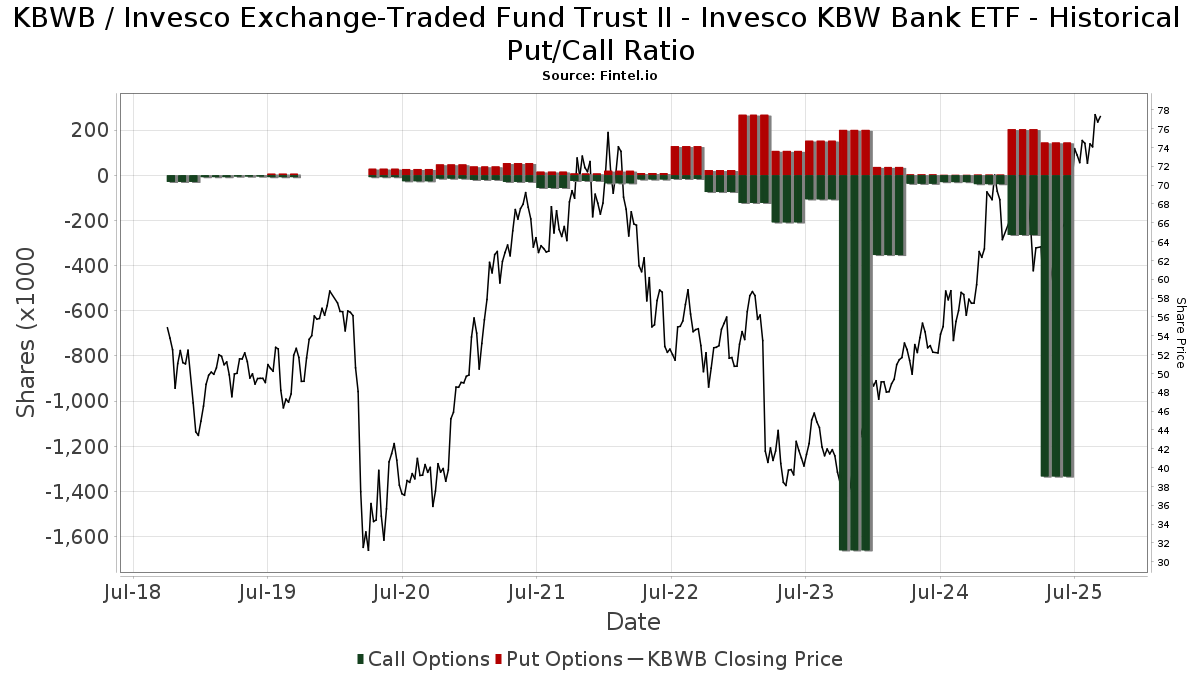
Selain melaporkan isu ekuitas dan utang standar, institusi dengan aset di bawah manajemen lebih dari 100 juta dolar AS juga harus mengungkapkan kepemilikan opsi put dan call mereka. Karena opsi put umumnya menunjukkan sentimen negatif, dan opsi call menunjukkan sentimen positif, kita dapat mengetahui sentimen institusional secara keseluruhan dengan memplot rasio put terhadap call. Grafik di sebelah kanan memplot rasio put/call historis untuk instrumen ini.
Menggunakan Rasio Put/Call sebagai indikator sentimen investor mengatasi salah satu kekurangan utama dari penggunaan total kepemilikan institusional, yaitu sejumlah besar aset yang dikelola diinvestasikan secara pasif untuk melacak indeks. Dana yang dikelola secara pasif biasanya tidak membeli opsi, sehingga indikator rasio put/call lebih akurat dalam melacak sentimen dana yang dikelola secara aktif.
Pengajuan 13F dan NPORT
Detail pada pengajuan 13F tersedia gratis. Detail pada pengajuan NP memerlukan keanggotaan premium. Baris berwarna hijau menunjukkan posisi baru. Baris berwarna merah menunjukkan posisi yang sudah ditutup. Klik tautan ini ikon untuk melihat riwayat transaksi selengkapnya.
Tingkatkan
untuk membuka data premium dan mengekspor ke Excel ![]() .
.
| Tanggal File | Sumber | Investor | Ketik | Presyo ng Avg (Silangan) |
Saham | Δ Saham (%) |
Dilaporkan Nilai ($1000) |
Nilai Δ (%) |
Alokasi Port (%) |
|
|---|---|---|---|---|---|---|---|---|---|---|
| 2025-07-17 | 13F | Janney Montgomery Scott LLC | 14,086 | 2.09 | 1 | |||||
| 2025-07-24 | 13F | Blair William & Co/il | 433 | -98.65 | 31 | -98.46 | ||||
| 2025-08-06 | 13F | Hallmark Capital Management Inc | 253,642 | 15.30 | 18,166 | 31.55 | ||||
| 2025-07-16 | 13F | Magnus Financial Group LLC | 20,428 | 14.91 | 1,463 | 31.21 | ||||
| 2025-08-13 | 13F | Baird Financial Group, Inc. | 0 | -100.00 | 0 | |||||
| 2025-08-14 | 13F | Federation des caisses Desjardins du Quebec | 16,087 | -2.92 | 1,152 | 10.77 | ||||
| 2025-08-14 | 13F | Tudor Investment Corp Et Al | 30,170 | 817.58 | 2,161 | 948.54 | ||||
| 2025-07-14 | 13F | AdvisorNet Financial, Inc | 13,339 | -1.28 | 955 | 12.62 | ||||
| 2025-07-21 | 13F | Ameritas Advisory Services, LLC | 1,193 | 85 | ||||||
| 2025-08-04 | 13F | Creative Financial Designs Inc /adv | 46 | 0.00 | 3 | 50.00 | ||||
| 2025-07-24 | NP | HASAX - Horizon Active Asset Allocation Fund Advisor Class | 349,309 | 5.47 | 22,918 | -0.58 | ||||
| 2025-08-12 | 13F | Change Path, LLC | 10,043 | 12.17 | 719 | 28.16 | ||||
| 2025-08-14 | 13F | Gotham Asset Management, LLC | 10,000 | 0.00 | 716 | 14.19 | ||||
| 2025-08-12 | 13F | Franklin Resources Inc | 7,506 | 538 | ||||||
| 2025-08-26 | NP | LCR - Leuthold Core ETF | 8,561 | 2.64 | 613 | 17.21 | ||||
| 2025-07-28 | 13F | Harbour Investments, Inc. | 250 | -6.02 | 18 | 6.25 | ||||
| 2025-08-14 | 13F | Two Sigma Securities, Llc | 0 | -100.00 | 0 | |||||
| 2025-08-08 | 13F | WP Advisors, LLC | 93,352 | 0.95 | 6,686 | 15.18 | ||||
| 2025-08-12 | 13F | Quadcap Wealth Management, LLC | 54,782 | -0.66 | 3,923 | 13.35 | ||||
| 2025-05-15 | 13F | Glenmede Trust Co Na | 4,890 | 0.00 | 307 | -4.08 | ||||
| 2025-08-14 | 13F | Broadleaf Partners, LLC | 4,841 | 0.00 | 347 | 14.19 | ||||
| 2025-07-23 | 13F | Meitav Dash Investments Ltd | 40,455 | 60.66 | 2,897 | 83.35 | ||||
| 2025-08-15 | 13F | Morgan Stanley | 1,109,116 | 7.65 | 79,435 | 22.83 | ||||
| 2025-05-05 | 13F | Montag A & Associates Inc | 0 | -100.00 | 0 | |||||
| 2025-08-13 | 13F | Quadrature Capital Ltd | 0 | -100.00 | 0 | |||||
| 2025-08-13 | 13F | Sanibel Captiva Trust Company, Inc. | 5,120 | 0.00 | 367 | 14.02 | ||||
| 2025-05-15 | 13F | CAPROCK Group, Inc. | 3,831 | 5.07 | 240 | 0.84 | ||||
| 2025-08-14 | 13F | UBS Group AG | 343,850 | 17.58 | 24,627 | 34.16 | ||||
| 2025-08-12 | 13F | Financial Advocates Investment Management | 0 | -100.00 | 0 | |||||
| 2025-08-14 | 13F | Ieq Capital, Llc | 4,954 | 55.10 | 355 | 77.00 | ||||
| 2025-08-14 | 13F | UBS Group AG | Call | 268,100 | 19,201 | |||||
| 2025-08-13 | 13F | Advocacy Wealth Management Services, LLC | 38,543 | -17.17 | 2,760 | -5.48 | ||||
| 2025-08-14 | 13F | Fosun International Ltd | 0 | -100.00 | 0 | |||||
| 2025-07-10 | 13F | Rockland Trust Co | 15,335 | -7.54 | 1,098 | 5.48 | ||||
| 2025-08-14 | 13F | Comerica Bank | 1,755 | 47.60 | 126 | 68.92 | ||||
| 2025-08-13 | 13F | Collar Capital Management, LLC | 2,969 | 213 | ||||||
| 2025-08-14 | 13F | Aragon Global Management, LP | 0 | -100.00 | 0 | |||||
| 2025-07-30 | 13F | WESPAC Advisors SoCal, LLC | 18,716 | -2.16 | 1,340 | 11.67 | ||||
| 2025-04-22 | 13F | Synergy Financial Management, LLC | 0 | -100.00 | 0 | |||||
| 2025-07-24 | 13F | Mainstay Capital Management Llc /adv | 15,126 | -8.20 | 1,083 | 4.74 | ||||
| 2025-07-30 | 13F | Axecap Investments, LLC | 0 | -100.00 | 0 | |||||
| 2025-08-12 | 13F | Aviso Financial Inc. | 98 | 7 | ||||||
| 2025-08-14 | 13F | Pentwater Capital Management LP | Put | 0 | -100.00 | 0 | ||||
| 2025-07-21 | 13F | Mirae Asset Global Investments Co., Ltd. | 12,388 | 887 | ||||||
| 2025-08-04 | 13F | Hantz Financial Services, Inc. | 66 | 0 | ||||||
| 2025-08-14 | 13F | Ulysses Management LLC | 0 | -100.00 | 0 | -100.00 | ||||
| 2025-08-19 | 13F | Delos Wealth Advisors, LLC | 31,291 | -8.03 | 2,241 | 4.96 | ||||
| 2025-08-13 | 13F | Twin Peaks Wealth Advisors, LLC | 100 | 7 | ||||||
| 2025-08-14 | 13F | Quantinno Capital Management LP | 41,976 | 2.79 | 3,006 | 17.28 | ||||
| 2025-07-08 | 13F | Webster Bank, N. A. | 861 | 0.00 | 62 | 12.96 | ||||
| 2025-08-13 | 13F | Cerity Partners LLC | 5,213 | 2.64 | 373 | 17.30 | ||||
| 2025-08-13 | 13F | Flow Traders U.s. Llc | 5,612 | -73.64 | 0 | -100.00 | ||||
| 2025-08-08 | 13F | Capital Investment Advisory Services, LLC | 0 | -100.00 | 0 | |||||
| 2025-08-13 | 13F | Capital Analysts, Inc. | 54 | -25.00 | 0 | |||||
| 2025-07-11 | 13F | Farther Finance Advisors, LLC | 1,243 | -83.80 | 89 | -81.38 | ||||
| 2025-05-16 | 13F | Laidlaw Wealth Management LLC | 0 | -100.00 | 0 | |||||
| 2025-08-13 | 13F | M&t Bank Corp | 5,000 | 0.00 | 358 | 14.38 | ||||
| 2025-07-18 | 13F | PFG Investments, LLC | 3,860 | 0.00 | 276 | 14.05 | ||||
| 2025-08-04 | 13F | Atria Investments Llc | 3,531 | -49.82 | 253 | -42.86 | ||||
| 2025-08-08 | 13F | Hartland & Co., LLC | 372 | 0.27 | 27 | 13.04 | ||||
| 2025-08-11 | 13F | Tidemark, LLC | 194 | 0.00 | 14 | 8.33 | ||||
| 2025-08-13 | 13F | Congress Wealth Management LLC / DE / | 692,760 | -27.52 | 49,616 | -17.31 | ||||
| 2025-07-24 | 13F | Stonebridge Financial Group, LLC | 0 | -100.00 | 0 | |||||
| 2025-08-14 | 13F | Wharton Business Group, LLC | 1,914,019 | 6.56 | 137 | 21.43 | ||||
| 2025-08-07 | 13F | Investment Management Corp /va/ /adv | 12,927 | 2.25 | 926 | 16.65 | ||||
| 2025-05-14 | 13F | Joseph P. Lucia & Associates, LLC | 0 | -100.00 | 0 | |||||
| 2025-07-24 | 13F | IFP Advisors, Inc | 132 | 9 | ||||||
| 2025-08-12 | 13F | Jpmorgan Chase & Co | 3,503,711 | 117.74 | 250,936 | 148.44 | ||||
| 2025-08-12 | 13F | Global Retirement Partners, LLC | 11,391 | -3.65 | 816 | 5.57 | ||||
| 2025-04-21 | 13F | Nelson, Van Denburg & Campbell Wealth Management Group, LLC | 0 | -100.00 | 0 | |||||
| 2025-07-03 | 13F | City Center Advisors, LLC | 7,777 | 1.79 | 557 | 16.28 | ||||
| 2025-05-05 | 13F | J.w. Cole Advisors, Inc. | 0 | -100.00 | 0 | -100.00 | ||||
| 2025-08-04 | 13F | One Day In July LLC | 7,112 | -15.33 | 509 | -3.42 | ||||
| 2025-08-13 | 13F | Custom Index Systems, Llc | 4,127 | 0.27 | 296 | 14.34 | ||||
| 2025-08-14 | 13F | BTG Pactual Asset Management US LLC | 1,150 | 82 | ||||||
| 2025-08-08 | 13F | Altfest L J & Co Inc | 169,626 | 3,328.17 | 12,149 | 3,818.71 | ||||
| 2025-08-12 | 13F | XTX Topco Ltd | 9,806 | 702 | ||||||
| 2025-07-28 | 13F | WealthPlan Investment Management, LLC | 3,176 | 227 | ||||||
| 2025-08-14 | 13F | Nan Shan Life Insurance Co., Ltd. | 99,650 | 0.00 | 7,137 | 14.08 | ||||
| 2025-08-14 | 13F | Guardian Wealth Advisors, Llc / Nc | 0 | -100.00 | 0 | |||||
| 2025-08-14 | 13F | Jain Global LLC | 14,842 | 1,063 | ||||||
| 2025-08-08 | 13F | Pnc Financial Services Group, Inc. | 2,213 | -7.29 | 158 | 6.04 | ||||
| 2025-08-13 | 13F | Jones Financial Companies Lllp | 5,256 | 29.62 | 374 | 48.61 | ||||
| 2025-05-14 | 13F | CI Private Wealth, LLC | 0 | -100.00 | 0 | -100.00 | ||||
| 2025-07-22 | 13F | SOL Capital Management CO | 283,134 | -0.33 | 20 | 17.65 | ||||
| 2025-08-14 | 13F | Royal Bank Of Canada | 753,504 | 59.98 | 53,967 | 82.54 | ||||
| 2025-08-13 | 13F | Leuthold Group, Llc | 9,210 | 2.76 | 660 | 17.26 | ||||
| 2025-07-29 | 13F | Stephens Inc /ar/ | 82,050 | -0.04 | 5,876 | 14.05 | ||||
| 2025-08-11 | 13F | Citigroup Inc | 744,956 | 600.70 | 53,354 | 699.54 | ||||
| 2025-07-17 | 13F | Sound Income Strategies, LLC | 161 | 0.62 | 12 | 10.00 | ||||
| 2025-07-28 | 13F | BRYN MAWR TRUST Co | 4,997 | -2.84 | 358 | 10.87 | ||||
| 2025-08-14 | 13F | Wells Fargo & Company/mn | 417,804 | 2.23 | 29,923 | 16.64 | ||||
| 2025-08-11 | 13F | TD Waterhouse Canada Inc. | 3,419 | 3,156.19 | 249 | 4,033.33 | ||||
| 2025-08-13 | 13F | Quantbot Technologies LP | 0 | -100.00 | 0 | |||||
| 2025-08-14 | 13F | Ulysses Management LLC | Call | 25,000 | 1,790 | |||||
| 2025-05-06 | 13F | Bank Julius Baer & Co. Ltd, Zurich | 0 | -100.00 | 0 | |||||
| 2025-07-25 | 13F | Hobbs Group Advisors, LLC | 0 | -100.00 | 0 | |||||
| 2025-08-04 | 13F | FRG Family Wealth Advisors LLC | 2,800 | 201 | ||||||
| 2025-07-02 | 13F | Central Pacific Bank - Trust Division | 52,890 | 87.06 | 3,788 | 113.47 | ||||
| 2025-08-18 | 13F/A | National Bank Of Canada /fi/ | 204 | 0.00 | 15 | 16.67 | ||||
| 2025-07-24 | 13F | Robertson Stephens Wealth Management, LLC | 11,689 | 16.61 | 837 | 33.07 | ||||
| 2025-07-18 | 13F | Trust Co Of Vermont | 302 | 0.00 | 22 | 16.67 | ||||
| 2025-08-08 | 13F | Larson Financial Group LLC | 10 | 0.00 | 1 | |||||
| 2025-08-14 | 13F | Jane Street Group, Llc | Put | 36,400 | 2,607 | |||||
| 2025-08-14 | 13F | CoreCap Advisors, LLC | 122 | 5.17 | 9 | 14.29 | ||||
| 2025-07-30 | NP | ENDW - Cambria Endowment Style ETF | 57 | 4 | ||||||
| 2025-08-14 | 13F | Jane Street Group, Llc | Call | 121,100 | 8,673 | |||||
| 2025-08-14 | 13F | Boston Private Wealth Llc | 0 | -100.00 | 0 | |||||
| 2025-05-15 | 13F | D. E. Shaw & Co., Inc. | 0 | -100.00 | 0 | |||||
| 2025-08-07 | 13F/A | Curat Global, LLC | 200 | 0.00 | 14 | 16.67 | ||||
| 2025-08-08 | 13F | Foundations Investment Advisors, LLC | 204,669 | 4.84 | 14,658 | 19.62 | ||||
| 2025-08-14 | 13F | Menora Mivtachim Holdings Ltd. | 3,085,450 | 107.36 | 220,980 | 136.59 | ||||
| 2025-08-15 | 13F | Equitable Holdings, Inc. | 8,780 | 9.82 | 629 | 25.35 | ||||
| 2025-07-25 | 13F | Cwm, Llc | 3,255 | -2.66 | 0 | |||||
| 2025-04-29 | 13F | Hm Payson & Co | 1,156 | 0.00 | 73 | -4.00 | ||||
| 2025-08-11 | 13F | Advisor Resource Council | 9,433 | -80.83 | 676 | -72.97 | ||||
| 2025-08-04 | 13F | Spire Wealth Management | 613 | -78.05 | 44 | -75.43 | ||||
| 2025-08-05 | 13F | Fourth Dimension Wealth, LLC | 100 | 0.00 | 7 | 16.67 | ||||
| 2025-08-14 | 13F | Summit Trail Advisors, Llc | 473,162 | -29.69 | 33,888 | -19.78 | ||||
| 2025-07-15 | 13F | DSG Capital Advisors, LLC | 0 | -100.00 | 0 | |||||
| 2025-08-12 | 13F | Proequities, Inc. | 0 | 0 | ||||||
| 2025-04-15 | 13F | Thompson Investment Management, Inc. | 0 | -100.00 | 0 | |||||
| 2025-08-14 | 13F | McIlrath & Eck, LLC | 300 | 21 | ||||||
| 2025-08-13 | 13F | Tranquilli Financial Advisor LLC | 6,117 | 29.46 | 438 | 47.97 | ||||
| 2025-08-13 | 13F | Helix Partners Management LP | 35,000 | 2,507 | ||||||
| 2025-07-29 | 13F | Private Trust Co Na | 413 | -39.71 | 30 | -30.95 | ||||
| 2025-08-11 | 13F | Private Advisor Group, LLC | 26,585 | -2.13 | 1,904 | 11.74 | ||||
| 2025-07-29 | 13F | Koshinski Asset Management, Inc. | 8,444 | 0.00 | 605 | 13.96 | ||||
| 2025-04-11 | 13F | Permanent Capital Management, LP | 9,756 | 612 | ||||||
| 2025-08-12 | 13F | Laurel Wealth Advisors LLC | 5,372 | 5,272.00 | 0 | -100.00 | ||||
| 2025-08-12 | 13F | Fairscale Capital, LLC | 4,042 | 1.51 | 297 | 19.28 | ||||
| 2025-08-13 | 13F | Walleye Capital LLC | 0 | -100.00 | 0 | |||||
| 2025-08-07 | 13F | Addison Advisors LLC | 1,655 | -2.99 | 119 | 10.28 | ||||
| 2025-06-30 | NP | Two Roads Shared Trust - Anfield U.S. Equity Sector Rotation ETF | 59,105 | 3,578 | ||||||
| 2025-08-18 | NP | JAMEX - Jamestown Equity Fund | 12,165 | 0.00 | 871 | 14.15 | ||||
| 2025-08-05 | 13F | Harel Insurance Investments & Financial Services Ltd. | 2,272,620 | 0.00 | 163 | 14.08 | ||||
| 2025-08-14 | 13F | Quantitative Investment Management, LLC | 15,418 | -50.95 | 1 | 0.00 | ||||
| 2025-08-12 | 13F | Edmond De Rothschild Holding S.a. | 153,800 | 1.96 | 11,015 | 16.34 | ||||
| 2025-07-16 | 13F | PFS Partners, LLC | 95 | -11.21 | 7 | 0.00 | ||||
| 2025-08-13 | 13F | Barclays Plc | 0 | -100.00 | 0 | |||||
| 2025-08-15 | 13F | Tower Research Capital LLC (TRC) | 2,233 | -96.60 | 160 | -96.14 | ||||
| 2025-08-14 | 13F | Raymond James Financial Inc | 134,838 | -4.91 | 9,657 | 8.49 | ||||
| 2025-08-07 | 13F | David R. Rahn & Associates Inc. | 0 | -100.00 | 0 | |||||
| 2025-07-18 | 13F | Truist Financial Corp | 16,681 | -2.24 | 1,195 | 11.48 | ||||
| 2025-08-07 | 13F | Resources Investment Advisors, LLC. | 4,815 | -18.83 | 345 | -7.53 | ||||
| 2025-08-14 | 13F | Bnp Paribas Arbitrage, Sa | 319,770 | -31.60 | 22,902 | -21.96 | ||||
| 2025-08-14 | 13F | Sunbelt Securities, Inc. | 1,775 | 4.35 | 116 | 8.49 | ||||
| 2025-08-04 | 13F | Assetmark, Inc | 326 | 23 | ||||||
| 2025-05-14 | 13F | Van Hulzen Asset Management, LLC | 0 | -100.00 | 0 | |||||
| 2025-08-05 | 13F | Simplex Trading, Llc | 13,094 | -45.07 | 1 | -100.00 | ||||
| 2025-07-25 | 13F | Hazlett, Burt & Watson, Inc. | 26,959 | 16.92 | 2 | 0.00 | ||||
| 2025-08-11 | 13F | One Capital Management, LLC | 0 | -100.00 | 0 | |||||
| 2025-07-08 | 13F | Juncture Wealth Strategies, Llc | 28,572 | 106.88 | 2,046 | 136.26 | ||||
| 2025-05-06 | 13F | Y-Intercept (Hong Kong) Ltd | 0 | -100.00 | 0 | |||||
| 2025-07-30 | 13F | Blume Capital Management, Inc. | 400 | 0.00 | 29 | 12.00 | ||||
| 2025-07-30 | 13F | Strategic Blueprint, LLC | 0 | -100.00 | 0 | |||||
| 2025-08-12 | 13F | BlackRock, Inc. | 493 | 35 | ||||||
| 2025-08-14 | 13F | Aqr Capital Management Llc | 3,658 | 262 | ||||||
| 2025-07-31 | 13F | GLOBALT Investments LLC / GA | 8,709 | -10.42 | 624 | 2.13 | ||||
| 2025-05-20 | 13F/A | Colony Group, LLC | 0 | -100.00 | 0 | -100.00 | ||||
| 2025-08-06 | 13F | Founders Financial Securities Llc | 30,586 | 34.84 | 2,191 | 60.20 | ||||
| 2025-07-24 | 13F | Ronald Blue Trust, Inc. | 340 | 38.78 | 24 | 60.00 | ||||
| 2025-05-12 | 13F | Nomura Asset Management Co Ltd | 0 | -100.00 | 0 | |||||
| 2025-08-01 | 13F | Logan Capital Management Inc | 17 | 0.00 | 1 | 0.00 | ||||
| 2025-08-14 | 13F | Family Management Corp | 10,817 | 0.00 | 775 | 14.16 | ||||
| 2025-08-19 | 13F | Newbridge Financial Services Group, Inc. | 100 | -25.93 | 7 | -12.50 | ||||
| 2025-08-06 | 13F | Commonwealth Equity Services, Llc | 40,215 | -0.73 | 3 | 0.00 | ||||
| 2025-08-12 | 13F | Nemes Rush Group LLC | 119 | 8 | ||||||
| 2025-07-31 | 13F | Pinnacle Wealth Management Group, Inc. | 34,978 | 5.93 | 2,505 | 20.90 | ||||
| 2025-08-14 | 13F | FIL Ltd | 196,021 | 214.72 | 14,127 | 261.40 | ||||
| 2025-08-13 | 13F | Philadelphia Trust Co | 10,000 | 0.00 | 1 | |||||
| 2025-08-12 | 13F | Jefferies Financial Group Inc. | 7,850 | -71.49 | 562 | -67.48 | ||||
| 2025-08-14 | 13F | Integrated Wealth Concepts LLC | 4,847 | -5.24 | 347 | 8.10 | ||||
| 2025-08-13 | 13F | Renaissance Technologies Llc | 54,600 | 3,910 | ||||||
| 2025-08-14 | 13F | Temasek Holdings (Private) Ltd | 0 | -100.00 | 0 | |||||
| 2025-05-27 | NP | XNAV - FundX Aggressive ETF | 34,681 | 0.00 | 2,177 | -3.97 | ||||
| 2025-07-10 | 13F | Piscataqua Savings Bank | 180 | 0.00 | 13 | 9.09 | ||||
| 2025-07-18 | 13F | Parsons Capital Management Inc/ri | 14,291 | 0.00 | 1,024 | 14.05 | ||||
| 2025-07-15 | 13F | MCF Advisors LLC | 375 | 0.54 | 27 | 13.04 | ||||
| 2025-08-14 | 13F | Murphy & Mullick Capital Management Corp | 85 | 0.00 | 6 | 20.00 | ||||
| 2025-08-14 | 13F | GWM Advisors LLC | 6,546 | 63.94 | 469 | 87.20 | ||||
| 2025-08-15 | 13F | Provenance Wealth Advisors, LLC | 0 | -100.00 | 0 | -100.00 | ||||
| 2025-07-30 | 13F | Whittier Trust Co Of Nevada Inc | 400 | -8.26 | 29 | 3.70 | ||||
| 2025-08-08 | 13F | Itau Unibanco Holding S.A. | 9,000 | -88.07 | 645 | 16,000.00 | ||||
| 2025-07-31 | 13F | Oppenheimer & Co Inc | 8,932 | 640 | ||||||
| 2025-08-05 | 13F | Bank of New York Mellon Corp | 110,795 | 21.41 | 7,935 | 38.53 | ||||
| 2025-08-14 | 13F | Group One Trading, L.p. | 4,649 | 583.68 | 333 | 690.48 | ||||
| 2025-04-21 | 13F | PSI Advisors, LLC | 0 | -100.00 | 0 | |||||
| 2025-08-14 | 13F | Citadel Advisors Llc | 253,076 | 35.45 | 18,125 | 54.56 | ||||
| 2025-08-04 | 13F | Ledyard National Bank | 269,215 | -4.03 | 19,281 | 9.50 | ||||
| 2025-08-14 | 13F | Citadel Advisors Llc | Put | 35,200 | 58.56 | 2,521 | 80.98 | |||
| 2025-07-17 | 13F | Fifth Third Securities, Inc. | 3,332 | -7.42 | 239 | 5.78 | ||||
| 2025-08-07 | 13F | Allworth Financial LP | 400 | 59.36 | 29 | 86.67 | ||||
| 2025-08-14 | 13F | Citadel Advisors Llc | Call | 81,800 | 245.15 | 5,859 | 293.95 | |||
| 2025-08-11 | 13F | Lowe Brockenbrough & Co Inc | 108,413 | -1.72 | 7,765 | 12.13 | ||||
| 2025-08-13 | 13F | Fisher Asset Management, LLC | 2,991,470 | 14.54 | 214,249 | 30.69 | ||||
| 2025-08-14 | 13F | First International Bank of Israel Ltd. | 62,000 | 4,440 | ||||||
| 2025-07-21 | 13F | Barrett & Company, Inc. | 8 | 0.00 | 1 | |||||
| 2025-07-28 | 13F | Duncker Streett & Co Inc | 14 | 0.00 | 1 | |||||
| 2025-07-29 | 13F | Dumont & Blake Investment Advisors Llc | 11,793 | -0.74 | 845 | 13.29 | ||||
| 2025-08-13 | 13F | Rsm Us Wealth Management Llc | 3,039 | 218 | ||||||
| 2025-08-14 | 13F | Headlands Technologies LLC | 0 | -100.00 | 0 | -100.00 | ||||
| 2025-08-14 | 13F | Goldman Sachs Group Inc | 2,940,662 | 31.28 | 210,610 | 49.79 | ||||
| 2025-08-14 | 13F | Transamerica Financial Advisors, Inc. | 36,323 | -22.49 | 2,601 | 129,950.00 | ||||
| 2025-08-04 | 13F | Migdal Insurance & Financial Holdings Ltd. | 5,595,000 | 64.80 | 401 | 87.79 | ||||
| 2025-08-14 | 13F | Qube Research & Technologies Ltd | 0 | -100.00 | 0 | |||||
| 2025-08-12 | 13F | Steward Partners Investment Advisory, Llc | 10,085 | -0.36 | 722 | 13.70 | ||||
| 2025-05-15 | 13F | Alliancebernstein L.p. | 0 | -100.00 | 0 | -100.00 | ||||
| 2025-08-12 | 13F | Argent Trust Co | 3,700 | 0.00 | 265 | 13.79 | ||||
| 2025-07-22 | 13F | Wealthcare Advisory Partners LLC | 77,465 | -1.22 | 5,548 | 12.72 | ||||
| 2025-05-19 | 13F | Heck Capital Advisors, LLC | 0 | 0 | ||||||
| 2025-08-14 | 13F | Hrt Financial Lp | 22,162 | 2 | ||||||
| 2025-08-13 | 13F | Northwestern Mutual Wealth Management Co | 6,927 | -0.66 | 496 | 13.50 | ||||
| 2025-08-14 | 13F | Mariner, LLC | 5,559 | 13.87 | 398 | 30.07 | ||||
| 2025-07-14 | 13F | Masso Torrence Wealth Management Inc. | 27,103 | -3.46 | 1,941 | 10.16 | ||||
| 2025-08-06 | 13F | Prospera Financial Services Inc | 0 | -100.00 | 0 | |||||
| 2025-08-13 | 13F | Russell Investments Group, Ltd. | 23 | 0.00 | 2 | 0.00 | ||||
| 2025-08-12 | 13F | MAI Capital Management | 22 | -75.28 | 2 | -80.00 | ||||
| 2025-08-14 | 13F | LM Advisors LLC | 4,000 | 0.00 | 0 | |||||
| 2025-08-14 | 13F | Fiduciary Trust Co | 926,093 | 7.37 | 66,327 | 22.51 | ||||
| 2025-08-11 | 13F | Brown Brothers Harriman & Co | 25 | -73.40 | 2 | -80.00 | ||||
| 2025-08-07 | 13F | Guardian Partners Inc. | 608,586 | 839.16 | 44,542 | 1,068.47 | ||||
| 2025-08-12 | 13F | Clal Insurance Enterprises Holdings Ltd | 4,370,000 | 23.27 | 313 | 40.54 | ||||
| 2025-08-14 | 13F/A | Skopos Labs, Inc. | 66 | 5 | ||||||
| 2025-04-15 | 13F | Integrated Advisors Network LLC | 0 | -100.00 | 0 | |||||
| 2025-08-13 | 13F | Schroder Investment Management Group | 322,906 | 22,965 | ||||||
| 2025-07-15 | 13F | Mather Group, Llc. | 0 | -100.00 | 0 | |||||
| 2025-07-22 | 13F | Gemmer Asset Management LLC | 0 | -100.00 | 0 | |||||
| 2025-05-19 | 13F/A | Jane Street Group, Llc | 0 | -100.00 | 0 | -100.00 | ||||
| 2025-07-15 | 13F | Fifth Third Bancorp | 431 | 31 | ||||||
| 2025-07-25 | 13F | Envestnet Portfolio Solutions, Inc. | 55,166 | 133.22 | 3,951 | 166.17 | ||||
| 2025-08-14 | 13F | Stifel Financial Corp | 8,295 | 0.00 | 594 | 14.23 | ||||
| 2025-07-31 | 13F | Cambridge Investment Research Advisors, Inc. | 23,713 | -7.87 | 2 | 0.00 | ||||
| 2025-08-14 | 13F | Susquehanna International Group, Llp | 5,055 | -88.06 | 362 | -86.37 | ||||
| 2025-08-13 | 13F | Shepherd Financial Partners LLC | 4,765 | 341 | ||||||
| 2025-08-14 | 13F | Susquehanna International Group, Llp | Call | 222,400 | 107.27 | 15,928 | 136.50 | |||
| 2025-08-14 | 13F | Susquehanna International Group, Llp | Put | 73,500 | -11.02 | 5,264 | 1.54 | |||
| 2025-07-29 | 13F | Mattson Financial Services, LLC | 0 | -100.00 | 0 | |||||
| 2025-08-12 | 13F | LPL Financial LLC | 411,120 | 6.84 | 29,444 | 21.91 | ||||
| 2025-08-14 | 13F | Ameriprise Financial Inc | 68,227 | -42.49 | 4,881 | -34.48 | ||||
| 2025-07-11 | 13F | Grove Bank & Trust | 140 | 10 | ||||||
| 2025-08-12 | 13F | Park Square Financial Group, LLC | 940 | -1.88 | 67 | 11.67 | ||||
| 2025-07-18 | 13F | Consolidated Portfolio Review Corp | 2,834 | 203 | ||||||
| 2025-07-14 | 13F | Farmers & Merchants Investments Inc | 819 | 0.00 | 59 | 13.73 | ||||
| 2025-07-22 | 13F | Miracle Mile Advisors, LLC | 7,879 | 20.68 | 564 | 37.90 | ||||
| 2025-07-29 | 13F | Chicago Partners Investment Group LLC | 3,446 | 258 | ||||||
| 2025-08-05 | 13F | Bank Of Montreal /can/ | 6,600 | 0.00 | 473 | 14.01 | ||||
| 2025-08-06 | 13F | First Horizon Advisors, Inc. | 89 | 32.84 | 6 | 50.00 | ||||
| 2025-08-05 | 13F | Key FInancial Inc | 141 | 642.11 | 10 | 900.00 | ||||
| 2025-08-14 | 13F | Cubist Systematic Strategies, LLC | 32,876 | -72.58 | 2,355 | -68.72 | ||||
| 2025-08-14 | 13F | Atomi Financial Group, Inc. | 4,185 | -25.65 | 300 | -15.30 | ||||
| 2025-07-18 | 13F | TruNorth Capital Management, LLC | 114 | 0.00 | 8 | 14.29 | ||||
| 2025-08-14 | 13F | Synovus Financial Corp | 53,686 | -0.20 | 3,847 | 13.92 | ||||
| 2025-08-15 | 13F | Captrust Financial Advisors | 34,781 | -0.35 | 2,491 | 13.74 | ||||
| 2025-07-29 | 13F | Activest Wealth Management | 0 | 0 | ||||||
| 2025-08-08 | 13F | ProVise Management Group, LLC | 43,033 | -4.46 | 3,082 | 9.02 | ||||
| 2025-08-14 | 13F | Boothbay Fund Management, Llc | Call | 177,700 | 33.01 | 12,727 | 51.75 | |||
| 2025-08-08 | 13F | Good Life Advisors, LLC | 42,435 | -32.06 | 3,039 | -22.47 | ||||
| 2025-09-04 | 13F/A | Advisor Group Holdings, Inc. | 39,709 | -8.69 | 2,844 | 4.21 | ||||
| 2025-08-11 | 13F | Aptus Capital Advisors, LLC | 12 | -62.50 | 1 | -100.00 | ||||
| 2025-07-10 | 13F | Rfg Holdings, Inc. | 197,378 | -1.63 | 14,136 | 12.23 | ||||
| 2025-07-09 | 13F | Finley Financial, LLC | 2,250 | 0.00 | 161 | 18.38 | ||||
| 2025-07-24 | 13F | Us Bancorp \de\ | 2,783 | 18.32 | 199 | 35.37 | ||||
| 2025-08-14 | 13F | Lazard Asset Management Llc | 0 | -100.00 | 0 | |||||
| 2025-08-14 | 13F | Two Sigma Investments, Lp | 44,600 | 3,194 | ||||||
| 2025-08-08 | 13F | Principal Financial Group Inc | 54,986 | -23.43 | 3,938 | -12.62 | ||||
| 2025-08-11 | 13F | Y.D. More Investments Ltd | 810 | 0.00 | 58 | 16.00 | ||||
| 2025-08-13 | 13F | EverSource Wealth Advisors, LLC | 0 | -100.00 | 0 | |||||
| 2025-07-30 | 13F | Cullen/frost Bankers, Inc. | 39 | 0.00 | 3 | 0.00 | ||||
| 2025-08-06 | 13F | Csenge Advisory Group | 107,014 | -0.51 | 7,021 | 15.00 | ||||
| 2025-08-12 | 13F | O'shaughnessy Asset Management, Llc | 952 | 0.11 | 68 | 15.25 | ||||
| 2025-08-06 | 13F | Golden State Wealth Management, LLC | 154 | 0.00 | 11 | 22.22 | ||||
| 2025-08-14 | 13F | Ssi Investment Management Llc | 124,746 | 95.08 | 8,934 | 122.63 | ||||
| 2025-07-01 | 13F | Harbor Investment Advisory, Llc | 0 | -100.00 | 0 | |||||
| 2025-05-14 | 13F | Huntington National Bank | 14 | -7.14 | ||||||
| 2025-08-08 | 13F | Cetera Investment Advisers | 143,009 | 5.32 | 10,242 | 20.18 | ||||
| 2025-08-11 | 13F | HighTower Advisors, LLC | 28,001 | -1.98 | 2,005 | 11.82 | ||||
| 2025-08-08 | 13F | SG Americas Securities, LLC | 0 | -100.00 | 0 | |||||
| 2025-08-14 | 13F | Fmr Llc | 3,334 | 22.44 | 240 | 41.18 | ||||
| 2025-07-03 | 13F | First Hawaiian Bank | 0 | -100.00 | 0 | -100.00 | ||||
| 2025-07-15 | 13F | Attessa Capital LLC | 0 | -100.00 | 0 | |||||
| 2025-08-11 | 13F | Anfield Capital Management, LLC | 59,495 | -1.29 | 4,261 | 12.64 | ||||
| 2025-08-14 | 13F | Horizon Investments, LLC | 457,451 | 19.85 | 32,763 | 36.75 | ||||
| 2025-08-01 | 13F | Clark Asset Management, LLC | 6,501 | 0.57 | 466 | 14.81 | ||||
| 2025-08-14 | 13F | Glenmede Investment Management, LP | 4,890 | 350 | ||||||
| 2025-07-09 | 13F | Sapient Capital Llc | 3,422 | 0.00 | 245 | 14.49 | ||||
| 2025-07-21 | 13F | Quattro Financial Advisors Llc | 42,307 | -6.32 | 3,030 | 6.92 | ||||
| 2025-07-22 | 13F | Bank Hapoalim Bm | 7,270 | 12.73 | 1 | |||||
| 2025-08-05 | 13F | Access Investment Management LLC | 60 | 0.00 | 4 | 33.33 | ||||
| 2025-08-13 | 13F | Green Harvest Asset Management LLC | 49,132 | 16.61 | 3,519 | 33.06 | ||||
| 2025-08-13 | 13F | StoneX Group Inc. | 9,982 | -8.08 | 715 | 4.85 | ||||
| 2025-07-22 | 13F | Beacon Financial Advisory LLC | 13,869 | -2.08 | 993 | 11.70 | ||||
| 2025-07-18 | 13F | Tanager Wealth Management LLP | 6,057 | 0.00 | 434 | 13.95 | ||||
| 2025-08-08 | 13F | Gts Securities Llc | 97,156 | 281.57 | 6,958 | 335.42 | ||||
| 2025-08-14 | 13F | Avanda Investment Management Pte. Ltd. | Call | 437,500 | 31,334 | |||||
| 2025-07-16 | 13F | American National Bank | 62 | 4 | ||||||
| 2025-08-06 | 13F | AE Wealth Management LLC | 459 | 214.38 | 33 | 255.56 | ||||
| 2025-08-08 | 13F | Accredited Investors Inc. | 3,545 | 0.03 | 254 | 13.96 | ||||
| 2025-08-14 | 13F | Bank Of America Corp /de/ | 12,830,652 | -1.52 | 918,931 | 12.36 | ||||
| 2025-07-25 | 13F | Atria Wealth Solutions, Inc. | 0 | -100.00 | 0 | |||||
| 2025-08-14 | 13F/A | Rockefeller Capital Management L.P. | 20,831 | 27.03 | 1,492 | 44.90 | ||||
| 2025-08-01 | 13F | Envestnet Asset Management Inc | 240,411 | 64.08 | 17,218 | 87.21 | ||||
| 2025-07-25 | 13F | Astoria Portfolio Advisors LLC. | 5,351 | 399 | ||||||
| 2025-08-14 | 13F | Banco BTG Pactual S.A. | 120,000 | -9.50 | 8,594 | 3.26 | ||||
| 2025-07-14 | 13F | U.S. Capital Wealth Advisors, LLC | 16,540 | 0.01 | 1,185 | 14.07 | ||||
| 2025-05-15 | 13F | Marshall Wace, Llp | 0 | -100.00 | 0 | -100.00 |