Mga Batayang Estadistika
| Pemilik Institusional | 348 total, 345 long only, 0 short only, 3 long/short - change of 11.54% MRQ |
| Alokasi Portofolio Rata-rata | 0.0585 % - change of -1.81% MRQ |
| Saham Institusional (Jangka Panjang) | 194,684,001 (ex 13D/G) - change of 30.90MM shares 18.86% MRQ |
| Nilai Institusional (Jangka Panjang) | $ 955,826 USD ($1000) |
Kepemilikan Institusional dan Pemegang Saham
Mizuho Financial Group, Inc. - Depositary Receipt (Common Stock) (US:MFG) memiliki 348 pemilik institusional dan pemegang saham yang telah mengajukan formulir 13D/G atau 13F kepada Komisi Bursa Efek (Securities Exchange Commission/SEC). Lembaga-lembaga ini memegang total 194,684,001 saham. Pemegang saham terbesar meliputi Morgan Stanley, Fmr Llc, Lazard Asset Management Llc, Goldman Sachs Group Inc, Bank Of America Corp /de/, BlackRock, Inc., Northern Trust Corp, CIBC Private Wealth Group, LLC, Natixis Advisors, L.p., and Millennium Management Llc .
Struktur kepemilikan institusional Mizuho Financial Group, Inc. - Depositary Receipt (Common Stock) (NYSE:MFG) menunjukkan posisi terkini di perusahaan oleh institusi dan dana, serta perubahan terbaru dalam ukuran posisi. Pemegang saham utama dapat mencakup investor individu, reksa dana, dana lindung nilai, atau institusi. Jadwal 13D menunjukkan bahwa investor memegang (atau pernah memegang) lebih dari 5% saham perusahaan dan bermaksud (atau pernah bermaksud) untuk secara aktif mengejar perubahan strategi bisnis. Jadwal 13G menunjukkan investasi pasif lebih dari 5%.
The share price as of September 5, 2025 is 6.51 / share. Previously, on September 6, 2024, the share price was 4.06 / share. This represents an increase of 60.34% over that period.

Skor Sentimen Dana
Skor Sentimen Dana (sebelumnya dikenal sebagai Skor Akumulasi Kepemilikan) menemukan saham-saham yang paling banyak dibeli oleh dana. Ini adalah hasil dari model kuantitatif multi-faktor yang canggih yang mengidentifikasi perusahaan dengan tingkat akumulasi institusional tertinggi. Model penilaian menggunakan kombinasi dari total peningkatan pemilik yang diungkapkan, perubahan dalam alokasi portofolio pada pemilik tersebut, dan metrik lainnya. Angka berkisar dari 0 hingga 100, dengan angka yang lebih tinggi menunjukkan tingkat akumulasi yang lebih tinggi dibandingkan dengan perusahaan sejenisnya, dan 50 adalah rata-ratanya.
Frekuensi Pembaruan: Setiap Hari
Lihat Ownership Explorer, yang menyediakan daftar perusahaan dengan peringkat tertinggi.
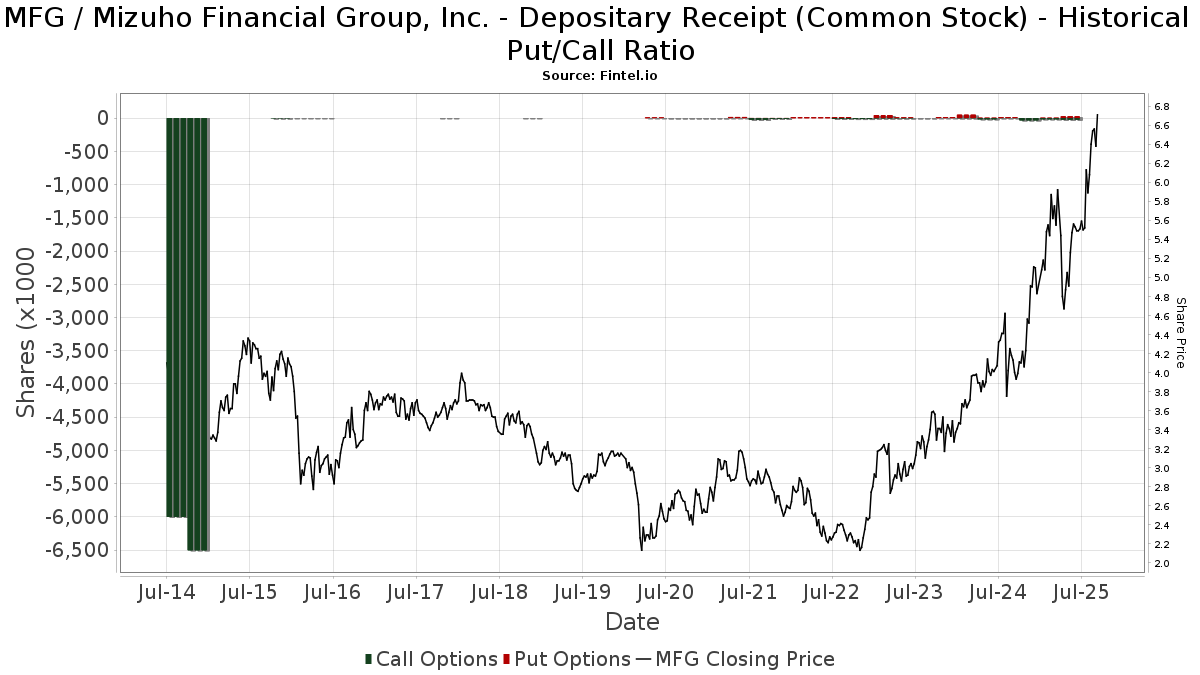
Rasio Put/Call Institusional
Selain melaporkan isu ekuitas dan utang standar, institusi dengan aset di bawah manajemen lebih dari 100 juta dolar AS juga harus mengungkapkan kepemilikan opsi put dan call mereka. Karena opsi put umumnya menunjukkan sentimen negatif, dan opsi call menunjukkan sentimen positif, kita dapat mengetahui sentimen institusional secara keseluruhan dengan memplot rasio put terhadap call. Grafik di sebelah kanan memplot rasio put/call historis untuk instrumen ini.
Menggunakan Rasio Put/Call sebagai indikator sentimen investor mengatasi salah satu kekurangan utama dari penggunaan total kepemilikan institusional, yaitu sejumlah besar aset yang dikelola diinvestasikan secara pasif untuk melacak indeks. Dana yang dikelola secara pasif biasanya tidak membeli opsi, sehingga indikator rasio put/call lebih akurat dalam melacak sentimen dana yang dikelola secara aktif.
Pengajuan 13F dan NPORT
Detail pada pengajuan 13F tersedia gratis. Detail pada pengajuan NP memerlukan keanggotaan premium. Baris berwarna hijau menunjukkan posisi baru. Baris berwarna merah menunjukkan posisi yang sudah ditutup. Klik tautan ini ikon untuk melihat riwayat transaksi selengkapnya.
Tingkatkan
untuk membuka data premium dan mengekspor ke Excel ![]() .
.
| Tanggal File | Sumber | Investor | Ketik | Presyo ng Avg (Silangan) |
Saham | Δ Saham (%) |
Dilaporkan Nilai ($1000) |
Nilai Δ (%) |
Alokasi Port (%) |
|
|---|---|---|---|---|---|---|---|---|---|---|
| 2025-07-17 | 13F | Western Financial Corp/CA | 13,788 | 77 | ||||||
| 2025-07-22 | 13F | Marks Group Wealth Management, Inc | 21,681 | -17.68 | 121 | -17.24 | ||||
| 2025-08-04 | 13F | Center for Financial Planning, Inc. | 0 | -100.00 | 0 | |||||
| 2025-08-07 | 13F | Sierra Ocean, Llc | 10,634 | 0.00 | 59 | 1.72 | ||||
| 2025-07-24 | 13F | PDS Planning, Inc | 73,798 | 4.86 | 410 | 5.94 | ||||
| 2025-08-14 | 13F | Kovitz Investment Group Partners, LLC | 18,172 | 4.42 | 101 | 6.32 | ||||
| 2025-08-14 | 13F | Snowden Capital Advisors LLC | 29,032 | -15.85 | 161 | -15.26 | ||||
| 2025-08-14 | 13F | Voloridge Investment Management, Llc | 735,703 | 4,091 | ||||||
| 2025-08-13 | 13F | Jones Financial Companies Lllp | 7,446 | 106.15 | 41 | 105.00 | ||||
| 2025-07-15 | 13F | Ballentine Partners, LLC | 143,695 | 8.46 | 799 | 9.47 | ||||
| 2025-07-16 | 13F | Five Oceans Advisors | 49,492 | -4.05 | 275 | -3.17 | ||||
| 2025-08-08 | 13F | Larson Financial Group LLC | 1,258 | 243.72 | 7 | 200.00 | ||||
| 2025-08-06 | 13F | Savant Capital, LLC | 55,064 | 62.83 | 306 | 64.52 | ||||
| 2025-08-27 | 13F/A | Brinker Capital Investments, LLC | 464,073 | -16.29 | 2,580 | -15.52 | ||||
| 2025-08-05 | 13F | Bank Of Montreal /can/ | 261,262 | -4.92 | 1,453 | -4.10 | ||||
| 2025-08-14 | 13F | Ameriprise Financial Inc | 138,728 | -2.59 | 771 | -1.66 | ||||
| 2025-08-13 | 13F | Guggenheim Capital Llc | 39,441 | -3.33 | 219 | -2.23 | ||||
| 2025-08-14 | 13F | Jane Street Group, Llc | 68,834 | 383 | ||||||
| 2025-08-14 | 13F | Group One Trading, L.p. | 0 | -100.00 | 0 | -100.00 | ||||
| 2025-08-13 | 13F | Lido Advisors, LLC | 30,622 | 12.01 | 170 | 13.33 | ||||
| 2025-08-05 | 13F | Huntington National Bank | 30,896 | -7.03 | 172 | -6.56 | ||||
| 2025-07-10 | 13F | Wealth Enhancement Advisory Services, Llc | 75,565 | -10.41 | 425 | -8.41 | ||||
| 2025-07-17 | 13F | BayBridge Capital Group, LLC | 48,068 | 5.94 | 267 | 6.80 | ||||
| 2025-08-13 | 13F | Marshall Wace, Llp | 545,845 | 3,035 | ||||||
| 2025-07-31 | 13F | BIP Alliance, LLC | 10,309 | -0.25 | 57 | 1.79 | ||||
| 2025-07-25 | 13F | Allspring Global Investments Holdings, LLC | 105,610 | 3.83 | 590 | 7.29 | ||||
| 2025-07-30 | 13F | Whittier Trust Co | 1,240 | 7 | ||||||
| 2025-08-14 | 13F | Lazard Asset Management Llc | 18,777,631 | -16.05 | 104 | -15.45 | ||||
| 2025-08-12 | 13F | MAI Capital Management | 11,331 | 385.89 | 63 | 425.00 | ||||
| 2025-05-09 | 13F | R Squared Ltd | 0 | -100.00 | 0 | |||||
| 2025-05-01 | 13F | Schechter Investment Advisors, LLC | 188,056 | -6.45 | 1,036 | 5.50 | ||||
| 2025-07-16 | 13F/A | CX Institutional | 320 | 0.00 | 0 | |||||
| 2025-07-25 | 13F | We Are One Seven, LLC | 20,427 | 4.38 | 114 | 5.61 | ||||
| 2025-08-14 | 13F | Tudor Investment Corp Et Al | 333,564 | -9.91 | 1,855 | -9.12 | ||||
| 2025-08-12 | 13F | AlphaCore Capital LLC | 44,058 | 245 | ||||||
| 2025-08-12 | 13F | Coldstream Capital Management Inc | 52,454 | 6.53 | 292 | 7.38 | ||||
| 2025-08-14 | 13F | Stifel Financial Corp | 287,445 | 60.23 | 1,598 | 61.74 | ||||
| 2025-07-28 | 13F | Harbour Investments, Inc. | 1,484 | 0.00 | 8 | 0.00 | ||||
| 2025-08-13 | 13F | M&t Bank Corp | 350,051 | -6.07 | 1,946 | -5.21 | ||||
| 2025-08-07 | 13F | Guardian Capital Lp | 56,403 | 0.00 | 314 | 0.97 | ||||
| 2025-08-22 | NP | MLMIX - Global Core Portfolio Class I | 105,495 | 101.79 | 587 | 103.47 | ||||
| 2025-08-11 | 13F | Rothschild Investment Llc | 6,171 | 2.97 | 34 | 3.03 | ||||
| 2025-07-23 | 13F | Canopy Partners, LLC | 11,870 | 0.00 | 66 | 0.00 | ||||
| 2025-08-13 | 13F | Invesco Ltd. | 25,971 | -5.13 | 144 | -4.00 | ||||
| 2025-07-25 | 13F | Cwm, Llc | 23,391 | -2.40 | 0 | |||||
| 2025-08-13 | 13F | Sanibel Captiva Trust Company, Inc. | 10,604 | 0.00 | 59 | 0.00 | ||||
| 2025-08-12 | 13F | Aviso Financial Inc. | 112,685 | -9.80 | 627 | -9.01 | ||||
| 2025-08-07 | 13F | Addison Advisors LLC | 50,279 | 2.46 | 280 | 3.33 | ||||
| 2025-08-12 | 13F | CIBC Private Wealth Group, LLC | 7,420,346 | 421,990.22 | 41,257 | 589,285.71 | ||||
| 2025-07-24 | 13F | Us Bancorp \de\ | 763,985 | -1.84 | 4,248 | -0.96 | ||||
| 2025-08-14 | 13F | Colony Group, LLC | 84,168 | 61.97 | 468 | 63.29 | ||||
| 2025-08-11 | 13F | Dorsey & Whitney Trust CO LLC | 82,409 | 3.71 | 458 | 4.81 | ||||
| 2025-07-22 | 13F | Valeo Financial Advisors, LLC | 44,386 | 2.81 | 247 | 3.80 | ||||
| 2025-04-23 | 13F | Mascagni Wealth Management, Inc. | 0 | -100.00 | 0 | |||||
| 2025-05-13 | 13F | Qtron Investments LLC | 0 | -100.00 | 0 | |||||
| 2025-07-28 | 13F | Private Wealth Asset Management, LLC | 316 | 0.00 | 2 | 0.00 | ||||
| 2025-05-15 | 13F | Engineers Gate Manager LP | 0 | -100.00 | 0 | |||||
| 2025-07-28 | 13F | Axxcess Wealth Management, Llc | 21,407 | -20.68 | 119 | -19.59 | ||||
| 2025-05-15 | 13F | Two Sigma Securities, Llc | 0 | -100.00 | 0 | -100.00 | ||||
| 2025-08-13 | 13F | West Family Investments, Inc. | 76,793 | 42.54 | 427 | 43.92 | ||||
| 2025-08-14 | 13F | Mercer Global Advisors Inc /adv | 213,534 | 18.53 | 1,187 | 19.66 | ||||
| 2025-07-18 | 13F | Ewa, Llc | 36,752 | -0.02 | 204 | 0.99 | ||||
| 2025-08-14 | 13F | Goldman Sachs Group Inc | 14,446,178 | -0.43 | 80,321 | 0.47 | ||||
| 2025-04-18 | NP | AVIV - Avantis International Large Cap Value ETF This fund is a listed as child fund of American Century Companies Inc and if that institution has disclosed ownership in this security, then these positions will not be double counted when calculating total shares and total value | 276,032 | 0.00 | 1,557 | 10.98 | ||||
| 2025-08-14 | 13F | EP Wealth Advisors, Inc. | 12,261 | 68 | ||||||
| 2025-08-14 | 13F | Riggs Asset Managment Co. Inc. | 1,238 | 7 | ||||||
| 2025-07-18 | 13F | Truist Financial Corp | 16,286 | 0.52 | 91 | 1.12 | ||||
| 2025-08-07 | 13F | Legacy Financial Advisors, Inc. | 0 | -100.00 | 0 | |||||
| 2025-08-12 | 13F | Clear Street Markets Llc | 45,371 | 252 | ||||||
| 2025-07-09 | 13F | Sapient Capital Llc | 0 | -100.00 | 0 | |||||
| 2025-08-05 | 13F | GPS Wealth Strategies Group, LLC | 50 | 108.33 | 0 | |||||
| 2025-08-13 | 13F | EverSource Wealth Advisors, LLC | 30,518 | 141.67 | 170 | 144.93 | ||||
| 2025-07-08 | 13F | Rise Advisors, LLC | 1 | 0.00 | 0 | |||||
| 2025-08-13 | 13F | Quadrature Capital Ltd | 106,623 | 592 | ||||||
| 2025-08-14 | 13F | Principia Wealth Advisory, LLC | 240 | 1 | ||||||
| 2025-07-31 | 13F | Buckingham Strategic Partners | 34,054 | 12.67 | 189 | 13.86 | ||||
| 2025-08-14 | 13F | Millennium Management Llc | 3,360,929 | 387.67 | 18,687 | 392.13 | ||||
| 2025-08-14 | 13F | Schonfeld Strategic Advisors LLC | 28,812 | 160 | ||||||
| 2025-08-14 | 13F | Glenmede Investment Management, LP | 65,793 | 366 | ||||||
| 2025-07-15 | 13F | Financial Management Professionals, Inc. | 1,891 | 11 | ||||||
| 2025-08-13 | 13F | Hsbc Holdings Plc | 19,745 | -6.89 | 110 | -6.03 | ||||
| 2025-07-30 | 13F | Forum Financial Management, LP | 353,511 | -2.91 | 1,966 | -2.04 | ||||
| 2025-07-21 | 13F | Empirical Financial Services, LLC d.b.a. Empirical Wealth Management | 28,853 | 59.69 | 160 | 61.62 | ||||
| 2025-08-14 | 13F | CIBC World Markets Inc. | 165,436 | 27.05 | 920 | 28.17 | ||||
| 2025-07-15 | 13F | Fifth Third Bancorp | 5,674 | 35.06 | 32 | 34.78 | ||||
| 2025-08-14 | 13F | Principal Street Partners, LLC | 51,616 | 106.56 | 287 | 108.76 | ||||
| 2025-08-12 | 13F | New Republic Capital, LLC | 13,959 | -15.39 | 78 | -14.44 | ||||
| 2025-05-05 | 13F | Lindbrook Capital, Llc | 25,180 | 14.45 | 139 | 28.97 | ||||
| 2025-08-07 | 13F | Acadian Asset Management Llc | 7,208 | -47.24 | 0 | |||||
| 2025-07-16 | 13F | Traveka Wealth, LLC | 13,832 | 3.06 | 77 | 4.11 | ||||
| 2025-08-21 | NP | LAZARD RETIREMENT SERIES INC - Lazard Retirement Global Dynamic Multi-Asset Portfolio Investor Shares | 58,588 | -15.01 | 326 | -14.25 | ||||
| 2025-07-28 | NP | AVSD - Avantis Responsible International Equity ETF | 77,566 | 0.00 | 431 | -1.37 | ||||
| 2025-08-14 | 13F | Wetherby Asset Management Inc | 213,671 | 3.07 | 1,188 | 17.28 | ||||
| 2025-08-13 | 13F | Cheviot Value Management, LLC | 418 | 0.00 | 3 | 0.00 | ||||
| 2025-07-10 | 13F | Trust Point Inc. | 22,215 | 0.96 | 124 | 1.65 | ||||
| 2025-04-29 | 13F | Chilton Capital Management Llc | 0 | -100.00 | 0 | |||||
| 2025-08-07 | 13F | Vise Technologies, Inc. | 237,678 | 57.41 | 1,321 | 79.00 | ||||
| 2025-08-13 | 13F | Renaissance Technologies Llc | 2,291,703 | 14.49 | 12,742 | 15.52 | ||||
| 2025-08-07 | 13F | Parkside Financial Bank & Trust | 2,786 | -19.36 | 15 | -21.05 | ||||
| 2025-08-14 | 13F | Wells Fargo & Company/mn | 2,365,338 | -18.09 | 13,151 | -17.35 | ||||
| 2025-07-11 | 13F | Farther Finance Advisors, LLC | 25,091 | 20.01 | 140 | 23.01 | ||||
| 2025-08-12 | 13F | American Century Companies Inc | 2,859,999 | 0.51 | 15,902 | 1.43 | ||||
| 2025-05-15 | 13F | Glenmede Trust Co Na | 73,457 | -6.80 | 405 | 4.94 | ||||
| 2025-08-14 | 13F | Caisse De Depot Et Placement Du Quebec | 1,660,800 | 9,234 | ||||||
| 2025-07-29 | 13F | Werba Rubin Papier Wealth Management | 34,150 | -4.49 | 190 | -4.06 | ||||
| 2025-08-04 | 13F | Atria Investments Llc | 67,721 | -15.11 | 377 | -14.35 | ||||
| 2025-08-12 | 13F | Dimensional Fund Advisors Lp | 568,631 | -0.99 | 3,162 | -0.09 | ||||
| 2025-07-17 | 13F | CogentBlue Wealth Advisors, LLC | 16,146 | 6.08 | 90 | 7.23 | ||||
| 2025-08-04 | 13F | Syverson Strege & Co | 48,761 | 271 | ||||||
| 2025-08-14 | 13F | Bank Of America Corp /de/ | 12,386,087 | -16.96 | 68,867 | -16.21 | ||||
| 2025-07-16 | 13F | Kathmere Capital Management, LLC | 20,125 | -4.78 | 112 | -4.31 | ||||
| 2025-07-31 | 13F | Prudent Man Advisors, LLC | 20,870 | 2.29 | 116 | 3.57 | ||||
| 2025-07-24 | 13F | IFP Advisors, Inc | 2,324 | -20.98 | 13 | -25.00 | ||||
| 2025-08-04 | 13F | Haven Private, LLC | 14,214 | 79 | ||||||
| 2025-04-17 | 13F | Janney Montgomery Scott LLC | 0 | -100.00 | 0 | |||||
| 2025-08-13 | 13F | Capital Analysts, Inc. | 2,952 | -14.41 | 0 | |||||
| 2025-08-05 | 13F | NewSquare Capital LLC | 4,319 | 433.21 | 24 | 500.00 | ||||
| 2025-05-12 | 13F | Benjamin Edwards Inc | 0 | -100.00 | 0 | |||||
| 2025-07-16 | 13F | Signaturefd, Llc | 246,141 | -1.93 | 1,369 | -1.01 | ||||
| 2025-08-11 | 13F | Principal Securities, Inc. | 9,755 | 26.52 | 54 | 45.95 | ||||
| 2025-07-22 | 13F | Visionary Horizons, LLC | 12,785 | 0.00 | 71 | 1.43 | ||||
| 2025-08-14 | 13F | Icon Wealth Advisors, LLC | 19,423 | 0.00 | 108 | 0.00 | ||||
| 2025-08-12 | 13F | Soundwatch Capital LLC | 1,147 | 617 | ||||||
| 2025-08-04 | 13F | Keybank National Association/oh | 25,726 | 5.11 | 143 | 6.72 | ||||
| 2025-07-22 | 13F | Gsa Capital Partners Llp | 12,139 | 0 | ||||||
| 2025-07-22 | 13F | Merit Financial Group, LLC | 35,768 | -7.04 | 199 | -6.60 | ||||
| 2025-08-14 | 13F | Old Mission Capital Llc | 0 | -100.00 | 0 | |||||
| 2025-07-17 | 13F | ERn Financial, LLC | 11,265 | -29.17 | 63 | -28.74 | ||||
| 2025-08-04 | 13F | Hantz Financial Services, Inc. | 11,719 | 1,859.70 | 0 | |||||
| 2025-08-12 | 13F | Putnam Fl Investment Management Co | 26,294 | 26.50 | 146 | 28.07 | ||||
| 2025-08-11 | 13F | Pinnacle Wealth Planning Services, Inc. | 50,328 | 33.25 | 280 | 34.13 | ||||
| 2025-07-31 | 13F | Sage Mountain Advisors LLC | 28,874 | -1.04 | 161 | 0.00 | ||||
| 2025-05-09 | 13F | Abc Arbitrage Sa | 0 | -100.00 | 0 | |||||
| 2025-07-30 | 13F | Ethic Inc. | 327,253 | 0.70 | 1,820 | 2.94 | ||||
| 2025-08-19 | 13F | Cape Investment Advisory, Inc. | 1,292 | 38.03 | 7 | 40.00 | ||||
| 2025-08-14 | 13F | Integrated Wealth Concepts LLC | 15,292 | -75.86 | 85 | -75.57 | ||||
| 2025-08-14 | 13F | Sei Investments Co | 96,731 | -1.24 | 538 | -0.37 | ||||
| 2025-07-09 | 13F | Bruce G. Allen Investments, LLC | 6,755 | -26.92 | 38 | -26.00 | ||||
| 2025-08-01 | 13F | Envestnet Asset Management Inc | 1,561,074 | -2.60 | 8,680 | -1.72 | ||||
| 2025-08-14 | 13F | Vident Advisory, LLC | 334,461 | 123.64 | 1,860 | 125.61 | ||||
| 2025-07-31 | 13F | Brighton Jones Llc | 17,629 | 60.79 | 98 | 63.33 | ||||
| 2025-08-12 | 13F | Charles Schwab Investment Management Inc | 1,260,054 | 12.37 | 7,006 | 13.39 | ||||
| 2025-08-14 | 13F | Verition Fund Management LLC | 63,609 | -25.74 | 354 | -25.05 | ||||
| 2025-08-13 | 13F | Quadrant Capital Group Llc | 428,572 | -1.93 | 2,383 | -1.04 | ||||
| 2025-08-13 | 13F | Shelton Capital Management | 38,900 | 216 | ||||||
| 2025-07-28 | NP | AVDE - Avantis International Equity ETF This fund is a listed as child fund of American Century Companies Inc and if that institution has disclosed ownership in this security, then these positions will not be double counted when calculating total shares and total value | 2,514,701 | 11.34 | 13,982 | 9.77 | ||||
| 2025-07-30 | 13F | Bogart Wealth, LLC | 38 | 0.00 | 0 | |||||
| 2025-07-17 | 13F | Sage Rhino Capital Llc | 44,832 | -0.33 | 249 | 0.81 | ||||
| 2025-08-14 | 13F | Seven Mile Advisory | 16,116 | -13.24 | 90 | -12.75 | ||||
| 2025-08-12 | 13F | Manchester Capital Management LLC | 3,744 | 12.06 | 21 | 11.11 | ||||
| 2025-08-15 | 13F | Morgan Stanley | 41,485,209 | 67.96 | 230,658 | 69.49 | ||||
| 2025-07-30 | 13F | Legacy Wealth Asset Management, LLC | 237,588 | 72.19 | 1,321 | 73.68 | ||||
| 2025-07-16 | 13F | West Branch Capital LLC | 0 | -100.00 | 0 | |||||
| 2025-07-08 | 13F | Parallel Advisors, LLC | 59,328 | 2.67 | 330 | 3.46 | ||||
| 2025-08-06 | 13F | Commonwealth Equity Services, Llc | 12,225 | 0 | ||||||
| 2025-07-17 | 13F | Greenleaf Trust | 58,370 | -4.25 | 325 | -3.28 | ||||
| 2025-08-14 | 13F | Mml Investors Services, Llc | 180,556 | 25.38 | 1 | |||||
| 2025-08-08 | 13F | Crossmark Global Holdings, Inc. | 735,218 | -0.01 | 4,088 | 0.89 | ||||
| 2025-07-09 | 13F | Aaron Wealth Advisors LLC | 106,291 | -0.47 | 591 | 0.34 | ||||
| 2025-07-14 | 13F | UMA Financial Services, Inc. | 635 | 29.59 | 4 | 50.00 | ||||
| 2025-08-14 | 13F | Ieq Capital, Llc | 117,329 | 0.53 | 652 | 1.40 | ||||
| 2025-08-26 | NP | GLBIX - Leuthold Global Fund Institutional Class | 21,538 | 0.00 | 120 | 0.85 | ||||
| 2025-08-12 | 13F | Steward Partners Investment Advisory, Llc | 1,275 | 0.00 | 7 | 0.00 | ||||
| 2025-08-13 | 13F | Townsquare Capital Llc | 0 | -100.00 | 0 | |||||
| 2025-08-18 | 13F | Geneos Wealth Management Inc. | 1,658 | -2.18 | 9 | 0.00 | ||||
| 2025-08-14 | 13F | Warren Averett Asset Management, LLC | 13,081 | -16.75 | 73 | -16.28 | ||||
| 2025-07-28 | NP | AVDEX - Avantis International Equity Fund Institutional Class This fund is a listed as child fund of American Century Companies Inc and if that institution has disclosed ownership in this security, then these positions will not be double counted when calculating total shares and total value | 151,792 | 2.45 | 844 | 0.96 | ||||
| 2025-08-12 | 13F | XTX Topco Ltd | 177,225 | 985 | ||||||
| 2025-08-15 | 13F | Kestra Advisory Services, LLC | 12,276 | 7.89 | 68 | 9.68 | ||||
| 2025-07-17 | 13F | Halbert Hargrove Global Advisors, Llc | 0 | -100.00 | 0 | |||||
| 2025-08-18 | 13F | Wolverine Trading, Llc | 10,508 | 58 | ||||||
| 2025-05-13 | 13F | Hartland & Co., LLC | 0 | -100.00 | 0 | |||||
| 2025-08-14 | 13F | Aqr Capital Management Llc | 735,650 | 87.19 | 4,090 | 88.91 | ||||
| 2025-08-14 | 13F | GWM Advisors LLC | 62 | 0 | ||||||
| 2025-08-15 | 13F | Tower Research Capital LLC (TRC) | 1,480 | 168.12 | 8 | 166.67 | ||||
| 2025-08-05 | 13F | Bank of New York Mellon Corp | 783,025 | -8.00 | 4,354 | -7.17 | ||||
| 2025-04-29 | 13F | Callan Capital, LLC | 214,117 | 13.10 | 1,180 | 27.46 | ||||
| 2025-07-08 | 13F | Nbc Securities, Inc. | 650 | -55.57 | 0 | |||||
| 2025-08-12 | 13F | Aigen Investment Management, Lp | 13,805 | 77 | ||||||
| 2025-08-13 | 13F | Rsm Us Wealth Management Llc | 101,673 | 0.59 | 565 | 1.62 | ||||
| 2025-08-25 | 13F/A | Neuberger Berman Group LLC | 121,233 | -3.87 | 674 | -2.88 | ||||
| 2025-08-13 | 13F | Natixis Advisors, L.p. | 3,514,388 | 4.50 | 20 | 5.56 | ||||
| 2025-08-06 | 13F | Vestmark Advisory Solutions, Inc. | 26,081 | 145 | ||||||
| 2025-07-14 | 13F | GAMMA Investing LLC | 66,791 | -1.14 | 371 | -0.27 | ||||
| 2025-08-01 | 13F | Bessemer Group Inc | 5,700 | 0.00 | 0 | |||||
| 2025-08-12 | 13F | Wood Tarver Financial Group, LLC | 137 | 0.00 | 0 | |||||
| 2025-08-13 | 13F | Te Ahumairangi Investment Management Ltd | 50,000 | 0 | ||||||
| 2025-08-13 | 13F | First Trust Advisors Lp | 417,167 | -4.58 | 2,319 | -3.70 | ||||
| 2025-08-13 | 13F | GeoWealth Management, LLC | 12,704 | 15.59 | 71 | 16.67 | ||||
| 2025-08-14 | 13F | Smartleaf Asset Management LLC | 99,306 | 1.51 | 552 | -0.54 | ||||
| 2025-08-14 | 13F | Boston Private Wealth Llc | 14,561 | -46.09 | 81 | -45.95 | ||||
| 2025-07-08 | 13F | Gallacher Capital Management LLC | 79,994 | 1.21 | 445 | 2.07 | ||||
| 2025-08-13 | 13F | Flow Traders U.s. Llc | 42,435 | 0 | ||||||
| 2025-08-07 | 13F | HighPoint Advisor Group LLC | 21,798 | 1.49 | 121 | 11.01 | ||||
| 2025-08-01 | 13F | SYM FINANCIAL Corp | 42,927 | -2.08 | 239 | -1.24 | ||||
| 2025-08-11 | 13F | Baldwin Investment Management, LLC | 28,800 | 0.00 | 160 | 1.27 | ||||
| 2025-08-13 | 13F/A | StoneX Group Inc. | 0 | -100.00 | 0 | -100.00 | ||||
| 2025-08-27 | NP | GSIB - Themes Global Systemically Important Banks ETF | 82,692 | 113.55 | 460 | 115.49 | ||||
| 2025-07-14 | 13F | Foster Group, Inc. | 0 | -100.00 | 0 | |||||
| 2025-07-25 | 13F | Apollon Wealth Management, LLC | 45,243 | 0.00 | 252 | 0.80 | ||||
| 2025-08-14 | 13F | Aspen Grove Capital, LLC | 10,957 | 2.71 | 61 | 3.45 | ||||
| 2025-08-13 | 13F | Northern Trust Corp | 10,147,189 | 1.94 | 56,418 | 2.87 | ||||
| 2025-03-26 | NP | DFA INVESTMENT DIMENSIONS GROUP INC - International Sustainability Core 1 Portfolio Shares | 0 | -100.00 | 0 | -100.00 | ||||
| 2025-08-12 | 13F | Gladstone Institutional Advisory LLC | 35,302 | 196 | ||||||
| 2025-07-30 | 13F | Eqis Capital Management, Inc. | 106,539 | 4.23 | 592 | 5.15 | ||||
| 2025-08-14 | 13F | CIBC Asset Management Inc | 34,121 | 190 | ||||||
| 2025-08-14 | 13F | ICONIQ Capital, LLC | 86,550 | -12.98 | 481 | -12.23 | ||||
| 2025-08-14 | 13F | Aprio Wealth Management, LLC | 33,431 | -15.37 | 186 | -14.75 | ||||
| 2025-08-12 | 13F | Global Retirement Partners, LLC | 58,919 | 1,854.84 | 328 | 2,235.71 | ||||
| 2025-08-05 | 13F | Ellevest, Inc. | 22,006 | 51.99 | 122 | 54.43 | ||||
| 2025-07-31 | 13F | AlTi Global, Inc. | 15,911 | 88 | ||||||
| 2025-08-12 | 13F | Proequities, Inc. | Put | 0 | 0 | |||||
| 2025-08-12 | 13F | Proequities, Inc. | Call | 0 | 0 | |||||
| 2025-08-12 | 13F | Proequities, Inc. | 0 | 0 | ||||||
| 2025-07-23 | 13F | High Note Wealth, LLC | 48 | 0.00 | 0 | |||||
| 2025-08-05 | 13F | GHP Investment Advisors, Inc. | 0 | -100.00 | 0 | |||||
| 2025-08-07 | 13F | Allworth Financial LP | 7,693 | 16.37 | 43 | 31.25 | ||||
| 2025-07-16 | 13F | Highline Wealth Partners Llc | 1,421 | 0.85 | 8 | 0.00 | ||||
| 2025-05-12 | 13F | XY Capital Ltd | 0 | -100.00 | 0 | |||||
| 2025-07-09 | 13F | Sivia Capital Partners, LLC | 72,925 | 22.12 | 405 | 23.10 | ||||
| 2025-05-05 | 13F | Eagle Bay Advisors LLC | 0 | -100.00 | 0 | |||||
| 2025-07-28 | 13F | BRYN MAWR TRUST Co | 6,054 | -0.69 | 34 | 0.00 | ||||
| 2025-07-30 | 13F | Bleakley Financial Group, LLC | 36,584 | 0.38 | 203 | 1.50 | ||||
| 2025-07-29 | 13F | Regions Financial Corp | 338,759 | -33.12 | 1,884 | -32.51 | ||||
| 2025-07-11 | 13F | International Private Wealth Advisors LLC | 0 | -100.00 | 0 | |||||
| 2025-08-13 | 13F | Quantbot Technologies LP | 33,264 | 333.46 | 185 | 338.10 | ||||
| 2025-08-26 | NP | EHLS - Even Herd Long Short ETF | 31,616 | -53.74 | 176 | -53.46 | ||||
| 2025-08-04 | 13F | Spire Wealth Management | 355 | -93.49 | 2 | -96.67 | ||||
| 2025-08-07 | 13F | Brio Consultants, LLC | 12,716 | 5.98 | 71 | 6.06 | ||||
| 2025-08-14 | 13F | Beaird Harris Wealth Management, LLC | 242 | 1 | ||||||
| 2025-07-28 | 13F | Ritholtz Wealth Management | 113,496 | -4.49 | 631 | -3.52 | ||||
| 2025-07-31 | 13F | Glass Jacobson Investment Advisors llc | 1,000 | 0.00 | 6 | 25.00 | ||||
| 2025-08-14 | 13F | Atomi Financial Group, Inc. | 150,692 | 1.01 | 838 | 1.95 | ||||
| 2025-08-14 | 13F | Citadel Advisors Llc | Call | 0 | -100.00 | 0 | ||||
| 2025-07-09 | 13F | Riversedge Advisors, Llc | 16,962 | -7.04 | 94 | -6.00 | ||||
| 2025-08-12 | 13F | Jpmorgan Chase & Co | 677,445 | 33.35 | 3,767 | 34.55 | ||||
| 2025-07-21 | 13F | Ascent Group, LLC | 21,735 | -21.01 | 121 | -20.53 | ||||
| 2025-07-21 | 13F | Qrg Capital Management, Inc. | 407,459 | 60.89 | 2,265 | 62.37 | ||||
| 2025-08-14 | 13F | Summit Trail Advisors, Llc | 23,090 | -1.12 | 128 | 0.00 | ||||
| 2025-08-08 | 13F | Cetera Investment Advisers | 103,152 | 1.09 | 574 | 1.96 | ||||
| 2025-05-16 | 13F | Redwood Investments, LLC | 21,593 | 119 | ||||||
| 2025-08-11 | 13F | HighTower Advisors, LLC | 333,232 | -1.65 | 1,853 | -0.75 | ||||
| 2025-08-14 | 13F | Bnp Paribas Arbitrage, Sa | 220,254 | 178.65 | 1,225 | 181.38 | ||||
| 2025-08-12 | 13F | Rhumbline Advisers | 286,237 | -0.73 | 1,591 | 0.19 | ||||
| 2025-08-14 | 13F | Hrt Financial Lp | 164,517 | 186.42 | 1 | |||||
| 2025-08-05 | 13F | Bridgewater Advisors Inc. | 38,598 | -1.82 | 228 | 13.50 | ||||
| 2025-08-22 | NP | MLNIX - Global Concentrated Portfolio Class I | 1,825,584 | 149.50 | 10,150 | 151.80 | ||||
| 2025-08-12 | 13F | BlackRock, Inc. | 10,750,738 | -1.74 | 59,774 | -0.84 | ||||
| 2025-07-25 | 13F | Stephens Consulting, LLC | 313 | 2 | ||||||
| 2025-07-15 | 13F | Td Private Client Wealth Llc | 11,338 | 63 | ||||||
| 2025-08-11 | 13F | HHM Wealth Advisors, LLC | 2,350 | 0.00 | 13 | 8.33 | ||||
| 2025-07-25 | 13F | Yousif Capital Management, Llc | 152,033 | 2.20 | 845 | 3.17 | ||||
| 2025-04-21 | 13F | Catalina Capital Group, LLC | 0 | -100.00 | 0 | |||||
| 2025-07-29 | 13F | Private Trust Co Na | 2,855 | 225.91 | 16 | 275.00 | ||||
| 2025-08-11 | 13F | United Capital Financial Advisers, Llc | 143,672 | -4.05 | 799 | -3.27 | ||||
| 2025-07-29 | NP | BLUIX - BLUEPRINT GROWTH FUND Institutional Class | 77,437 | 431 | ||||||
| 2025-08-08 | 13F | Avantax Advisory Services, Inc. | 128,609 | 0.43 | 715 | 1.42 | ||||
| 2025-08-08 | 13F | Allianz Se | 590,000 | 0.00 | 3,280 | 0.92 | ||||
| 2025-07-28 | 13F | Naviter Wealth, LLC | 300,138 | 4.34 | 1,669 | 2.14 | ||||
| 2025-08-14 | 13F | UBS Group AG | 121,389 | 234.03 | 675 | 237.00 | ||||
| 2025-08-13 | 13F | Northwestern Mutual Wealth Management Co | 25,842 | 6,142.03 | 144 | 7,050.00 | ||||
| 2025-08-14 | 13F | Point72 Asset Management, L.P. | 719,400 | 1,840.13 | 4,000 | 1,860.29 | ||||
| 2025-08-12 | 13F | Seeds Investor Llc | 12,237 | 18.58 | 68 | 21.43 | ||||
| 2025-08-14 | 13F | D. E. Shaw & Co., Inc. | 20,454 | 114 | ||||||
| 2025-08-11 | 13F | Traub Capital Management LLC | 537 | 3 | ||||||
| 2025-07-16 | 13F | Magnus Financial Group LLC | 11,020 | -40.56 | 61 | -40.20 | ||||
| 2025-08-11 | 13F | Private Advisor Group, LLC | 48,954 | -3.83 | 272 | -2.86 | ||||
| 2025-08-27 | 13F/A | Squarepoint Ops LLC | 79,231 | 416.74 | 441 | 423.81 | ||||
| 2025-08-14 | 13F | Evergreen Capital Management Llc | 106,595 | 2.10 | 593 | 2.96 | ||||
| 2025-05-14 | 13F | Van Hulzen Asset Management, LLC | 0 | -100.00 | 0 | -100.00 | ||||
| 2025-08-11 | 13F | Annis Gardner Whiting Capital Advisors, LLC | 1,795 | 10 | ||||||
| 2025-08-13 | 13F | Cresset Asset Management, LLC | 11,362 | 63 | ||||||
| 2025-07-23 | 13F | Prime Capital Investment Advisors, LLC | 45,116 | -1.74 | 251 | -0.79 | ||||
| 2025-09-04 | 13F/A | Advisor Group Holdings, Inc. | 22,871 | 252.57 | 127 | 260.00 | ||||
| 2025-07-11 | 13F | Vanguard Capital Wealth Advisors This fund is a listed as child fund of Vanguard Group Inc and if that institution has disclosed ownership in this security, then these positions will not be double counted when calculating total shares and total value | 17,706 | -87.86 | 98 | -87.80 | ||||
| 2025-07-29 | 13F | Salomon & Ludwin, LLC | 150 | 1 | ||||||
| 2025-05-08 | 13F | Waldron Private Wealth LLC | 0 | -100.00 | 0 | |||||
| 2025-04-14 | 13F | Park Avenue Securities Llc | 0 | -100.00 | 0 | |||||
| 2025-07-25 | 13F | Sequoia Financial Advisors, LLC | 120,817 | 10.32 | 672 | 11.28 | ||||
| 2025-05-02 | 13F | Sachetta, LLC | 0 | -100.00 | 0 | |||||
| 2025-07-10 | 13F | Exchange Traded Concepts, Llc | 1,054 | 6 | ||||||
| 2025-07-24 | 13F | Ronald Blue Trust, Inc. | 62,536 | 144.88 | 348 | 147.86 | ||||
| 2025-07-25 | 13F | Envestnet Portfolio Solutions, Inc. | 18,205 | 36.44 | 101 | 38.36 | ||||
| 2025-08-07 | 13F | Prospect Financial Group LLC | 14,766 | -3.85 | 82 | -2.38 | ||||
| 2025-08-04 | 13F | Assetmark, Inc | 82,042 | 58.25 | 456 | 60.00 | ||||
| 2025-08-07 | 13F | Connor, Clark & Lunn Investment Management Ltd. | 360,596 | 2,005 | ||||||
| 2025-04-22 | 13F | Mendota Financial Group, LLC | 0 | -100.00 | 0 | |||||
| 2025-08-06 | 13F | First Horizon Advisors, Inc. | 805 | 115.24 | 4 | 100.00 | ||||
| 2025-07-14 | 13F | Abound Wealth Management | 108 | 0.00 | 1 | |||||
| 2025-08-14 | 13F | Fmr Llc | 19,974,350 | 7.14 | 111,057 | 8.12 | ||||
| 2025-06-26 | NP | SNTKX - Steward International Enhanced Index Fund Class A | 315,100 | 0.00 | 1,591 | -7.82 | ||||
| 2025-08-07 | 13F | Zions Bancorporation, National Association /ut/ | 378,841 | -16.96 | 2,106 | -16.20 | ||||
| 2025-08-19 | 13F/A | Pitcairn Co | 66,773 | -14.83 | 371 | -13.92 | ||||
| 2025-08-01 | 13F | First Command Advisory Services, Inc. | 248 | -49.49 | 1 | -50.00 | ||||
| 2025-08-14 | 13F | Two Sigma Investments, Lp | 35,369 | 0.00 | 197 | 1.03 | ||||
| 2025-08-04 | 13F | Simon Quick Advisors, Llc | 12,176 | -18.13 | 68 | -17.28 | ||||
| 2025-08-11 | 13F | Brown Brothers Harriman & Co | 667 | 4 | ||||||
| 2025-08-14 | 13F | Cubist Systematic Strategies, LLC | 662,928 | 3,686 | ||||||
| 2025-07-25 | 13F | Verdence Capital Advisors LLC | 225,031 | -10.73 | 1,251 | -9.87 | ||||
| 2025-08-14 | 13F/A | Skopos Labs, Inc. | 23,556 | 328.37 | 130 | 333.33 | ||||
| 2025-07-17 | 13F | HB Wealth Management, LLC | 41,444 | 22.08 | 230 | 22.99 | ||||
| 2025-08-14 | 13F | Hancock Whitney Corp | 32,793 | 4.20 | 182 | 5.20 | ||||
| 2025-08-06 | 13F | Mark Sheptoff Financial Planning, Llc | 0 | -100.00 | 0 | |||||
| 2025-07-14 | 13F | AdvisorNet Financial, Inc | 293 | 2 | ||||||
| 2025-07-17 | 13F | Barry Investment Advisors, LLC | 17,774 | 0.52 | 99 | 1.03 | ||||
| 2025-08-28 | NP | NDOW - Anydrus Advantage ETF | 0 | -100.00 | 0 | -100.00 | ||||
| 2025-08-14 | 13F | Quantinno Capital Management LP | 10,898 | -70.63 | 61 | -70.59 | ||||
| 2025-08-14 | 13F | Xponance, Inc. | 29,090 | 1.66 | 162 | 2.55 | ||||
| 2025-07-23 | 13F | Abel Hall, LLC | 22,111 | -29.22 | 123 | -29.07 | ||||
| 2025-07-16 | 13F | Brown, Lisle/cummings, Inc. | 370 | 0.00 | 2 | 0.00 | ||||
| 2025-08-08 | 13F | Pnc Financial Services Group, Inc. | 207,018 | 16.94 | 1,151 | 18.05 | ||||
| 2025-07-16 | 13F | Augustine Asset Management Inc | 831,326 | 0.11 | 4,622 | 1.03 | ||||
| 2025-08-14 | 13F | Syon Capital Llc | 53,819 | -2.07 | 299 | -0.99 | ||||
| 2025-08-12 | 13F | Atlas Capital Advisors Llc | 14,237 | -45.09 | 79 | -44.37 | ||||
| 2025-07-11 | 13F/A | Umb Bank N A/mo | 4,603 | 0.00 | 26 | 0.00 | ||||
| 2025-07-31 | 13F | Ingalls & Snyder Llc | 20,000 | 0.00 | 0 | |||||
| 2025-08-14 | 13F | Citadel Advisors Llc | 590,089 | 179,805.18 | 3,281 | 327,900.00 | ||||
| 2025-08-14 | 13F | Group One Trading, L.p. | Put | 16,100 | 159.68 | 90 | 161.76 | |||
| 2025-08-14 | 13F | Citadel Advisors Llc | Put | 10,600 | 10,500.00 | 59 | ||||
| 2025-08-14 | 13F | Group One Trading, L.p. | Call | 11,300 | 465.00 | 63 | 463.64 | |||
| 2025-08-11 | 13F | GW&K Investment Management, LLC | 1,779 | -11.54 | 0 | |||||
| 2025-08-13 | 13F | Leuthold Group, Llc | 82,038 | 0.00 | 456 | 0.88 | ||||
| 2025-05-12 | 13F | Virtu Financial LLC | 0 | -100.00 | 0 | |||||
| 2025-07-23 | 13F | Eagle Rock Investment Company, Llc | 0 | -100.00 | 0 | |||||
| 2025-08-14 | 13F | Susquehanna International Group, Llp | 73,837 | -50.66 | 411 | -50.24 | ||||
| 2025-08-07 | 13F | Altman Advisors, Inc. | 449,892 | 1.94 | 2,528 | 13.46 | ||||
| 2025-08-13 | 13F | WCG Wealth Advisors LLC | 110,110 | 612 | ||||||
| 2025-08-15 | 13F | CI Private Wealth, LLC | 146,968 | -0.98 | 817 | 0.00 | ||||
| 2025-07-30 | 13F | Jackson Thornton Asset Management, Llc | 10,723 | 59 | ||||||
| 2025-07-28 | 13F | Sagespring Wealth Partners, Llc | 26,684 | 32.55 | 148 | 34.55 | ||||
| 2025-07-09 | 13F | PFW Advisors LLC | 10,414 | -0.03 | 58 | 0.00 | ||||
| 2025-07-22 | 13F | Checchi Capital Advisers, LLC | 57,919 | -6.57 | 322 | -5.57 | ||||
| 2025-05-08 | 13F | Moors & Cabot, Inc. | 0 | -100.00 | 0 | |||||
| 2025-07-10 | 13F | Wedmont Private Capital | 25,309 | -2.78 | 139 | 14.88 | ||||
| 2025-07-24 | 13F | Jfs Wealth Advisors, Llc | 4,044 | -6.71 | 22 | -4.35 | ||||
| 2025-07-30 | 13F | Blume Capital Management, Inc. | 48 | -91.37 | 0 | -100.00 | ||||
| 2025-08-12 | 13F | LPL Financial LLC | 201,659 | 27.01 | 1,121 | 28.26 | ||||
| 2025-08-07 | 13F | Resources Investment Advisors, LLC. | 69,791 | -18.76 | 388 | -17.97 | ||||
| 2025-05-15 | 13F | CAPROCK Group, Inc. | 112,737 | 6.10 | 621 | 19.65 | ||||
| 2025-08-07 | 13F | Private Advisory Group LLC | 11,466 | 0.00 | 64 | 0.00 | ||||
| 2025-08-12 | 13F | SRS Capital Advisors, Inc. | 4,042 | 22 | ||||||
| 2025-07-30 | NP | APIE - ActivePassive International Equity ETF | 556,863 | 2.81 | 3,096 | 1.38 | ||||
| 2025-07-21 | 13F | Cromwell Holdings LLC | 30,429 | 0.00 | 169 | 1.20 | ||||
| 2025-07-22 | 13F | Clarius Group, LLC | 25,109 | 0.00 | 140 | 0.72 | ||||
| 2025-08-13 | 13F | Twin Peaks Wealth Advisors, LLC | 2,538 | 16 | ||||||
| 2025-04-11 | 13F | First Affirmative Financial Network | 45,136 | 4.64 | 249 | 18.10 | ||||
| 2025-07-09 | 13F | Sunpointe, LLC | 11,932 | 0.00 | 66 | 1.54 | ||||
| 2025-08-12 | 13F | O'shaughnessy Asset Management, Llc | 653,634 | 3.33 | 3,634 | 4.28 | ||||
| 2025-07-24 | 13F | Callan Family Office, LLC | 371,418 | 153.11 | 2,065 | 155.57 | ||||
| 2025-08-14 | 13F | Ariadne Wealth Management, LP | 46,146 | 3.72 | 295 | 30.53 | ||||
| 2025-07-30 | NP | ENDW - Cambria Endowment Style ETF | 164 | 1 | ||||||
| 2025-08-08 | NP | QGBLX - Quantified Global Fund Investor Class | 42,181 | 235 | ||||||
| 2025-08-14 | 13F | Raymond James Financial Inc | 983,309 | -5.18 | 5,467 | -4.32 | ||||
| 2025-08-06 | 13F | Walkner Condon Financial Advisors LLC | 21,362 | 3.13 | 119 | 3.51 | ||||
| 2025-08-13 | 13F | Brown Advisory Inc | 11,870 | 66 | ||||||
| 2025-08-14 | 13F | Hilltop Holdings Inc. | 18,484 | -0.67 | 103 | 0.00 | ||||
| 2025-07-11 | 13F | Pinnacle Bancorp, Inc. | 604 | 0.00 | 3 | 0.00 | ||||
| 2025-08-13 | 13F | Russell Investments Group, Ltd. | 198,587 | 52.47 | 1,104 | 53.97 | ||||
| 2025-04-23 | 13F | Continuum Advisory, LLC | 0 | -100.00 | 0 | |||||
| 2025-08-05 | 13F | Simplex Trading, Llc | Put | 500 | 400.00 | 0 | ||||
| 2025-08-05 | 13F | Simplex Trading, Llc | Call | 10,000 | 112.77 | 0 | ||||
| 2025-08-08 | 13F | Creative Planning | 1,104,332 | -8.33 | 6,140 | -7.50 | ||||
| 2025-08-14 | 13F | Headlands Technologies LLC | 1,914 | 11 | ||||||
| 2025-08-11 | 13F | Citigroup Inc | 317,499 | 18.81 | 1,765 | 19.90 | ||||
| 2025-08-13 | 13F | Centiva Capital, LP | 0 | -100.00 | 0 | |||||
| 2025-08-14 | 13F | Toroso Investments, LLC | 31,616 | -53.74 | 176 | -53.46 | ||||
| 2025-08-11 | 13F | Bell Investment Advisors, Inc | 950 | 0.00 | 5 | 0.00 | ||||
| 2025-08-13 | 13F | Fisher Asset Management, LLC | 266,074 | 7.57 | 1,479 | 8.59 | ||||
| 2025-08-13 | 13F | Cerity Partners LLC | 1,071,789 | -0.17 | 5,959 | 0.74 | ||||
| 2025-08-25 | NP | SISLX - Shelton International Select Equity Fund Investor Class | 38,900 | 216 | ||||||
| 2025-07-09 | 13F | Baron Wealth Management LLC | 0 | -100.00 | 0 | |||||
| 2025-08-14 | 13F | State Street Corp | 21,260 | 0.81 | 118 | 1.72 | ||||
| 2025-08-13 | 13F | Kayne Anderson Rudnick Investment Management Llc | 165 | 0.00 | 1 | |||||
| 2025-07-03 | 13F | Fiduciary Financial Group, Llc | 14,261 | -5.08 | 80 | 17.65 | ||||
| 2025-07-29 | 13F | Wealthstream Advisors, Inc. | 26,582 | -1.39 | 148 | -0.68 | ||||
| 2025-08-15 | 13F | Keel Point, LLC | 32,596 | 11.94 | 181 | 13.13 | ||||
| 2025-04-21 | 13F | Nelson, Van Denburg & Campbell Wealth Management Group, LLC | 0 | -100.00 | 0 | |||||
| 2025-08-14 | 13F | Mariner, LLC | 900,680 | -1.25 | 5,008 | -0.40 | ||||
| 2025-05-15 | 13F | Angeles Investment Advisors, LLC | 0 | -100.00 | 0 | -100.00 | ||||
| 2025-08-11 | 13F | Cornerstone Planning Group LLC | 1,520 | -22.21 | 9 | 0.00 | ||||
| 2025-08-11 | 13F | Integrated Quantitative Investments LLC | 155,087 | 862 | ||||||
| 2025-08-14 | 13F | Axa S.a. | 10,000 | 0.00 | 56 | 0.00 | ||||
| 2025-04-17 | 13F | Vista Wealth Management Group, LLC | 17,820 | -3.30 | 98 | 8.89 | ||||
| 2025-07-25 | 13F | JustInvest LLC | 727,006 | 6.30 | 4,042 | 7.27 | ||||
| 2025-08-12 | 13F | Franklin Resources Inc | 852,462 | -4.04 | 4,740 | -3.17 | ||||
| 2025-08-12 | 13F | Pathstone Holdings, LLC | 928,977 | -6.44 | 5,165 | -5.59 | ||||
| 2025-08-14 | 13F | Peapack Gladstone Financial Corp | 24,438 | -17.58 | 0 | |||||
| 2025-08-15 | 13F | WealthCollab, LLC | 0 | -100.00 | 0 | |||||
| 2025-04-25 | 13F | Albion Financial Group /ut | 0 | -100.00 | 0 | |||||
| 2025-07-16 | 13F | ORG Partners LLC | 500 | 3 | ||||||
| 2025-08-14 | 13F | Barometer Capital Management Inc. | 37,072 | -62.99 | 206 | -62.61 | ||||
| 2025-08-14 | 13F | Balyasny Asset Management Llc | 377,783 | 2,886.19 | 2,100 | 2,943.48 | ||||
| 2025-05-15 | 13F/A | Orion Portfolio Solutions, LLC | 554,414 | -11.23 | 3,055 | 0.00 | ||||
| 2025-08-14 | 13F | Royal Bank Of Canada | 694,144 | -18.10 | 3,860 | -17.33 | ||||
| 2025-08-14 | 13F | Wiley Bros.-aintree Capital, Llc | 53,199 | -6.32 | 296 | -8.07 | ||||
| 2025-07-31 | 13F | Nilsine Partners, LLC | 38,029 | -18.22 | 211 | -17.58 | ||||
| 2025-08-15 | 13F | Captrust Financial Advisors | 185,587 | 2.95 | 1,032 | 3.83 | ||||
| 2025-07-11 | 13F | Harbour Capital Advisors, LLC | 79,140 | -2.04 | 442 | 10.50 |
Other Listings
| DE:MZ8A | € 5.45 |