Mga Batayang Estadistika
| Pemilik Institusional | 134 total, 132 long only, 1 short only, 1 long/short - change of -5.63% MRQ |
| Alokasi Portofolio Rata-rata | 0.1609 % - change of -17.07% MRQ |
| Saham Institusional (Jangka Panjang) | 24,498,876 (ex 13D/G) - change of -3.84MM shares -13.54% MRQ |
| Nilai Institusional (Jangka Panjang) | $ 223,780 USD ($1000) |
Kepemilikan Institusional dan Pemegang Saham
PennantPark Floating Rate Capital Ltd. (US:PFLT) memiliki 134 pemilik institusional dan pemegang saham yang telah mengajukan formulir 13D/G atau 13F kepada Komisi Bursa Efek (Securities Exchange Commission/SEC). Lembaga-lembaga ini memegang total 24,498,876 saham. Pemegang saham terbesar meliputi Sound Income Strategies, LLC, Van Eck Associates Corp, BIZD - VanEck Vectors BDC Income ETF, Altshuler Shaham Ltd, Marshall Wace, Llp, UBS Group AG, Invesco Ltd., KBWD - Invesco KBW High Dividend Yield Financial ETF, Two Sigma Investments, Lp, and Qube Research & Technologies Ltd .
Struktur kepemilikan institusional PennantPark Floating Rate Capital Ltd. (NYSE:PFLT) menunjukkan posisi terkini di perusahaan oleh institusi dan dana, serta perubahan terbaru dalam ukuran posisi. Pemegang saham utama dapat mencakup investor individu, reksa dana, dana lindung nilai, atau institusi. Jadwal 13D menunjukkan bahwa investor memegang (atau pernah memegang) lebih dari 5% saham perusahaan dan bermaksud (atau pernah bermaksud) untuk secara aktif mengejar perubahan strategi bisnis. Jadwal 13G menunjukkan investasi pasif lebih dari 5%.
The share price as of September 5, 2025 is 10.26 / share. Previously, on September 6, 2024, the share price was 11.44 / share. This represents a decline of 10.31% over that period.

Skor Sentimen Dana
Skor Sentimen Dana (sebelumnya dikenal sebagai Skor Akumulasi Kepemilikan) menemukan saham-saham yang paling banyak dibeli oleh dana. Ini adalah hasil dari model kuantitatif multi-faktor yang canggih yang mengidentifikasi perusahaan dengan tingkat akumulasi institusional tertinggi. Model penilaian menggunakan kombinasi dari total peningkatan pemilik yang diungkapkan, perubahan dalam alokasi portofolio pada pemilik tersebut, dan metrik lainnya. Angka berkisar dari 0 hingga 100, dengan angka yang lebih tinggi menunjukkan tingkat akumulasi yang lebih tinggi dibandingkan dengan perusahaan sejenisnya, dan 50 adalah rata-ratanya.
Frekuensi Pembaruan: Setiap Hari
Lihat Ownership Explorer, yang menyediakan daftar perusahaan dengan peringkat tertinggi.
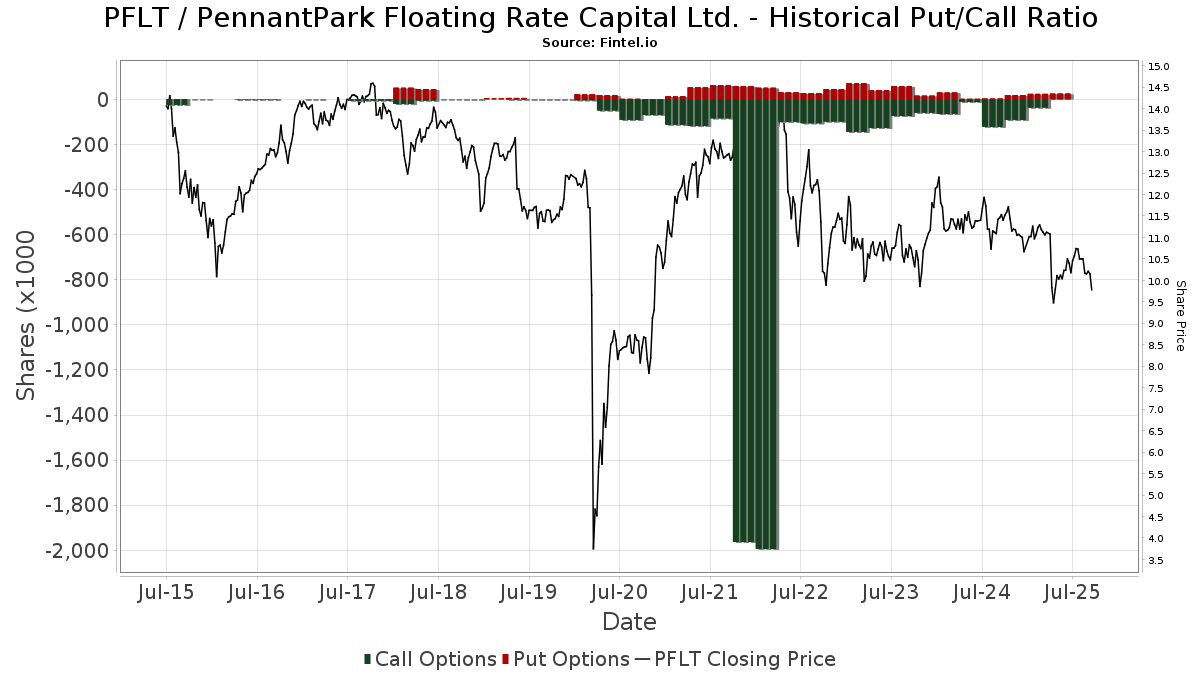
Rasio Put/Call Institusional
Selain melaporkan isu ekuitas dan utang standar, institusi dengan aset di bawah manajemen lebih dari 100 juta dolar AS juga harus mengungkapkan kepemilikan opsi put dan call mereka. Karena opsi put umumnya menunjukkan sentimen negatif, dan opsi call menunjukkan sentimen positif, kita dapat mengetahui sentimen institusional secara keseluruhan dengan memplot rasio put terhadap call. Grafik di sebelah kanan memplot rasio put/call historis untuk instrumen ini.
Menggunakan Rasio Put/Call sebagai indikator sentimen investor mengatasi salah satu kekurangan utama dari penggunaan total kepemilikan institusional, yaitu sejumlah besar aset yang dikelola diinvestasikan secara pasif untuk melacak indeks. Dana yang dikelola secara pasif biasanya tidak membeli opsi, sehingga indikator rasio put/call lebih akurat dalam melacak sentimen dana yang dikelola secara aktif.
Pengajuan 13F dan NPORT
Detail pada pengajuan 13F tersedia gratis. Detail pada pengajuan NP memerlukan keanggotaan premium. Baris berwarna hijau menunjukkan posisi baru. Baris berwarna merah menunjukkan posisi yang sudah ditutup. Klik tautan ini ikon untuk melihat riwayat transaksi selengkapnya.
Tingkatkan
untuk membuka data premium dan mengekspor ke Excel ![]() .
.
| Tanggal File | Sumber | Investor | Ketik | Presyo ng Avg (Silangan) |
Saham | Δ Saham (%) |
Dilaporkan Nilai ($1000) |
Nilai Δ (%) |
Alokasi Port (%) |
|
|---|---|---|---|---|---|---|---|---|---|---|
| 2025-08-12 | 13F | Change Path, LLC | 12,006 | 124 | ||||||
| 2025-08-04 | 13F | Muzinich & Co., Inc. | 104,859 | 103.00 | 1,083 | 87.37 | ||||
| 2025-07-29 | 13F | Private Trust Co Na | 2,530 | 0.00 | 26 | -7.14 | ||||
| 2025-07-30 | 13F | FNY Investment Advisers, LLC | 1,200 | 0.00 | 0 | |||||
| 2025-05-15 | 13F | Gwn Securities Inc. | 0 | -100.00 | 0 | -100.00 | ||||
| 2025-08-14 | 13F | Two Sigma Securities, Llc | 0 | -100.00 | 0 | |||||
| 2025-05-14 | 13F | Group One Trading, L.p. | Call | 0 | -100.00 | 0 | -100.00 | |||
| 2025-08-14 | 13F | Van Eck Associates Corp | 2,358,575 | 20.52 | 24 | 14.29 | ||||
| 2025-07-23 | 13F | Fulton Breakefield Broenniman Llc | 11,798 | 0.00 | 122 | -8.33 | ||||
| 2025-08-12 | 13F | Cornerstone Wealth Management, LLC | 64,809 | -12.10 | 669 | -18.91 | ||||
| 2025-08-12 | 13F | LPL Financial LLC | 244,157 | -44.38 | 2,522 | -48.66 | ||||
| 2025-04-22 | 13F | Synergy Financial Management, LLC | 0 | -100.00 | 0 | -100.00 | ||||
| 2025-08-06 | 13F | Commonwealth Equity Services, Llc | 91,475 | 12.50 | 1 | |||||
| 2025-08-11 | 13F | Principal Securities, Inc. | 0 | -100.00 | 0 | |||||
| 2025-05-14 | 13F | Virtus ETF Advisers LLC | 0 | -100.00 | 0 | -100.00 | ||||
| 2025-08-12 | 13F | Trexquant Investment LP | 269,430 | -35.34 | 2,783 | -40.30 | ||||
| 2025-08-07 | 13F | PFG Advisors | 110,108 | 1.81 | 1,137 | -6.03 | ||||
| 2025-07-28 | 13F | BRYN MAWR TRUST Co | 3,363 | 0.00 | 35 | -8.11 | ||||
| 2025-08-05 | 13F | Strategic Financial Concepts, LLC | 63,200 | -1.50 | 648 | -9.76 | ||||
| 2025-08-14 | 13F | D. E. Shaw & Co., Inc. | 0 | -100.00 | 0 | |||||
| 2025-08-13 | 13F | Garner Asset Management Corp | 14,267 | -2.41 | 147 | -9.82 | ||||
| 2025-08-11 | 13F | Pin Oak Investment Advisors Inc | 0 | 0 | ||||||
| 2025-08-08 | 13F | Larson Financial Group LLC | 511 | 41.94 | 5 | 25.00 | ||||
| 2025-08-12 | 13F | Global Retirement Partners, LLC | 3,928 | -79.34 | 41 | -80.68 | ||||
| 2025-08-13 | 13F | Continuum Advisory, LLC | 0 | -100.00 | 0 | |||||
| 2025-04-24 | 13F | Allspring Global Investments Holdings, LLC | 0 | -100.00 | 0 | -100.00 | ||||
| 2025-07-08 | 13F | Parallel Advisors, LLC | 0 | -100.00 | 0 | |||||
| 2025-08-04 | 13F | Creekmur Asset Management LLC | 9 | 12.50 | 0 | |||||
| 2025-08-07 | 13F | Allworth Financial LP | 2,777 | 1,603.68 | 29 | 2,700.00 | ||||
| 2025-08-14 | 13F | Schonfeld Strategic Advisors LLC | 18,126 | 187 | ||||||
| 2025-08-11 | 13F | Empowered Funds, LLC | 10,193 | -8.33 | 105 | -15.32 | ||||
| 2025-07-28 | NP | FXED - Sound Enhanced Fixed Income ETF | 104,495 | 1.12 | 1,076 | -8.11 | ||||
| 2025-04-10 | 13F | Firethorn Wealth Partners, Llc | 0 | -100.00 | 0 | -100.00 | ||||
| 2025-04-23 | 13F | Walkner Condon Financial Advisors LLC | 0 | -100.00 | 0 | -100.00 | ||||
| 2025-05-29 | NP | MCTOX - Modern Capital Tactical Opportunities Fund Class A Shares | 70,000 | 783 | ||||||
| 2025-07-17 | 13F | Vermillion Wealth Management, Inc. | 500 | 0.00 | 5 | 0.00 | ||||
| 2025-09-04 | 13F/A | Advisor Group Holdings, Inc. | 162,389 | 38.36 | 1,678 | 27.72 | ||||
| 2025-08-13 | 13F | Lido Advisors, LLC | 16,381 | 171 | ||||||
| 2025-08-07 | 13F | Resources Investment Advisors, LLC. | 12,543 | 0.00 | 130 | -7.86 | ||||
| 2025-08-14 | 13F | Aquatic Capital Management LLC | 0 | -100.00 | 0 | |||||
| 2025-08-13 | 13F | Virtus Investment Advisers, Inc. | 88,549 | -10.61 | 915 | -17.51 | ||||
| 2025-08-12 | 13F | BlackRock, Inc. | 500,758 | 30.73 | 5,173 | 20.67 | ||||
| 2025-08-21 | NP | BIZD - VanEck Vectors BDC Income ETF | 2,247,824 | 16.02 | 23,220 | 7.11 | ||||
| 2025-08-06 | 13F | Golden State Wealth Management, LLC | 9,756 | 101 | ||||||
| 2025-08-11 | 13F | Citigroup Inc | 34,398 | 218.56 | 355 | 195.83 | ||||
| 2025-07-10 | 13F | Sovran Advisors, LLC | 34,184 | 2.01 | 361 | 10.77 | ||||
| 2025-08-11 | 13F | Delta Asset Management Llc/tn | 943 | 0.00 | 10 | -10.00 | ||||
| 2025-08-14 | 13F | Mariner, LLC | 13,296 | 137 | ||||||
| 2025-08-13 | 13F | Marshall Wace, Llp | 1,439,742 | -16.75 | 14,873 | -23.15 | ||||
| 2025-08-14 | 13F | Mpwm Advisory Solutions, Llc | 5,000 | 0.00 | 52 | -7.27 | ||||
| 2025-08-14 | 13F | Sunbelt Securities, Inc. | 8,224 | -26.73 | 90 | -28.80 | ||||
| 2025-08-08 | 13F | Investment Partners, Ltd. | 10,000 | 0.00 | 103 | -7.21 | ||||
| 2025-08-14 | 13F | Royal Bank Of Canada | 19,604 | -32.18 | 202 | -37.46 | ||||
| 2025-07-18 | 13F | SOA Wealth Advisors, LLC. | 0 | -100.00 | 0 | |||||
| 2025-08-06 | 13F | AE Wealth Management LLC | 21,641 | 18.74 | 224 | 9.85 | ||||
| 2025-08-14 | 13F | Brevan Howard Capital Management LP | 141,985 | 118.14 | 1,467 | 101.37 | ||||
| 2025-05-08 | 13F | We Are One Seven, LLC | 0 | -100.00 | 0 | -100.00 | ||||
| 2025-08-13 | 13F | Guggenheim Capital Llc | 51,986 | 6.32 | 537 | -1.83 | ||||
| 2025-08-14 | 13F | Financial Network Wealth Advisors LLC | 1,426 | 0.00 | 15 | -6.67 | ||||
| 2025-08-14 | 13F | AllSquare Wealth Management LLC | 9,200 | 0.00 | 95 | -6.86 | ||||
| 2025-08-13 | 13F | Northern Trust Corp | 41,596 | 181.36 | 430 | 160.00 | ||||
| 2025-08-14 | 13F | Glenview Trust Co | 10,650 | 110 | ||||||
| 2025-05-12 | 13F | Simplex Trading, Llc | Call | 0 | -100.00 | 0 | ||||
| 2025-04-29 | 13F | Raleigh Capital Management Inc. | 0 | -100.00 | 0 | -100.00 | ||||
| 2025-08-13 | 13F | M&t Bank Corp | 21,899 | 0.00 | 226 | -7.76 | ||||
| 2025-05-12 | 13F | National Bank Of Canada /fi/ | 0 | -100.00 | 0 | |||||
| 2025-07-18 | 13F | PFG Investments, LLC | 118,908 | 5.61 | 1,228 | -2.46 | ||||
| 2025-05-29 | NP | JAFEX - Total Stock Market Index Trust NAV | 19 | -97.50 | 0 | -100.00 | ||||
| 2025-08-13 | 13F | Quadrature Capital Ltd | 0 | -100.00 | 0 | |||||
| 2025-08-12 | 13F | Entropy Technologies, LP | 12,594 | -80.06 | 130 | -81.59 | ||||
| 2025-06-27 | NP | LBO - WHITEWOLF Publicly Listed Private Equity ETF | 11,119 | 14.28 | 112 | 3.70 | ||||
| 2025-08-12 | 13F | Calton & Associates, Inc. | 10,938 | 113 | ||||||
| 2025-08-08 | 13F | Strategies Wealth Advisors, LLC | 12,921 | 2.96 | 133 | -5.00 | ||||
| 2025-05-08 | 13F | Arkadios Wealth Advisors | 0 | -100.00 | 0 | -100.00 | ||||
| 2025-08-12 | 13F | PSI Advisors, LLC | 0 | -100.00 | 0 | |||||
| 2025-08-13 | 13F | Quantbot Technologies LP | 21,234 | 219 | ||||||
| 2025-08-14 | 13F | Bnp Paribas Arbitrage, Sa | 5,284 | 55 | ||||||
| 2025-08-14 | 13F | Nebula Research & Development LLC | 56,045 | 31.09 | 579 | 20.92 | ||||
| 2025-08-06 | 13F | Yelin Lapidot Holdings Management Ltd. | 19,500 | 0.00 | 201 | -7.80 | ||||
| 2025-05-15 | 13F | Oxford Asset Management Llp | 12,186 | 136 | ||||||
| 2025-08-15 | 13F | Tower Research Capital LLC (TRC) | 358 | -92.84 | 4 | -94.55 | ||||
| 2025-08-14 | 13F | Altshuler Shaham Ltd | 1,730,086 | 9.98 | 17,872 | 1.52 | ||||
| 2025-07-30 | 13F | Mid-American Wealth Advisory Group, Inc. | 485 | 5 | ||||||
| 2025-07-28 | 13F | Harbour Investments, Inc. | 1,000 | 0.00 | 10 | -9.09 | ||||
| 2025-08-13 | 13F | EverSource Wealth Advisors, LLC | 1,452 | 1,257.01 | 15 | 1,300.00 | ||||
| 2025-05-12 | 13F | Fmr Llc | 0 | -100.00 | 0 | |||||
| 2025-08-12 | 13F | Magnetar Financial LLC | 0 | -100.00 | 0 | |||||
| 2025-08-12 | 13F | Advisors Asset Management, Inc. | 329,829 | -0.39 | 3,407 | -8.04 | ||||
| 2025-07-17 | 13F | Sound Income Strategies, LLC | 3,904,625 | 8.91 | 40,335 | 0.54 | ||||
| 2025-08-14 | 13F | Camden Capital, LLC | 26,658 | 0.00 | 275 | -7.72 | ||||
| 2025-07-29 | 13F | TrueMark Investments, LLC | 0 | -100.00 | 0 | -100.00 | ||||
| 2025-08-14 | 13F | Raymond James Financial Inc | 25,177 | -18.34 | 260 | -24.42 | ||||
| 2025-08-11 | 13F | HighTower Advisors, LLC | 95,188 | -1.24 | 983 | -8.81 | ||||
| 2025-08-14 | 13F | Murphy & Mullick Capital Management Corp | 1,038 | 2.67 | 11 | -9.09 | ||||
| 2025-08-14 | 13F | Ameriprise Financial Inc | 69,959 | 7.41 | 707 | -3.28 | ||||
| 2025-08-11 | 13F | NewEdge Wealth, LLC | 295,639 | 3.33 | 3,075 | -3.97 | ||||
| 2025-08-14 | 13F | Hrt Financial Lp | 0 | -100.00 | 0 | |||||
| 2025-08-13 | 13F | Russell Investments Group, Ltd. | 0 | -100.00 | 0 | |||||
| 2025-07-17 | 13F | Janney Montgomery Scott LLC | 41,874 | -4.21 | 0 | |||||
| 2025-08-14 | 13F | Balyasny Asset Management Llc | 243,615 | -58.07 | 2,517 | -61.30 | ||||
| 2025-08-14 | 13F | Citadel Advisors Llc | 0 | -100.00 | 0 | |||||
| 2025-04-21 | 13F | Ronald Blue Trust, Inc. | 0 | -100.00 | 0 | -100.00 | ||||
| 2025-08-14 | 13F | Bank Of America Corp /de/ | 14,429 | -3.74 | 149 | -10.78 | ||||
| 2025-08-11 | 13F | Private Advisor Group, LLC | 16,438 | 2.41 | 170 | -5.59 | ||||
| 2025-07-11 | 13F | Farther Finance Advisors, LLC | 1,594 | 5.15 | 16 | 0.00 | ||||
| 2025-08-13 | 13F | ExodusPoint Capital Management, LP | 32,900 | -54.18 | 0 | |||||
| 2025-08-14 | 13F | Group One Trading, L.p. | 95 | 0.00 | 1 | -100.00 | ||||
| 2025-07-18 | 13F | Truist Financial Corp | 15,795 | 5.12 | 163 | -2.98 | ||||
| 2025-08-12 | 13F | MAI Capital Management | 3,296 | -4.79 | 34 | -10.53 | ||||
| 2025-05-16 | 13F/A | Goldman Sachs Group Inc | 0 | -100.00 | 0 | -100.00 | ||||
| 2025-08-13 | 13F | Jump Financial, LLC | 20,995 | 217 | ||||||
| 2025-07-22 | 13F | Miracle Mile Advisors, LLC | 11,388 | 2.97 | 118 | -4.88 | ||||
| 2025-08-01 | 13F | Y-Intercept (Hong Kong) Ltd | 207,207 | 734.74 | 2,140 | 672.56 | ||||
| 2025-08-12 | 13F | Hillsdale Investment Management Inc. | 0 | -100.00 | 0 | |||||
| 2025-08-14 | 13F | Susquehanna International Group, Llp | 110,971 | 328.51 | 1,146 | 296.54 | ||||
| 2025-08-12 | 13F | Dynamic Technology Lab Private Ltd | 14,271 | 5.32 | 147 | -2.65 | ||||
| 2025-08-13 | 13F | PharVision Advisers, LLC | 0 | -100.00 | 0 | |||||
| 2025-08-14 | 13F | Scoggin Management Lp | 0 | -100.00 | 0 | |||||
| 2025-08-06 | 13F | First Horizon Advisors, Inc. | 566 | 6 | ||||||
| 2025-08-12 | 13F | Virtu Financial LLC | 0 | -100.00 | 0 | |||||
| 2025-08-14 | 13F | Wells Fargo & Company/mn | 94,376 | 245.17 | 975 | 219.34 | ||||
| 2025-08-14 | 13F | Stifel Financial Corp | 58,603 | -2.99 | 605 | -10.37 | ||||
| 2025-08-11 | 13F | Synergy Investment Management, LLC | 25,011 | 10.42 | 258 | 1.98 | ||||
| 2025-08-14 | 13F | GWM Advisors LLC | 4,714 | 0.00 | 49 | -7.69 | ||||
| 2025-08-12 | 13F | CIBC Private Wealth Group, LLC | 7,122 | 0.00 | 74 | 12.31 | ||||
| 2025-08-14 | 13F | Millennium Management Llc | 720,074 | -39.83 | 7,438 | -44.46 | ||||
| 2025-08-08 | 13F | Hartland & Co., LLC | 0 | -100.00 | 0 | |||||
| 2025-04-30 | 13F | POM Investment Strategies, LLC | 0 | -100.00 | 0 | -100.00 | ||||
| 2025-08-12 | 13F | Proequities, Inc. | Put | 0 | 0 | |||||
| 2025-08-14 | 13F | Citadel Advisors Llc | Put | 22,900 | 116.04 | 237 | 100.00 | |||
| 2025-08-12 | 13F | Proequities, Inc. | Call | 0 | 0 | |||||
| 2025-08-14 | 13F | Two Sigma Advisers, Lp | 653,075 | -48.63 | 6,746 | -52.58 | ||||
| 2025-08-12 | 13F | Proequities, Inc. | 0 | 0 | ||||||
| 2025-08-14 | 13F | First Foundation Advisors | 12,393 | 0.00 | 128 | -7.25 | ||||
| 2025-07-31 | 13F | Optimum Investment Advisors | 17,500 | 0.00 | 181 | -7.69 | ||||
| 2025-07-31 | 13F | Sumitomo Mitsui Trust Holdings, Inc. | 81,236 | 57.27 | 839 | 45.16 | ||||
| 2025-06-25 | NP | VPC - Virtus Private Credit Strategy ETF | 90,483 | 1.15 | 915 | -8.69 | ||||
| 2025-08-14 | 13F | Citadel Advisors Llc | Call | 0 | -100.00 | 0 | ||||
| 2025-08-05 | 13F | Huntington National Bank | 0 | -100.00 | 0 | |||||
| 2025-08-14 | 13F | UBS Group AG | 1,117,647 | 81.73 | 11,545 | 67.76 | ||||
| 2025-07-17 | 13F | GraniteShares Advisors LLC | 255,250 | 6.67 | 2,637 | -1.53 | ||||
| 2025-08-12 | 13F | XTX Topco Ltd | 0 | -100.00 | 0 | |||||
| 2025-08-26 | NP | FTKI - First Trust Small Cap BuyWrite Income ETF | 0 | -100.00 | 0 | -100.00 | ||||
| 2025-07-16 | 13F | ORG Partners LLC | 1,500 | 0.00 | 16 | -6.25 | ||||
| 2025-08-11 | 13F | Hexagon Capital Partners LLC | 0 | -100.00 | 0 | |||||
| 2025-07-28 | NP | KBWD - Invesco KBW High Dividend Yield Financial ETF This fund is a listed as child fund of Invesco Ltd. and if that institution has disclosed ownership in this security, then these positions will not be double counted when calculating total shares and total value | 1,032,944 | 5.54 | 10,639 | -4.14 | ||||
| 2025-08-14 | 13F | Beacon Investment Advisors Llc | 19,886 | 1.36 | 204 | -7.31 | ||||
| 2025-08-27 | 13F/A | Squarepoint Ops LLC | 0 | -100.00 | 0 | -100.00 | ||||
| 2025-07-15 | 13F | Graypoint LLC | 75,302 | 2.96 | 778 | -5.01 | ||||
| 2025-07-09 | 13F | Westbourne Investments, Inc. | 19,175 | -5.59 | 198 | -12.78 | ||||
| 2025-07-24 | 13F | Us Bancorp \de\ | 4,000 | -0.12 | 41 | -6.82 | ||||
| 2025-08-29 | NP | GraniteShares ETF Trust - GraniteShares HIPS US High Income ETF | 255,250 | 6.67 | 2,637 | -1.53 | ||||
| 2025-08-13 | 13F | Natixis | 44,576 | 0.00 | 460 | -7.63 | ||||
| 2025-08-14 | 13F | Qube Research & Technologies Ltd | 798,816 | -20.27 | 8,252 | -26.40 | ||||
| 2025-08-12 | 13F | Jpmorgan Chase & Co | 51,706 | -41.10 | 534 | -45.62 | ||||
| 2025-07-25 | 13F | Cwm, Llc | 4,771 | 0 | ||||||
| 2025-07-31 | 13F | Cambridge Investment Research Advisors, Inc. | 78,176 | 32.39 | 1 | |||||
| 2025-08-15 | 13F | Morgan Stanley | 388,070 | -30.43 | 4,009 | -35.78 | ||||
| 2025-04-22 | 13F | Jmac Enterprises Llc | 0 | -100.00 | 0 | -100.00 | ||||
| 2025-07-31 | 13F | Caitong International Asset Management Co., Ltd | 177 | 17,600.00 | 2 | |||||
| 2025-08-13 | 13F | Invesco Ltd. | 1,076,310 | 2.52 | 11,118 | -5.35 | ||||
| 2025-08-14 | 13F | Jane Street Group, Llc | 0 | -100.00 | 0 | |||||
| 2025-08-14 | 13F | State Street Corp | 84,170 | 257.74 | 878 | 231.32 | ||||
| 2025-07-30 | 13F | Denali Advisors Llc | 69,103 | -2.61 | 714 | -10.09 | ||||
| 2025-07-24 | 13F | IFP Advisors, Inc | 3,434 | 3.00 | 35 | -5.41 | ||||
| 2025-08-05 | 13F | Simplex Trading, Llc | 30,528 | 2,375.91 | 0 | |||||
| 2025-08-08 | 13F | Cetera Investment Advisers | 63,704 | 2.13 | 658 | -5.60 | ||||
| 2025-08-05 | 13F | Simplex Trading, Llc | Put | 2,400 | 200.00 | 0 | ||||
| 2025-05-30 | NP | ERNZ - TrueShares Active Yield ETF | 310,616 | 735.71 | 3,476 | 755.91 | ||||
| 2025-08-01 | 13F | Envestnet Asset Management Inc | 36,933 | -1.67 | 382 | -9.29 | ||||
| 2025-08-06 | 13F | Wedbush Securities Inc | 139,202 | 5.04 | 1 | 0.00 | ||||
| 2025-05-01 | 13F | MQS Management LLC | 0 | -100.00 | 0 | -100.00 | ||||
| 2025-07-29 | 13F | Harbor Asset Planning, Inc. | 526 | 5 | ||||||
| 2025-08-12 | 13F | Legal & General Group Plc | 578,019 | 4.20 | 5,974 | -3.55 | ||||
| 2025-08-15 | 13F | CI Private Wealth, LLC | 53,747 | 247.00 | 555 | 220.81 | ||||
| 2025-08-14 | 13F | Quarry LP | 0 | -100.00 | 0 | |||||
| 2025-05-16 | 13F | Coppell Advisory Solutions LLC | 0 | -100.00 | 0 | |||||
| 2025-08-08 | 13F | Foundations Investment Advisors, LLC | 16,652 | 172 | ||||||
| 2025-04-24 | 13F | Mirae Asset Global Investments Co., Ltd. | 0 | -100.00 | 0 | -100.00 | ||||
| 2025-08-13 | 13F | Northwestern Mutual Wealth Management Co | 4,000 | 41 | ||||||
| 2025-08-15 | 13F | Great West Life Assurance Co /can/ | 86,588 | 3.37 | 1 | |||||
| 2025-08-14 | 13F | Two Sigma Investments, Lp | 942,801 | -45.81 | 9,739 | -49.97 | ||||
| 2025-07-31 | 13F | Sage Mountain Advisors LLC | 10,000 | 0.00 | 103 | -7.21 | ||||
| 2025-08-14 | 13F | Susquehanna International Group, Llp | Call | 0 | -100.00 | 0 | ||||
| 2025-08-14 | 13F | DRW Securities, LLC | 33,593 | 347 | ||||||
| 2025-08-14 | 13F | Susquehanna International Group, Llp | Put | 0 | -100.00 | 0 | ||||
| 2025-08-14 | 13F | Toroso Investments, LLC | 105,656 | 2.25 | 1,091 | -5.62 | ||||
| 2025-08-05 | 13F | Sigma Planning Corp | 10,439 | 0.53 | 108 | -7.76 | ||||
| 2025-05-12 | 13F | Connor, Clark & Lunn Investment Management Ltd. | 0 | -100.00 | 0 | -100.00 |
Other Listings
| GB:0KH0 | US$ 10.20 |