Mga Batayang Estadistika
| Pemilik Institusional | 321 total, 321 long only, 0 short only, 0 long/short - change of 6.27% MRQ |
| Alokasi Portofolio Rata-rata | 0.5396 % - change of 1.34% MRQ |
| Saham Institusional (Jangka Panjang) | 79,255,337 (ex 13D/G) - change of -0.50MM shares -0.63% MRQ |
| Nilai Institusional (Jangka Panjang) | $ 1,923,374 USD ($1000) |
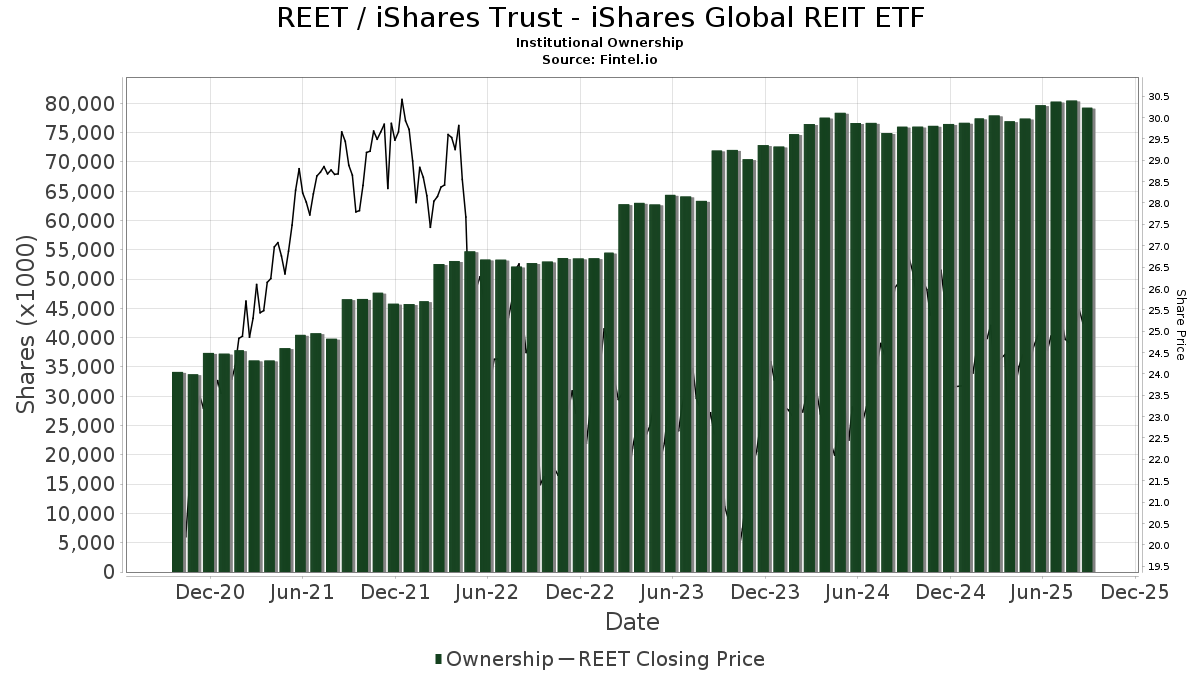
Kepemilikan Institusional dan Pemegang Saham
iShares Trust - iShares Global REIT ETF (US:REET) memiliki 321 pemilik institusional dan pemegang saham yang telah mengajukan formulir 13D/G atau 13F kepada Komisi Bursa Efek (Securities Exchange Commission/SEC). Lembaga-lembaga ini memegang total 79,255,337 saham. Pemegang saham terbesar meliputi Valmark Advisers, Inc., Hsbc Holdings Plc, Northwestern Mutual Wealth Management Co, BlackRock, Inc., M&t Bank Corp, Morgan Stanley, SageView Advisory Group, LLC, Savant Capital, LLC, Bank Of Montreal /can/, and Nepc Llc .
Struktur kepemilikan institusional iShares Trust - iShares Global REIT ETF (ARCA:REET) menunjukkan posisi terkini di perusahaan oleh institusi dan dana, serta perubahan terbaru dalam ukuran posisi. Pemegang saham utama dapat mencakup investor individu, reksa dana, dana lindung nilai, atau institusi. Jadwal 13D menunjukkan bahwa investor memegang (atau pernah memegang) lebih dari 5% saham perusahaan dan bermaksud (atau pernah bermaksud) untuk secara aktif mengejar perubahan strategi bisnis. Jadwal 13G menunjukkan investasi pasif lebih dari 5%.
The share price as of September 8, 2025 is 25.56 / share. Previously, on September 9, 2024, the share price was 26.30 / share. This represents a decline of 2.81% over that period.
Skor Sentimen Dana
Skor Sentimen Dana (sebelumnya dikenal sebagai Skor Akumulasi Kepemilikan) menemukan saham-saham yang paling banyak dibeli oleh dana. Ini adalah hasil dari model kuantitatif multi-faktor yang canggih yang mengidentifikasi perusahaan dengan tingkat akumulasi institusional tertinggi. Model penilaian menggunakan kombinasi dari total peningkatan pemilik yang diungkapkan, perubahan dalam alokasi portofolio pada pemilik tersebut, dan metrik lainnya. Angka berkisar dari 0 hingga 100, dengan angka yang lebih tinggi menunjukkan tingkat akumulasi yang lebih tinggi dibandingkan dengan perusahaan sejenisnya, dan 50 adalah rata-ratanya.
Frekuensi Pembaruan: Setiap Hari
Lihat Ownership Explorer, yang menyediakan daftar perusahaan dengan peringkat tertinggi.
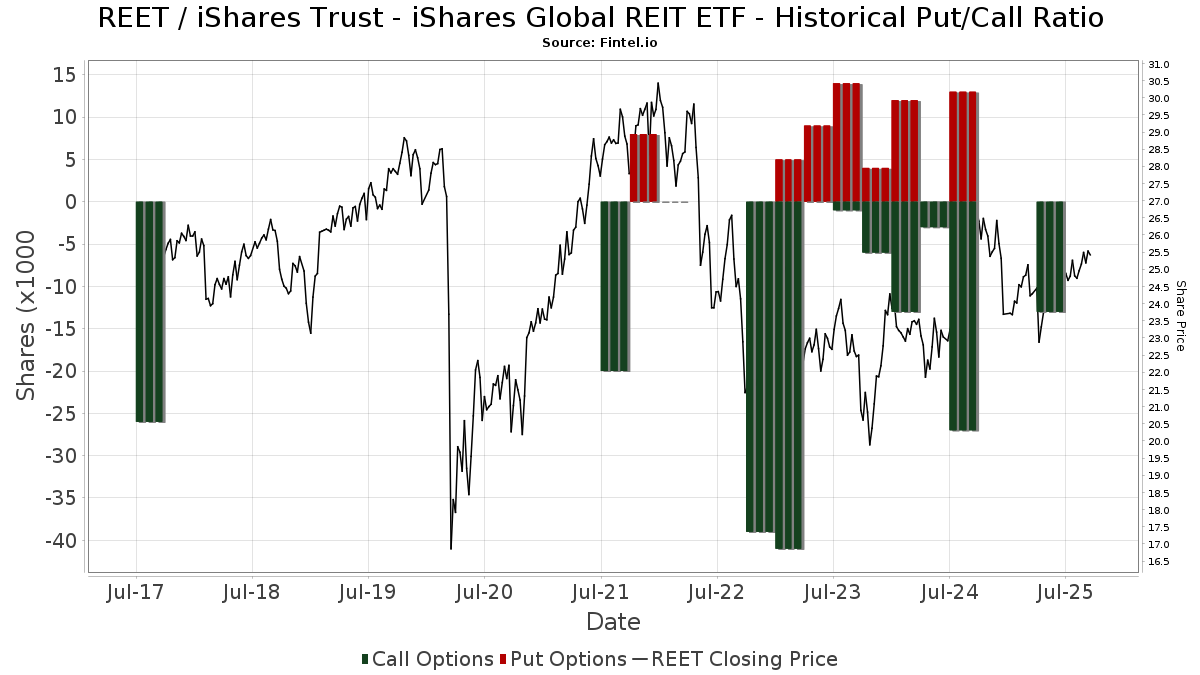
Rasio Put/Call Institusional
Selain melaporkan isu ekuitas dan utang standar, institusi dengan aset di bawah manajemen lebih dari 100 juta dolar AS juga harus mengungkapkan kepemilikan opsi put dan call mereka. Karena opsi put umumnya menunjukkan sentimen negatif, dan opsi call menunjukkan sentimen positif, kita dapat mengetahui sentimen institusional secara keseluruhan dengan memplot rasio put terhadap call. Grafik di sebelah kanan memplot rasio put/call historis untuk instrumen ini.
Menggunakan Rasio Put/Call sebagai indikator sentimen investor mengatasi salah satu kekurangan utama dari penggunaan total kepemilikan institusional, yaitu sejumlah besar aset yang dikelola diinvestasikan secara pasif untuk melacak indeks. Dana yang dikelola secara pasif biasanya tidak membeli opsi, sehingga indikator rasio put/call lebih akurat dalam melacak sentimen dana yang dikelola secara aktif.
Pengajuan 13F dan NPORT
Detail pada pengajuan 13F tersedia gratis. Detail pada pengajuan NP memerlukan keanggotaan premium. Baris berwarna hijau menunjukkan posisi baru. Baris berwarna merah menunjukkan posisi yang sudah ditutup. Klik tautan ini ikon untuk melihat riwayat transaksi selengkapnya.
Tingkatkan
untuk membuka data premium dan mengekspor ke Excel ![]() .
.
| Tanggal File | Sumber | Investor | Ketik | Presyo ng Avg (Silangan) |
Saham | Δ Saham (%) |
Dilaporkan Nilai ($1000) |
Nilai Δ (%) |
Alokasi Port (%) |
|
|---|---|---|---|---|---|---|---|---|---|---|
| 2025-08-14 | 13F | Boston Private Wealth Llc | 63,817 | -54.50 | 1,576 | -53.67 | ||||
| 2025-08-01 | 13F | Biltmore Family Office, LLC | 850 | 0.00 | 21 | 0.00 | ||||
| 2025-03-27 | NP | TCHDX - Transamerica ClearTrack 2035 R6 | 104,795 | 56.08 | 2,549 | 48.83 | ||||
| 2025-07-15 | 13F | Fifth Third Bancorp | 5,902 | 146 | ||||||
| 2025-08-06 | 13F | Golden State Wealth Management, LLC | 268 | 0.00 | 7 | 0.00 | ||||
| 2025-07-16 | 13F | Signaturefd, Llc | 876 | 0.46 | 22 | 0.00 | ||||
| 2025-08-15 | 13F | Captrust Financial Advisors | 20,048 | 0.01 | 495 | 1.85 | ||||
| 2025-08-26 | NP | Northern Lights Variable Trust - TOPS Moderate Growth ETF Portfolio Class 1 shares | 330,917 | 4.97 | 8,174 | 6.86 | ||||
| 2025-07-15 | 13F | Level Financial Advisors, Inc. | 41,840 | -15.46 | 1,033 | -13.92 | ||||
| 2025-08-07 | 13F | Allworth Financial LP | 10 | 0.00 | 0 | |||||
| 2025-08-13 | 13F | Parkworth Wealth Management, Inc. | 36,375 | 1.05 | 898 | 2.86 | ||||
| 2025-08-07 | 13F | Tacita Capital Inc | 4,262 | 0.00 | 105 | 1.94 | ||||
| 2025-08-14 | 13F | Royal Bank Of Canada | 889,389 | 24.75 | 21,969 | 27.03 | ||||
| 2025-08-14 | 13F | Goldman Sachs Group Inc | 1,203,517 | 3.35 | 29,727 | 5.22 | ||||
| 2025-08-14 | 13F | GWM Advisors LLC | 46,407 | -1.40 | 1,146 | 0.44 | ||||
| 2025-04-17 | 13F | Rs Crum Inc. | 131,280 | -0.38 | 3,185 | 0.82 | ||||
| 2025-07-09 | 13F | Seaside Wealth Management, Inc. | 19,336 | 4.55 | 478 | 6.47 | ||||
| 2025-08-13 | 13F | Transce3nd, LLC | 764 | 3.66 | 19 | 5.88 | ||||
| 2025-08-26 | NP | Northern Lights Variable Trust - TOPS Balanced ETF Portfolio Class 1 shares | 216,614 | 2.24 | 5,350 | 4.11 | ||||
| 2025-06-26 | NP | TCTKX - Transamerica ClearTrack 2025 R3 | 41,509 | 1,003 | ||||||
| 2025-04-11 | 13F | Davis Capital Management | 1 | 0.00 | 0 | |||||
| 2025-05-02 | 13F | Kooman & Associates | 0 | -100.00 | 0 | |||||
| 2025-08-06 | 13F | Commonwealth Equity Services, Llc | 453,964 | 21.72 | 11 | 22.22 | ||||
| 2025-03-27 | NP | TDITX - Transamerica ClearTrack 2025 R1 | 72,077 | 48.14 | 1,753 | 41.18 | ||||
| 2025-07-25 | 13F | Envestnet Portfolio Solutions, Inc. | 9,763 | -22.14 | 241 | -20.72 | ||||
| 2025-08-06 | 13F | New Millennium Group LLC | 664 | 0.00 | 16 | 0.00 | ||||
| 2025-07-21 | 13F | Red Mountain Financial, LLC | 13,940 | 324 | ||||||
| 2025-08-05 | 13F | GPS Wealth Strategies Group, LLC | 415 | 0.73 | 10 | 0.00 | ||||
| 2025-08-13 | 13F | EverSource Wealth Advisors, LLC | 6,869 | -75.38 | 170 | -75.00 | ||||
| 2025-07-07 | 13F | Investors Research Corp | 196 | 0.00 | 5 | 0.00 | ||||
| 2025-07-15 | 13F | Bfsg, Llc | 629 | 0.00 | 16 | 0.00 | ||||
| 2025-08-14 | 13F | D. E. Shaw & Co., Inc. | 15,558 | -12.56 | 384 | -10.90 | ||||
| 2025-08-13 | 13F | RFP Financial Group LLC | 140,404 | -2.16 | 3,468 | -0.40 | ||||
| 2025-08-14 | 13F | Wilshire Associates Inc | 0 | -100.00 | 0 | |||||
| 2025-08-26 | NP | Northern Lights Variable Trust - TOPS Aggressive Growth ETF Portfolio Class 2 shares | 374,828 | 9.54 | 9,258 | 11.53 | ||||
| 2025-04-28 | 13F | Redmont Wealth Advisors Llc | 18 | 0 | ||||||
| 2025-07-24 | 13F | Leo Wealth, LLC | 19,694 | 2.07 | 486 | 3.85 | ||||
| 2025-08-12 | 13F | BlackRock, Inc. | 4,936,996 | 0.01 | 121,944 | 1.82 | ||||
| 2025-08-07 | 13F | Resources Investment Advisors, LLC. | 13,770 | -27.34 | 340 | -25.93 | ||||
| 2025-07-23 | 13F | Elevate Wealth Advisory, Inc | 2,992 | 0.00 | 74 | 1.39 | ||||
| 2025-08-14 | 13F | Financial Advisory Service, Inc. | 79,280 | 3.27 | 1,958 | 5.16 | ||||
| 2025-08-11 | 13F | Diversified Portfolios, Inc. | 853,902 | 4.67 | 21,091 | 6.57 | ||||
| 2025-07-28 | 13F | Cutler Investment Counsel Llc | 272,096 | 9.80 | 6,721 | 11.80 | ||||
| 2025-07-31 | 13F | Asset Management One Co., Ltd. | 309,000 | -3.74 | 7,632 | -1.99 | ||||
| 2025-08-18 | 13F/A | National Bank Of Canada /fi/ | 3,216 | -63.12 | 79 | -62.56 | ||||
| 2025-07-24 | 13F | Morton Brown Family Wealth, LLC | 431,190 | 6.09 | 10,650 | 8.01 | ||||
| 2025-05-08 | 13F | Natixis Advisors, L.p. | 0 | -100.00 | 0 | |||||
| 2025-08-06 | 13F | Longview Financial Advisors LLC | 25,507 | -2.69 | 630 | -0.79 | ||||
| 2025-08-14 | 13F | UBS Group AG | 93,371 | 88.93 | 2,306 | 92.49 | ||||
| 2025-08-11 | 13F | Wealthspire Advisors, LLC | 192,801 | -3.79 | 4,762 | -2.04 | ||||
| 2025-07-10 | 13F | Sumitomo Mitsui DS Asset Management Company, Ltd | 1,038,021 | 2.10 | 25,639 | 3.95 | ||||
| 2025-07-14 | 13F | Harbor Group, Inc. | 26,600 | -1.39 | 657 | 0.46 | ||||
| 2025-07-23 | 13F | Valmark Advisers, Inc. | 5,816,994 | 1.80 | 143,680 | 3.64 | ||||
| 2025-08-14 | 13F | Old Mission Capital Llc | 66,334 | 1,638 | ||||||
| 2025-06-26 | NP | TCTLX - Transamerica ClearTrack 2030 R3 | 65,716 | 1,588 | ||||||
| 2025-05-16 | 13F | McIlrath & Eck, LLC | 0 | -100.00 | 0 | |||||
| 2025-08-14 | 13F | Mml Investors Services, Llc | 33,543 | 1.30 | 1 | |||||
| 2025-07-23 | 13F | Foundation Wealth Management, LLC | 48,785 | -1.59 | 1,205 | 0.17 | ||||
| 2025-08-14 | 13F | Toronto Dominion Bank | 150,000 | 4,770.13 | 3,705 | 4,906.76 | ||||
| 2025-05-15 | 13F | Talon Private Wealth, LLC | 0 | -100.00 | 0 | -100.00 | ||||
| 2025-07-31 | 13F | Waldron Private Wealth LLC | 382,996 | -2.17 | 9,460 | -0.39 | ||||
| 2025-08-14 | 13F | Qube Research & Technologies Ltd | 46,006 | 41.14 | 1,136 | 43.80 | ||||
| 2025-06-26 | NP | TCTMX - Transamerica ClearTrack 2035 R3 | 98,874 | 2,390 | ||||||
| 2025-08-05 | 13F | Scarborough Advisors, LLC | 13 | 0 | ||||||
| 2025-07-28 | 13F | Courier Capital Llc | 23,702 | -0.42 | 585 | 1.39 | ||||
| 2025-08-18 | 13F | Front Row Advisors LLC | 300 | -40.00 | 7 | -41.67 | ||||
| 2025-08-29 | 13F | Evolution Wealth Management Inc. | 334 | 8 | ||||||
| 2025-05-21 | 13F/A | Geneos Wealth Management Inc. | 0 | -100.00 | 0 | -100.00 | ||||
| 2025-08-14 | 13F | Guardian Wealth Advisors, Llc / Nc | 17,860 | 3.45 | 441 | 5.50 | ||||
| 2025-07-11 | 13F/A | Umb Bank N A/mo | 6,967 | -28.97 | 172 | -27.43 | ||||
| 2025-08-13 | 13F | Holos Integrated Wealth LLC | 332 | 0.00 | 8 | 0.00 | ||||
| 2025-08-07 | 13F | Hughes Financial Services, LLC | 0 | -100.00 | 0 | |||||
| 2025-07-30 | 13F | First Citizens Bank & Trust Co | 8,594 | -30.89 | 212 | -29.57 | ||||
| 2025-07-31 | 13F | Nisa Investment Advisors, Llc | 0 | -100.00 | 0 | |||||
| 2025-07-14 | 13F | Matrix Trust Co | 57,259 | 0.90 | 1 | 0.00 | ||||
| 2025-08-14 | 13F | Manufacturers Life Insurance Company, The | 383,113 | -30.68 | 9,463 | -29.43 | ||||
| 2025-06-03 | 13F/A | First National Bank Of Omaha | 21,163 | -34.42 | 513 | -34.23 | ||||
| 2025-08-13 | 13F | Beacon Pointe Advisors, LLC | 18,980 | -3.32 | 469 | -1.68 | ||||
| 2025-06-23 | NP | IYLD - iShares Morningstar Multi-Asset Income ETF | 235,485 | 135.53 | 5,692 | 134.10 | ||||
| 2025-08-15 | 13F | North Ridge Wealth Advisors, Inc. | 43,018 | -0.03 | 1,063 | 1.82 | ||||
| 2025-08-14 | 13F | Waterford Advisors, LLC | 34,411 | -88.51 | 7,477 | 2.92 | ||||
| 2025-07-07 | 13F | Accelerate Investment Advisors LLC | 40,204 | 3.86 | 993 | 5.75 | ||||
| 2025-08-14 | 13F | Jane Street Group, Llc | 975,311 | 24,090 | ||||||
| 2025-05-15 | 13F | SRS Capital Advisors, Inc. | 0 | -100.00 | 0 | |||||
| 2025-08-12 | 13F | Steward Partners Investment Advisory, Llc | 357 | 30.77 | 9 | 33.33 | ||||
| 2025-08-14 | 13F | Hrt Financial Lp | 20,929 | 39.60 | 1 | |||||
| 2025-03-27 | NP | TDFTX - Transamerica ClearTrack 2030 R1 | 84,053 | 50.56 | 2,044 | 43.54 | ||||
| 2025-07-08 | 13F | Zrc Wealth Management, Llc | 3,460 | 0.46 | 85 | 2.41 | ||||
| 2025-05-06 | 13F | Assetmark, Inc | 0 | -100.00 | 0 | |||||
| 2025-07-10 | 13F | Financial Management Network Inc | 11,797 | 1.13 | 294 | 15.29 | ||||
| 2025-07-31 | 13F | Buckingham Strategic Partners | 84,074 | 80.69 | 2,077 | 84.04 | ||||
| 2025-08-08 | 13F | Intrua Financial, LLC | 0 | -100.00 | 0 | |||||
| 2025-08-26 | NP | Northern Lights Variable Trust - TOPS Growth ETF Portfolio Class 2 shares | 415,990 | 10.12 | 10,275 | 12.11 | ||||
| 2025-08-08 | 13F | Capstone Financial Advisors, Inc. | 841,329 | 0.40 | 20,781 | 2.22 | ||||
| 2025-07-17 | 13F | XY Planning Network, Inc. | 58,651 | 1,449 | ||||||
| 2025-04-14 | 13F | Greenspring Advisors, LLC | 46,134 | 21.99 | 1,119 | 23.51 | ||||
| 2025-08-08 | 13F | Commonwealth Of Pennsylvania Public School Empls Retrmt Sys | 430,936 | 97.28 | 10,644 | 100.87 | ||||
| 2025-08-11 | 13F | One Capital Management, LLC | 577,488 | 0.62 | 14,264 | 2.43 | ||||
| 2025-08-06 | 13F | AE Wealth Management LLC | 30,550 | -5.42 | 755 | -3.70 | ||||
| 2025-07-23 | 13F | Prime Capital Investment Advisors, LLC | 11,652 | -11.13 | 288 | -9.75 | ||||
| 2025-08-12 | 13F | Franklin Resources Inc | 42,591 | -6.70 | 1,052 | -5.06 | ||||
| 2025-08-06 | 13F | SOUTH STATE Corp | 6,000 | 3.63 | 148 | 5.71 | ||||
| 2025-08-12 | 13F | Integrated Advisors Network LLC | 10,105 | 1.05 | 250 | 2.89 | ||||
| 2025-08-13 | 13F | Quadrature Capital Ltd | 0 | -100.00 | 0 | |||||
| 2025-08-15 | 13F | CI Private Wealth, LLC | 362,651 | -8.47 | 8,957 | -6.81 | ||||
| 2025-08-13 | 13F | Amundi | 700,000 | 0.00 | 17,416 | 4.93 | ||||
| 2025-07-30 | 13F | First Interstate Bank | 14,514 | 0.00 | 358 | 1.70 | ||||
| 2025-07-28 | 13F | WealthPlan Investment Management, LLC | 24,277 | 1.28 | 600 | 3.10 | ||||
| 2025-08-12 | 13F | Founders Financial Alliance, LLC | 79 | 0.00 | 2 | 0.00 | ||||
| 2025-08-05 | 13F | Bank Of Montreal /can/ | 1,950,176 | -27.95 | 48,169 | -26.64 | ||||
| 2025-08-04 | 13F | Spire Wealth Management | 0 | -100.00 | 0 | |||||
| 2025-05-15 | 13F/A | Orion Portfolio Solutions, LLC | 45,553 | 51.50 | 1,105 | 53.47 | ||||
| 2025-08-07 | 13F | Mitsubishi UFJ Kokusai Asset Management Co., Ltd. | 56,649 | 0.00 | 1,399 | 1.82 | ||||
| 2025-08-14 | 13F | Federation des caisses Desjardins du Quebec | 206 | 0.00 | 5 | 25.00 | ||||
| 2025-08-05 | 13F | Huntington National Bank | 116 | |||||||
| 2025-05-12 | 13F | Sandy Spring Bank | 8 | 0 | ||||||
| 2025-08-14 | 13F | Fmr Llc | 7,730 | 3.00 | 191 | 4.40 | ||||
| 2025-05-14 | 13F | Susquehanna International Group, Llp | 0 | -100.00 | 0 | |||||
| 2025-07-24 | 13F | Jfs Wealth Advisors, Llc | 85,500 | -11.39 | 2,112 | -9.79 | ||||
| 2025-08-13 | 13F | Quadrant Capital Group Llc | 0 | -100.00 | 0 | |||||
| 2025-06-26 | NP | TCTQX - Transamerica ClearTrack 2040 R3 | 95,628 | 2,311 | ||||||
| 2025-08-01 | 13F | Envestnet Asset Management Inc | 792,184 | 0.25 | 19,567 | 2.07 | ||||
| 2025-08-14 | 13F | Ameriprise Financial Inc | 35,888 | -4.99 | 884 | -3.49 | ||||
| 2025-07-15 | 13F | FLP Wealth Management, LLC | 0 | -100.00 | 0 | |||||
| 2025-08-05 | 13F | Castlekeep Investment Advisors Llc | 8,891 | 0.35 | 220 | 2.34 | ||||
| 2025-06-26 | NP | TCTTX - Transamerica ClearTrack 2045 R3 | 74,568 | 1,802 | ||||||
| 2025-08-12 | 13F | MAI Capital Management | 1,698 | -12.65 | 42 | -12.77 | ||||
| 2025-08-14 | 13F | Strive Asset Management, LLC | 0 | -100.00 | 0 | |||||
| 2025-08-14 | 13F | Betterment LLC | 15,906 | 44.14 | 0 | |||||
| 2025-05-02 | 13F | MB Generational Wealth, LLC | 69,563 | 31.02 | 1,688 | 32.63 | ||||
| 2025-08-08 | 13F | Financial Gravity Companies, Inc. | 424 | 0.00 | 10 | 0.00 | ||||
| 2025-07-08 | 13F | Peirce Capital Management, LLC | 47,371 | 1,170 | ||||||
| 2025-07-09 | 13F | Aurelius Family Office LLC | 96,381 | 4.26 | 2,381 | 6.16 | ||||
| 2025-08-14 | 13F | Sunbelt Securities, Inc. | 21,856 | 1.84 | 524 | 0.58 | ||||
| 2025-08-14 | 13F | Two Sigma Securities, Llc | 8,425 | 208 | ||||||
| 2025-07-03 | 13F | Collective Family Office Llc | 103,198 | 24.21 | 2,549 | 26.45 | ||||
| 2025-08-01 | 13F | Advisory Alpha, LLC | 8,097 | 200 | ||||||
| 2025-08-12 | 13F | Aviso Financial Inc. | 12,267 | 7.11 | 303 | 9.39 | ||||
| 2025-08-27 | 13F/A | Squarepoint Ops LLC | 17,236 | 426 | ||||||
| 2025-07-25 | 13F | Cwm, Llc | 12,788 | -27.67 | 0 | |||||
| 2025-08-05 | 13F | Hills Bank & Trust Co | 108,843 | 2,688 | ||||||
| 2025-07-21 | 13F | Mirae Asset Global Investments Co., Ltd. | 93,891 | -7.94 | 2,319 | 895.28 | ||||
| 2025-08-14 | 13F | Integrated Wealth Concepts LLC | 11,679 | -3.21 | 288 | -1.37 | ||||
| 2025-07-31 | 13F | Cambridge Investment Research Advisors, Inc. | 25,252 | 11.91 | 1 | |||||
| 2025-08-14 | 13F | Comerica Bank | 33,995 | 0.60 | 840 | 2.44 | ||||
| 2025-07-25 | 13F | Stonehage Fleming Financial Services Holdings Ltd | 4,845 | 0.00 | 120 | 1.71 | ||||
| 2025-07-29 | 13F | Aspiriant, Llc | 20,204 | -28.60 | 499 | -27.26 | ||||
| 2025-08-14 | 13F | Citadel Advisors Llc | Call | 13,000 | 321 | |||||
| 2025-08-13 | 13F | M&t Bank Corp | 4,912,571 | -0.09 | 121,341 | 1.72 | ||||
| 2025-06-30 | 13F/A | Deutsche Bank Ag\ | 0 | -100.00 | 0 | |||||
| 2025-08-15 | 13F | Morgan Stanley | 3,392,807 | -0.06 | 83,802 | 1.75 | ||||
| 2025-06-26 | NP | TCTUX - Transamerica ClearTrack 2050 R3 | 67,506 | 1,632 | ||||||
| 2025-05-01 | 13F | Quest 10 Wealth Builders, Inc. | 236 | -11.61 | 6 | -16.67 | ||||
| 2025-07-21 | 13F | Creative Capital Management Investments LLC | 1,836 | 0.00 | 45 | 2.27 | ||||
| 2025-07-22 | 13F | SOL Capital Management CO | 150,600 | -0.02 | 4 | 0.00 | ||||
| 2025-08-08 | 13F | Cetera Investment Advisers | 304,892 | -2.42 | 7,531 | -0.65 | ||||
| 2025-08-07 | 13F | Aegis Wealth Management LLC | 54,808 | 0.00 | 1,330 | 0.00 | ||||
| 2025-08-14 | 13F | DZ BANK AG Deutsche Zentral Genossenschafts Bank, Frankfurt am Main | 39,747 | -21.40 | 982 | -19.98 | ||||
| 2025-09-04 | 13F/A | Advisor Group Holdings, Inc. | 135,406 | -8.81 | 3,345 | -7.16 | ||||
| 2025-08-11 | 13F | Aptus Capital Advisors, LLC | 20,437 | 3.00 | 505 | 4.78 | ||||
| 2025-08-14 | 13F | Mercer Global Advisors Inc /adv | 93,628 | -10.86 | 2,313 | -9.26 | ||||
| 2025-08-12 | 13F | Pathstone Holdings, LLC | 16,722 | -45.25 | 413 | -44.19 | ||||
| 2025-07-24 | 13F | Brandywine Oak Private Wealth Llc | 624,804 | 2.03 | 15,433 | 3.88 | ||||
| 2025-08-11 | 13F | Nicola Wealth Management Ltd. | 903,300 | -19.94 | 22,312 | -18.49 | ||||
| 2025-08-05 | 13F | Integrity Financial Corp /WA | 191 | 0.00 | 5 | 0.00 | ||||
| 2025-08-12 | 13F | LPL Financial LLC | 1,617,901 | 2.98 | 39,962 | 4.85 | ||||
| 2025-08-12 | 13F | Insigneo Advisory Services, Llc | 21,986 | -23.83 | 543 | -22.43 | ||||
| 2025-08-06 | 13F | Capasso Planning Partners LLC | 76,024 | -27.50 | 1,878 | -26.19 | ||||
| 2025-07-30 | 13F | Clune & Associates, Ltd. | 64,780 | 10.43 | 1,600 | 12.44 | ||||
| 2025-07-15 | 13F | Maseco Llp | 8,999 | 222 | ||||||
| 2025-07-24 | 13F | Us Bancorp \de\ | 24,275 | 0.00 | 600 | 1.87 | ||||
| 2025-08-14 | 13F | First Foundation Advisors | 9,254 | 0.00 | 229 | 1.79 | ||||
| 2025-07-17 | 13F | Symmetry Partners, LLC | 28,135 | -3.90 | 695 | -2.25 | ||||
| 2025-07-02 | 13F | Boston Standard Wealth Management, LLC | 612,418 | 11.11 | 15,127 | 18.05 | ||||
| 2025-08-13 | 13F | Continuum Advisory, LLC | 0 | -100.00 | 0 | |||||
| 2025-07-14 | 13F | Foster Group, Inc. | 44,434 | -7.82 | 1,098 | -6.16 | ||||
| 2025-07-31 | 13F | 180 Wealth Advisors, Llc | 32,426 | 2.05 | 801 | 3.76 | ||||
| 2025-08-12 | 13F | Virtu Financial LLC | 0 | -100.00 | 0 | |||||
| 2025-08-14 | 13F | Stifel Financial Corp | 11,656 | 3.22 | 288 | 5.13 | ||||
| 2025-07-10 | 13F | Brooklyn FI, LLC | 309,953 | 15.92 | 7,656 | 18.02 | ||||
| 2025-08-06 | 13F | Decker Retirement Planning Inc. | 43 | 1 | ||||||
| 2025-08-14 | 13F | Bnp Paribas Arbitrage, Sa | 417,800 | -18.08 | 10,320 | -16.59 | ||||
| 2025-05-09 | 13F | McMill Wealth Management | 0 | -100.00 | 0 | |||||
| 2025-07-17 | 13F | Wolff Wiese Magana Llc | 200 | 0.00 | 5 | 0.00 | ||||
| 2025-08-11 | 13F | HighTower Advisors, LLC | 1,164,926 | -0.90 | 28,774 | 0.90 | ||||
| 2025-07-03 | 13F | McLean Asset Management Corp | 22,049 | -0.85 | 549 | 14.17 | ||||
| 2025-08-12 | 13F | O'shaughnessy Asset Management, Llc | 1,823 | -40.91 | 45 | -39.19 | ||||
| 2025-07-11 | 13F | Farther Finance Advisors, LLC | 39,019 | 708.52 | 964 | 723.08 | ||||
| 2025-07-18 | 13F | Trust Co Of Vermont | 10,007 | 150.74 | 247 | 157.29 | ||||
| 2025-04-29 | 13F | Traveka Wealth, LLC | 0 | -100.00 | 0 | |||||
| 2025-07-31 | 13F | Orion Capital Management LLC | 5,457 | 0.17 | 135 | 1.52 | ||||
| 2025-05-13 | 13F | Heck Capital Advisors, LLC | 0 | -100.00 | 0 | -100.00 | ||||
| 2025-08-13 | 13F | Capital Analysts, Inc. | 10,320 | 0.00 | 0 | |||||
| 2025-07-21 | 13F | Credential Qtrade Securities Inc. | 11,053 | 16.34 | 262 | 13.97 | ||||
| 2025-07-07 | 13F | Versant Capital Management, Inc | 56 | 0.00 | 1 | 0.00 | ||||
| 2025-08-07 | 13F | Rathbone Brothers plc | 21,486 | -16.50 | 531 | -15.06 | ||||
| 2025-08-15 | 13F | Urban Financial Advisory Corp | 2,613 | 0.77 | 65 | 3.23 | ||||
| 2025-08-13 | 13F | Northwestern Mutual Wealth Management Co | 5,013,169 | 2.71 | 123,825 | 4.58 | ||||
| 2025-04-22 | 13F/A | NorthRock Partners, LLC | 0 | -100.00 | 0 | |||||
| 2025-03-27 | NP | TCHTX - Transamerica ClearTrack 2020 R1 | 407 | -97.77 | 10 | -98.06 | ||||
| 2025-08-12 | 13F | NFP Retirement, Inc. | 65,804 | -14.15 | 1,625 | -12.59 | ||||
| 2025-08-14 | 13F | Colony Group, LLC | 276,997 | 17.96 | 6,842 | 20.10 | ||||
| 2025-08-14 | 13F | Raymond James Financial Inc | 93,836 | 11.70 | 2,318 | 13.69 | ||||
| 2025-07-08 | 13F | Apella Capital, LLC | 89,822 | -21.86 | 2,222 | -15.51 | ||||
| 2025-08-01 | 13F | Chilton Capital Management Llc | 1,138 | 28 | ||||||
| 2025-07-15 | 13F | Total Wealth Planning, Llc | 20,373 | -2.45 | 503 | -0.59 | ||||
| 2025-08-06 | 13F | Savant Capital, LLC | 2,624,235 | 9.22 | 64,819 | 11.20 | ||||
| 2025-08-05 | 13F | Avant Financial Advisors LLC | 26,976 | 4.07 | 666 | 6.05 | ||||
| 2025-07-23 | 13F | Abel Hall, LLC | 15,240 | -13.37 | 376 | -11.74 | ||||
| 2025-05-16 | 13F | Arete Wealth Advisors, LLC | 0 | -100.00 | 0 | |||||
| 2025-08-07 | 13F | Prime Buchholz LLC | 235,330 | -26.31 | 5,813 | -24.97 | ||||
| 2025-08-25 | 13F/A | Promus Capital, LLC | 2,758 | 68 | ||||||
| 2025-08-06 | 13F | Modera Wealth Management, LLC | 1,181,583 | 11.80 | 29,185 | 13.83 | ||||
| 2025-03-27 | NP | TCRTX - Transamerica ClearTrack 2040 R1 | 131,547 | 48.74 | 3,199 | 41.80 | ||||
| 2025-03-27 | NP | TCITX - Transamerica ClearTrack Retirement Income R1 | 112,048 | 254.20 | 2,725 | 238.09 | ||||
| 2025-07-21 | 13F | Ameritas Advisory Services, LLC | 7,700 | -58.81 | 190 | -58.06 | ||||
| 2025-08-14 | 13F | Peapack Gladstone Financial Corp | 15,092 | 10.76 | 0 | |||||
| 2025-07-28 | 13F | BRYN MAWR TRUST Co | 500 | 12 | ||||||
| 2025-08-08 | 13F | Hartland & Co., LLC | 8,724 | -10.98 | 215 | -9.28 | ||||
| 2025-07-15 | 13F | Alhambra Investment Partners LLC | 172,869 | -0.13 | 4,270 | 1.67 | ||||
| 2025-08-14 | 13F | Quantinno Capital Management LP | 0 | -100.00 | 0 | |||||
| 2025-04-15 | 13F | Corrigan Financial, Inc. | 189,624 | -1.07 | 4,600 | 0.13 | ||||
| 2025-07-17 | 13F | Raleigh Capital Management Inc. | 649 | 0.78 | 16 | 6.67 | ||||
| 2025-07-08 | 13F | Nbc Securities, Inc. | 3,530 | 1,383.19 | 0 | |||||
| 2025-07-28 | 13F | Harbour Investments, Inc. | 9 | -94.27 | 0 | -100.00 | ||||
| 2025-07-29 | 13F | Aire Advisors, Llc | 13,050 | 4.07 | 322 | 5.92 | ||||
| 2025-08-12 | 13F | Proequities, Inc. | 0 | 0 | ||||||
| 2025-08-26 | NP | Northern Lights Variable Trust - TOPS Managed Risk Moderate Growth ETF Portfolio Class 1 shares | 145,625 | -4.39 | 3,597 | -2.65 | ||||
| 2025-05-05 | 13F | Nwam Llc | 0 | -100.00 | 0 | |||||
| 2025-07-24 | 13F | Callan Family Office, LLC | 99,216 | -14.43 | 2,451 | -12.87 | ||||
| 2025-08-04 | 13F | Creative Financial Designs Inc /adv | 142 | 0.00 | 4 | 0.00 | ||||
| 2025-07-31 | 13F | BIP Wealth, LLC | 448,210 | -0.74 | 11,071 | 1.06 | ||||
| 2025-08-14 | 13F | Nepc Llc | 1,851,623 | 18.54 | 45,735 | 20.69 | ||||
| 2025-03-27 | NP | TCSOX - Transamerica ClearTrack 2060 Class R1 | 6,639 | 24.75 | 161 | 19.26 | ||||
| 2025-07-23 | 13F | TPG Financial Advisors, LLC | 0 | -100.00 | 0 | |||||
| 2025-05-15 | 13F | Cullen Capital Management, LLC | 0 | -100.00 | 0 | -100.00 | ||||
| 2025-07-31 | 13F | Glass Jacobson Investment Advisors llc | 0 | -100.00 | 0 | |||||
| 2025-05-14 | 13F | Family Wealth Group, LLC | 0 | -100.00 | 0 | -100.00 | ||||
| 2025-08-13 | 13F | Sumitomo Mitsui Financial Group, Inc. | 100,850 | 3.96 | 2,491 | 5.82 | ||||
| 2025-07-17 | 13F | SC&H Financial Advisors, Inc. | 126,454 | -0.61 | 3,123 | 1.20 | ||||
| 2025-08-14 | 13F | Mariner, LLC | 13,527 | 0.21 | 334 | 2.14 | ||||
| 2025-07-09 | 13F | Triumph Capital Management | 0 | -100.00 | 0 | |||||
| 2025-03-27 | NP | TCPTX - Transamerica ClearTrack 2045 R1 | 90,717 | 47.52 | 2,206 | 40.69 | ||||
| 2025-07-24 | 13F | IFP Advisors, Inc | 6,682 | -59.22 | 165 | -58.44 | ||||
| 2025-08-27 | 13F/A | Brinker Capital Investments, LLC | 43,780 | -3.89 | 1,081 | -2.17 | ||||
| 2025-07-14 | 13F | AdvisorNet Financial, Inc | 4,187 | 15.86 | 103 | 18.39 | ||||
| 2025-03-12 | 13F/A | Private Capital Management Llc | 11,560 | 0.00 | 269 | -1.83 | ||||
| 2025-08-08 | 13F | Pnc Financial Services Group, Inc. | 16,356 | 0.13 | 404 | 1.77 | ||||
| 2025-08-11 | 13F | Brown Brothers Harriman & Co | 2,780 | 69 | ||||||
| 2025-07-25 | 13F | Keener Financial Planning LLC | 406 | 99.02 | 0 | |||||
| 2025-05-15 | 13F | Wealth Management Nebraska | 0 | -100.00 | 0 | |||||
| 2025-07-07 | 13F | Upper Left Wealth Management, LLC | 8,331 | 206 | ||||||
| 2025-08-08 | 13F | Creative Planning | 245,241 | -1.10 | 6,057 | 0.68 | ||||
| 2025-08-08 | 13F | Larson Financial Group LLC | 33,349 | -20.27 | 824 | -18.84 | ||||
| 2025-08-12 | 13F | Horizon Financial Services, Llc | 2,016 | 1.36 | 50 | 2.08 | ||||
| 2025-07-17 | 13F | Heritage Investment Group, Inc. | 1,575,201 | 1.05 | 38,907 | 2.88 | ||||
| 2025-08-12 | 13F | CIBC Private Wealth Group, LLC | 68,060 | 11.58 | 1,681 | 27.74 | ||||
| 2025-08-19 | 13F/A | Pitcairn Co | 8,350 | 0.00 | 206 | 1.98 | ||||
| 2025-05-09 | 13F | GeoWealth Management, LLC | 0 | -100.00 | 0 | |||||
| 2025-05-02 | 13F/A | Voya Investment Management Llc | 0 | -100.00 | 0 | |||||
| 2025-07-29 | 13F | Private Wealth Management Group, LLC | 17,348 | -7.44 | 428 | -5.73 | ||||
| 2025-05-15 | 13F | Tower Research Capital LLC (TRC) | 0 | -100.00 | 0 | |||||
| 2025-08-13 | 13F | SageView Advisory Group, LLC | 2,951,690 | 10.82 | 73,025 | 13.02 | ||||
| 2025-07-18 | 13F | Naples Global Advisors, Llc | 287,456 | 7.75 | 7,100 | 9.70 | ||||
| 2025-08-14 | 13F | Murphy & Mullick Capital Management Corp | 420 | 0.00 | 10 | 0.00 | ||||
| 2025-05-15 | 13F | Macquarie Group Ltd | 0 | -100.00 | 0 | |||||
| 2025-08-14 | 13F | MidWestOne Financial Group, Inc. | 39,592 | -24.08 | 978 | -22.77 | ||||
| 2025-06-26 | NP | TCTZX - Transamerica ClearTrack Retirement Income R3 | 81,338 | 1,966 | ||||||
| 2025-08-04 | 13F | Pensionmark Financial Group, Llc | 315,973 | -2.54 | 7,805 | -0.78 | ||||
| 2025-07-09 | 13F | Parkside Advisors LLC | 11,206 | 277 | ||||||
| 2025-08-13 | 13F | IAG Wealth Partners, LLC | 3,584 | 0.00 | 89 | 2.33 | ||||
| 2025-08-12 | 13F | TCTC Holdings, LLC | 2,899 | 72 | ||||||
| 2025-07-24 | 13F | Lester Murray Antman dba SimplyRich | 169,422 | -4.02 | 4 | 0.00 | ||||
| 2025-07-22 | 13F | Simplicity Wealth,LLC | 33,293 | 19.92 | 822 | 22.14 | ||||
| 2025-08-04 | 13F | Capital Performance Advisors Llp | 40,993 | 0.03 | 1,013 | 1.81 | ||||
| 2025-08-12 | 13F | Ci Investments Inc. | 20,368 | -4.00 | 1 | |||||
| 2025-07-31 | 13F | Money Design Co.,Ltd. | 492,368 | -26.26 | 12 | -25.00 | ||||
| 2025-07-11 | 13F | Caldwell Securities, Inc | 143 | 0.00 | 4 | 0.00 | ||||
| 2025-08-13 | 13F | Hsbc Holdings Plc | 5,681,021 | 0.00 | 140,321 | 1.81 | ||||
| 2025-08-08 | 13F | Bailard, Inc. | 304,540 | 0.82 | 7,522 | 2.66 | ||||
| 2025-08-11 | 13F | Great Lakes Advisors, Llc | 115,379 | 3.68 | 2,850 | 5.56 | ||||
| 2025-08-14 | 13F | Warren Averett Asset Management, LLC | 69,517 | 0.00 | 1,717 | 1.84 | ||||
| 2025-08-14 | 13F | Ancora Advisors, LLC | 391 | 10 | ||||||
| 2025-07-16 | 13F | Diversified Enterprises, LLC | 0 | -100.00 | 0 | |||||
| 2025-07-28 | 13F | Rosenberg Matthew Hamilton | 1,902 | -0.99 | 47 | 0.00 | ||||
| 2025-07-01 | 13F | GP Brinson Investments LLC | 186,339 | 0.00 | 4,603 | 1.81 | ||||
| 2025-07-10 | 13F | Waypoint Wealth Partners Inc. | 39,050 | 0.00 | 965 | 1.80 | ||||
| 2025-07-17 | 13F | Emerald Advisors, LLC | 92,492 | 2.40 | 2,285 | 4.24 | ||||
| 2025-07-25 | 13F | Hazlett, Burt & Watson, Inc. | 100 | 0.00 | 0 | |||||
| 2025-08-13 | 13F | StoneX Group Inc. | 9,768 | 241 | ||||||
| 2025-07-28 | 13F | Morris Financial Concepts, Inc. | 50,484 | -1.31 | 1,247 | 0.40 | ||||
| 2025-08-12 | 13F | Jpmorgan Chase & Co | 56,246 | -5.58 | 1,389 | -3.88 | ||||
| 2025-08-04 | 13F | Creekmur Asset Management LLC | 0 | 0 | ||||||
| 2025-07-16 | 13F | St Germain D J Co Inc | 4,250 | 0.00 | 105 | 0.97 | ||||
| 2025-07-22 | 13F | Valley National Advisers Inc | 1,203 | -49.33 | 0 | |||||
| 2025-07-28 | 13F | Rik Saylor Financial, Inc. | 12,993 | -1.22 | 321 | 0.31 | ||||
| 2025-07-30 | 13F | Phillips Financial Management, Llc | 4,500 | 0.00 | 111 | 1.83 | ||||
| 2025-08-14 | 13F | City National Bank Of Florida /msd | 33,293 | 17.13 | 822 | 19.30 | ||||
| 2025-07-17 | 13F | ERn Financial, LLC | 412,357 | -0.16 | 10,185 | 1.66 | ||||
| 2025-08-14 | 13F | Partners Capital Investment Group, Llp | 1,338,032 | -57.80 | 33,049 | -57.04 | ||||
| 2025-03-27 | NP | TCTOX - Transamerica ClearTrack 2055 Class R1 | 11,877 | 73.31 | 289 | 65.52 | ||||
| 2025-08-07 | 13F | Gryphon Financial Partners LLC | 26,773 | 1.08 | 661 | 2.96 | ||||
| 2025-07-16 | 13F | Leading Edge Financial Planning LLC | 309,613 | -2.91 | 7,647 | -1.14 | ||||
| 2025-08-15 | 13F | Cornerstone Financial Group, LLC /NE/ | 76,635 | 6.76 | 1,893 | 7.20 | ||||
| 2025-07-16 | 13F | ORG Wealth Partners, LLC | 5,050 | 0.00 | 126 | 2.46 | ||||
| 2025-08-14 | 13F | Glenmede Investment Management, LP | 7,674 | 190 | ||||||
| 2025-08-07 | 13F | Parkside Financial Bank & Trust | 3,089 | 0.00 | 76 | 2.70 | ||||
| 2025-07-10 | 13F | Wealth Enhancement Advisory Services, Llc | 196,002 | -33.78 | 4,890 | -31.89 | ||||
| 2025-04-16 | 13F | Yoffe Investment Management, LLC | 0 | -100.00 | 0 | -100.00 | ||||
| 2025-08-26 | NP | Northern Lights Variable Trust - TOPS Managed Risk Balanced ETF Portfolio Class 2 shares | 83,475 | -3.10 | 2,062 | -1.34 | ||||
| 2025-04-30 | 13F | Sofos Investments, Inc. | 424 | 10 | ||||||
| 2025-07-29 | 13F | Private Trust Co Na | 1,171 | 0.00 | 29 | 0.00 | ||||
| 2025-07-24 | 13F | PDS Planning, Inc | 1,422,662 | 4.64 | 35,140 | 6.54 | ||||
| 2025-08-12 | 13F | Marshall & Sterling Wealth Advisors Inc. | 128 | 0.79 | 3 | 0.00 | ||||
| 2025-07-31 | 13F | Sage Mountain Advisors LLC | 3,731 | 0.00 | 92 | 2.22 | ||||
| 2025-07-15 | 13F | Regatta Capital Group, Llc | 10,230 | 0.00 | 253 | 1.61 | ||||
| 2025-08-13 | 13F | Cresset Asset Management, LLC | 29,310 | 4.78 | 724 | 6.64 | ||||
| 2025-08-26 | NP | Northern Lights Variable Trust - TOPS Managed Risk Growth ETF Portfolio Class 1 shares | 230,612 | -3.02 | 5,696 | -1.27 | ||||
| 2025-07-03 | 13F | Fiduciary Financial Group, Llc | 158,507 | 4.30 | 3,940 | 15.54 | ||||
| 2025-08-11 | 13F | Principal Securities, Inc. | 82 | -40.58 | 2 | -33.33 | ||||
| 2025-05-15 | 13F | Glenmede Trust Co Na | 574 | -89.87 | 14 | -90.37 | ||||
| 2025-08-05 | 13F | Mission Wealth Management, Lp | 15,764 | -6.43 | 389 | -4.66 | ||||
| 2025-08-12 | 13F | Global Retirement Partners, LLC | 5,568 | -32.06 | 138 | -30.10 | ||||
| 2025-08-14 | 13F | Archetype Wealth Partners | 129,737 | -5.24 | 3 | 0.00 | ||||
| 2025-08-14 | 13F | CoreCap Advisors, LLC | 9 | 0.00 | 0 | |||||
| 2025-07-31 | 13F | FSM Wealth Advisors, LLC | 430,419 | 26.94 | 10,649 | 29.46 | ||||
| 2025-08-14 | 13F | Wells Fargo & Company/mn | 716,662 | -0.35 | 17,702 | 1.46 | ||||
| 2025-08-06 | 13F | Mark Sheptoff Financial Planning, Llc | 126 | 0.00 | 3 | 0.00 | ||||
| 2025-08-11 | 13F | Citigroup Inc | 5,533 | 5.96 | 137 | 7.94 | ||||
| 2025-07-15 | 13F | Ballentine Partners, LLC | 10,714 | -4.72 | 265 | -2.94 | ||||
| 2025-08-15 | 13F | Equitable Holdings, Inc. | 19,470 | 0.00 | 481 | 1.69 | ||||
| 2025-03-27 | NP | TRNTX - Transamerica ClearTrack 2050 R1 | 69,420 | 29.37 | 1,688 | 23.39 | ||||
| 2025-07-24 | 13F | Comprehensive Money Management Services LLC | 29,389 | -5.54 | 726 | -3.85 | ||||
| 2025-08-05 | 13F | Clarity Wealth Development LLC | 10,965 | 4.59 | 271 | 6.72 | ||||
| 2025-07-16 | 13F/A | CX Institutional | 574 | 0.00 | 0 | |||||
| 2025-08-11 | 13F | TD Waterhouse Canada Inc. | 40,855 | 9.13 | 1,014 | 11.67 | ||||
| 2025-08-12 | 13F | EFG Asset Management (Americas) Corp. | 8,144 | 201 | ||||||
| 2025-05-05 | 13F | Wealth Alliance | 0 | -100.00 | 0 | |||||
| 2025-07-29 | 13F | Chicago Partners Investment Group LLC | 23,443 | 0.61 | 592 | 4.04 | ||||
| 2025-07-30 | 13F | Whittier Trust Co | 9,000 | 0.00 | 222 | 1.83 | ||||
| 2025-05-29 | NP | SIIIX - AlphaCentric Strategic Income Fund Class I | 0 | -100.00 | 0 | -100.00 | ||||
| 2025-08-26 | NP | Northern Lights Variable Trust - TOPS Conservative ETF Portfolio Class 1 shares | 16,731 | 0.00 | 413 | 1.98 | ||||
| 2025-05-14 | 13F | Kestra Advisory Services, LLC | 0 | -100.00 | 0 | |||||
| 2025-07-15 | 13F | Garrett Investment Advisors LLC | 15,892 | 393 | ||||||
| 2025-08-14 | 13F | Bank Of America Corp /de/ | 1,053,734 | 42.14 | 26,027 | 44.72 | ||||
| 2025-08-26 | NP | Northern Lights Variable Trust - TOPS Managed Risk Flex ETF Portfolio | 184,001 | -4.78 | 4,545 | -3.07 | ||||
| 2025-07-22 | 13F | Sava Infond d.o.o. | 800 | 0.00 | 20 | 0.00 | ||||
| 2025-05-16 | 13F | Signature Estate & Investment Advisors Llc | 0 | -100.00 | 0 | |||||
| 2025-08-11 | 13F | Comprehensive Wealth Management, LLC | 26,241 | 648 | ||||||
| 2025-08-05 | 13F | Claro Advisors LLC | 9,608 | -25.57 | 237 | -24.28 | ||||
| 2025-07-10 | 13F | Cypress Point Wealth Management, LLC | 8,434 | -8.72 | 208 | -7.14 | ||||
| 2025-07-30 | 13F | Exencial Wealth Advisors, Llc | 72,162 | -8.36 | 1,782 | -6.70 | ||||
| 2025-07-08 | 13F | Parallel Advisors, LLC | 1,057 | -38.55 | 26 | -36.59 | ||||
| 2025-08-14 | 13F | Oxford Financial Group Ltd | 56,352 | 1.33 | 1,392 | 3.11 | ||||
| 2025-08-13 | 13F | Jones Financial Companies Lllp | 61,945 | 48.36 | 1,523 | 51.14 | ||||
| 2025-05-14 | 13F | Crossingbridge Advisors, LLC | 0 | -100.00 | 0 | |||||
| 2025-07-11 | 13F | International Private Wealth Advisors LLC | 10,437 | 4.00 | 258 | 5.76 | ||||
| 2025-08-01 | 13F | SYM FINANCIAL Corp | 948 | -32.91 | 23 | -32.35 | ||||
| 2025-08-06 | 13F | Vestmark Advisory Solutions, Inc. | 315,531 | -5.82 | 7,794 | -4.11 | ||||
| 2025-07-09 | 13F | Breakwater Investment Management | 4,879 | -4.24 | 121 | -2.44 | ||||
| 2025-08-13 | 13F | First National Advisers, LLC | 58,100 | 0.00 | 1,435 | 1.85 | ||||
| 2025-03-27 | NP | TCFTX - Transamerica ClearTrack 2015 R1 | 358 | -98.14 | 9 | -98.37 | ||||
| 2025-07-15 | 13F | Compagnie Lombard Odier SCmA | 10,200 | 0.00 | 252 | 1.62 | ||||
| 2025-07-16 | 13F | Twelve Points Wealth Management LLC | 20,235 | 5.57 | 500 | 7.31 | ||||
| 2025-08-14 | 13F | Sterling Wealth Management, Inc. | 36,838 | -7.36 | 910 | -4.62 | ||||
| 2025-08-14 | 13F | Fiduciary Trust Co | 0 | -100.00 | 0 | |||||
| 2025-07-21 | 13F | Quent Capital, LLC | 508,202 | 3.94 | 12,553 | 5.83 | ||||
| 2025-08-12 | 13F | Cooper/haims Advisors, Llc | 517,646 | 3.70 | 12,786 | 5.57 | ||||
| 2025-08-15 | 13F | Harvest Fund Management Co., Ltd | 11,400 | 0 |