Mga Batayang Estadistika
| Pemilik Institusional | 279 total, 279 long only, 0 short only, 0 long/short - change of 6.90% MRQ |
| Alokasi Portofolio Rata-rata | 0.9343 % - change of -3.28% MRQ |
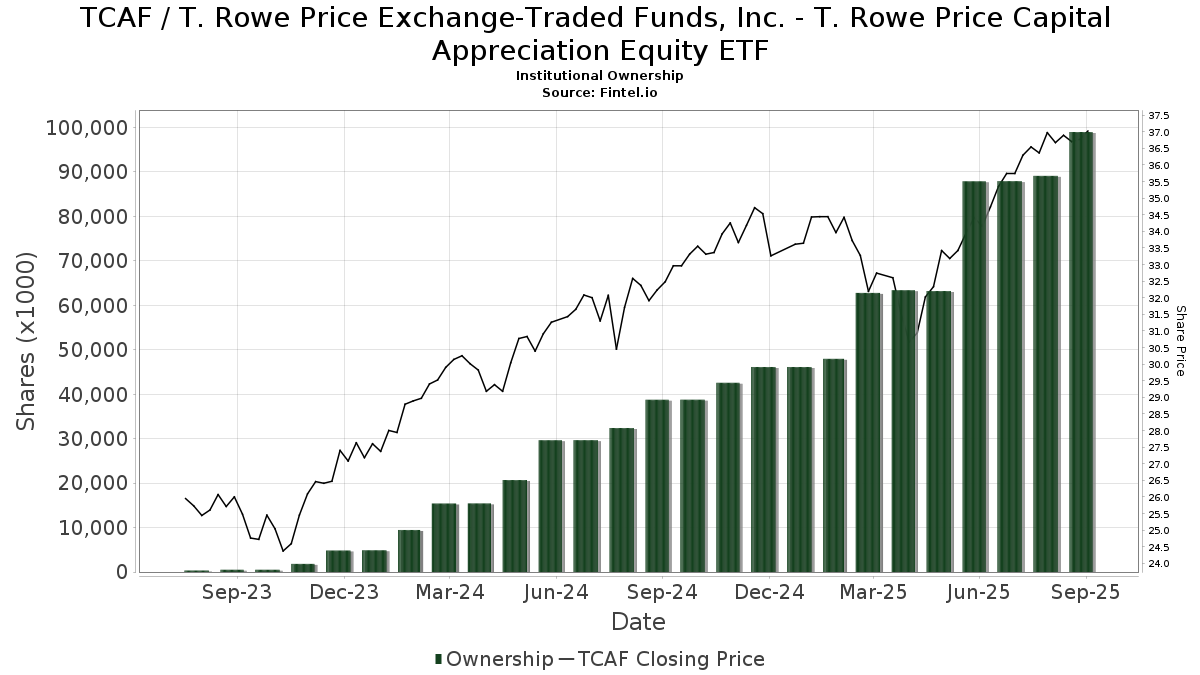
| Saham Institusional (Jangka Panjang) | 98,991,123 (ex 13D/G) - change of 11.07MM shares 12.59% MRQ |
| Nilai Institusional (Jangka Panjang) | $ 2,682,532 USD ($1000) |
Kepemilikan Institusional dan Pemegang Saham
T. Rowe Price Exchange-Traded Funds, Inc. - T. Rowe Price Capital Appreciation Equity ETF (US:TCAF) memiliki 279 pemilik institusional dan pemegang saham yang telah mengajukan formulir 13D/G atau 13F kepada Komisi Bursa Efek (Securities Exchange Commission/SEC). Lembaga-lembaga ini memegang total 98,991,123 saham. Pemegang saham terbesar meliputi Price T Rowe Associates Inc /md/, LPL Financial LLC, Raymond James Financial Inc, Commonwealth Equity Services, Llc, Advisor Group Holdings, Inc., Morgan Stanley, Voya Investment Management Llc, Baird Financial Group, Inc., Wells Fargo & Company/mn, and Royal Bank Of Canada .
Struktur kepemilikan institusional T. Rowe Price Exchange-Traded Funds, Inc. - T. Rowe Price Capital Appreciation Equity ETF (ARCA:TCAF) menunjukkan posisi terkini di perusahaan oleh institusi dan dana, serta perubahan terbaru dalam ukuran posisi. Pemegang saham utama dapat mencakup investor individu, reksa dana, dana lindung nilai, atau institusi. Jadwal 13D menunjukkan bahwa investor memegang (atau pernah memegang) lebih dari 5% saham perusahaan dan bermaksud (atau pernah bermaksud) untuk secara aktif mengejar perubahan strategi bisnis. Jadwal 13G menunjukkan investasi pasif lebih dari 5%.
The share price as of September 5, 2025 is 36.72 / share. Previously, on September 6, 2024, the share price was 31.37 / share. This represents an increase of 17.05% over that period.
Skor Sentimen Dana
Skor Sentimen Dana (sebelumnya dikenal sebagai Skor Akumulasi Kepemilikan) menemukan saham-saham yang paling banyak dibeli oleh dana. Ini adalah hasil dari model kuantitatif multi-faktor yang canggih yang mengidentifikasi perusahaan dengan tingkat akumulasi institusional tertinggi. Model penilaian menggunakan kombinasi dari total peningkatan pemilik yang diungkapkan, perubahan dalam alokasi portofolio pada pemilik tersebut, dan metrik lainnya. Angka berkisar dari 0 hingga 100, dengan angka yang lebih tinggi menunjukkan tingkat akumulasi yang lebih tinggi dibandingkan dengan perusahaan sejenisnya, dan 50 adalah rata-ratanya.
Frekuensi Pembaruan: Setiap Hari
Lihat Ownership Explorer, yang menyediakan daftar perusahaan dengan peringkat tertinggi.
Rasio Put/Call Institusional
Selain melaporkan isu ekuitas dan utang standar, institusi dengan aset di bawah manajemen lebih dari 100 juta dolar AS juga harus mengungkapkan kepemilikan opsi put dan call mereka. Karena opsi put umumnya menunjukkan sentimen negatif, dan opsi call menunjukkan sentimen positif, kita dapat mengetahui sentimen institusional secara keseluruhan dengan memplot rasio put terhadap call. Grafik di sebelah kanan memplot rasio put/call historis untuk instrumen ini.
Menggunakan Rasio Put/Call sebagai indikator sentimen investor mengatasi salah satu kekurangan utama dari penggunaan total kepemilikan institusional, yaitu sejumlah besar aset yang dikelola diinvestasikan secara pasif untuk melacak indeks. Dana yang dikelola secara pasif biasanya tidak membeli opsi, sehingga indikator rasio put/call lebih akurat dalam melacak sentimen dana yang dikelola secara aktif.
Pengajuan 13F dan NPORT
Detail pada pengajuan 13F tersedia gratis. Detail pada pengajuan NP memerlukan keanggotaan premium. Baris berwarna hijau menunjukkan posisi baru. Baris berwarna merah menunjukkan posisi yang sudah ditutup. Klik tautan ini ikon untuk melihat riwayat transaksi selengkapnya.
Tingkatkan
untuk membuka data premium dan mengekspor ke Excel ![]() .
.
| Tanggal File | Sumber | Investor | Ketik | Presyo ng Avg (Silangan) |
Saham | Δ Saham (%) |
Dilaporkan Nilai ($1000) |
Nilai Δ (%) |
Alokasi Port (%) |
|
|---|---|---|---|---|---|---|---|---|---|---|
| 2025-08-01 | 13F | Liberty Wealth Management Llc | 109,914 | 0.14 | 3,878 | 9.37 | ||||
| 2025-08-05 | 13F | Plante Moran Financial Advisors, LLC | 0 | -100.00 | 0 | |||||
| 2025-08-14 | 13F | Hrt Financial Lp | 0 | -100.00 | 0 | |||||
| 2025-07-17 | 13F | Janney Montgomery Scott LLC | 397,391 | 3.86 | 14 | 16.67 | ||||
| 2025-07-29 | 13F | Stratos Wealth Partners, LTD. | 103,040 | 17.49 | 3,635 | 28.40 | ||||
| 2025-07-14 | 13F | Southland Equity Partners LLC | 134,514 | 1.28 | 4,746 | 10.68 | ||||
| 2025-08-04 | 13F | 4J Wealth Management LLC | 254,467 | 1.12 | 8,978 | 10.51 | ||||
| 2025-08-13 | 13F | Legacy Capital Wealth Partners, LLC | 48,587 | -2.16 | 1,714 | 6.92 | ||||
| 2025-07-24 | 13F | Financial Connections Group, Inc. | 3,501 | 0.00 | 0 | |||||
| 2025-07-29 | 13F | Wingate Wealth Advisors, Inc. | 88,772 | -2.97 | 3,132 | 6.03 | ||||
| 2025-07-25 | 13F | Envestnet Portfolio Solutions, Inc. | 29,395 | -40.54 | 1,037 | -34.98 | ||||
| 2025-08-08 | 13F | Cetera Investment Advisers | 777,031 | 12.89 | 27,414 | 23.38 | ||||
| 2025-07-10 | 13F | ARS Wealth Advisors Group, LLC | 319,889 | 18.94 | 11,286 | 30.00 | ||||
| 2025-05-13 | 13F | Freestone Capital Holdings, LLC | 0 | -100.00 | 0 | |||||
| 2025-08-14 | 13F | UBS Group AG | 679,837 | 38.10 | 23,985 | 50.94 | ||||
| 2025-07-30 | 13F | Roman Butler Fullerton & Co | 13,495 | 42.08 | 495 | 67.23 | ||||
| 2025-07-28 | 13F | Holistic Planning, LLC | 12,649 | 446 | ||||||
| 2025-08-14 | 13F | Raymond James Financial Inc | 5,351,355 | 19.28 | 188,796 | 30.37 | ||||
| 2025-08-05 | 13F | Tsfg, Llc | 17,737 | 0.00 | 1 | |||||
| 2025-08-06 | 13F | Souders Financial Advisors | 726,645 | 14.39 | 25,636 | 25.03 | ||||
| 2025-08-12 | 13F | MAI Capital Management | 48,527 | -5.94 | 1,712 | 2.82 | ||||
| 2025-07-15 | 13F | Cora Capital Advisors Llc | 812,962 | 2.58 | 28,681 | 12.11 | ||||
| 2025-07-22 | 13F | Gutierrez Wealth Advisory, LLC | 17,585 | 39.50 | 620 | 52.71 | ||||
| 2025-07-10 | 13F | Exchange Traded Concepts, Llc | 165,726 | 24.53 | 5,847 | 36.11 | ||||
| 2025-07-28 | 13F | Sagespring Wealth Partners, Llc | 19,388 | -0.79 | 684 | 8.57 | ||||
| 2025-07-09 | 13F | Lincoln Capital Corp | 77,134 | 3.15 | 2,721 | 12.76 | ||||
| 2025-08-07 | 13F | Flagship Wealth Advisors, Llc | 16,638 | 0.00 | 587 | 9.12 | ||||
| 2025-05-16 | 13F/A | Goldman Sachs Group Inc | 0 | -100.00 | 0 | -100.00 | ||||
| 2025-07-18 | 13F | Parsons Capital Management Inc/ri | 320,407 | -0.17 | 11,304 | 9.10 | ||||
| 2025-07-29 | 13F | Stratos Wealth Advisors, LLC | 160,080 | 2.52 | 5,648 | 12.04 | ||||
| 2025-08-08 | 13F | Wealth Alliance | 25,392 | 37.92 | 896 | 50.67 | ||||
| 2025-08-05 | 13F | Carson Advisory Inc. | 165,144 | 3.14 | 5,826 | 12.73 | ||||
| 2025-08-18 | 13F | Geneos Wealth Management Inc. | 1,595 | 243.01 | 56 | 273.33 | ||||
| 2025-08-11 | 13F | Lighthouse Financial LLC | 99,619 | 12.53 | 3,515 | 23.00 | ||||
| 2025-07-11 | 13F | SILVER OAK SECURITIES, Inc | 0 | -100.00 | 0 | |||||
| 2025-07-21 | 13F | Pacific Financial Group Inc | 6,057 | 214 | ||||||
| 2025-08-14 | 13F | Ameriprise Financial Inc | 6,510 | -64.12 | 230 | -60.85 | ||||
| 2025-07-14 | 13F | CJM Wealth Advisers, Ltd. | 46,515 | -1.85 | 1,641 | 7.33 | ||||
| 2025-07-11 | 13F | Ttp Investments, Inc. | 1,653,432 | 50.56 | 58,333 | 64.56 | ||||
| 2025-07-15 | 13F | McCarthy & Cox | 1,026,419 | 1.03 | 36,212 | 10.42 | ||||
| 2025-08-11 | 13F | Forge Financial Services LLC | 290,328 | 15.49 | 10,344 | 27.48 | ||||
| 2025-07-25 | 13F | Apollon Wealth Management, LLC | 15,071 | 532 | ||||||
| 2025-07-21 | 13F | Ameriflex Group, Inc. | 1,850 | -78.09 | 65 | -76.47 | ||||
| 2025-08-04 | 13F | Flagship Harbor Advisors, Llc | 14,455 | 34.13 | 510 | 46.69 | ||||
| 2025-08-14 | 13F | Susquehanna International Group, Llp | 0 | -100.00 | 0 | |||||
| 2025-07-10 | 13F | Wealth Enhancement Advisory Services, Llc | 1,779,596 | 5.68 | 63,389 | 16.61 | ||||
| 2025-07-21 | 13F | Tanglewood Wealth Management, Inc. | 127,588 | 3.78 | 4,501 | 13.43 | ||||
| 2025-08-12 | 13F/A | Cozad Asset Management Inc | 20,978 | 30.76 | 740 | 43.13 | ||||
| 2025-08-15 | 13F | Captrust Financial Advisors | 215,602 | 301.24 | 7,606 | 338.64 | ||||
| 2025-08-11 | 13F | Western Wealth Management, LLC | 10,620 | 375 | ||||||
| 2025-07-24 | 13F | Us Bancorp \de\ | 221 | 8 | ||||||
| 2025-07-18 | 13F | Consolidated Planning Corp | 1,355,981 | -1.46 | 47,839 | 7.69 | ||||
| 2025-07-24 | 13F | MSH Capital Advisors LLC | 19,881 | -6.75 | 701 | 1.89 | ||||
| 2025-08-14 | 13F | Mercer Global Advisors Inc /adv | 77,955 | 7.06 | 2,750 | 17.02 | ||||
| 2025-08-08 | 13F | Comprehensive Financial Planning, Inc./PA | 21,335 | 4.40 | 753 | 14.11 | ||||
| 2025-07-22 | 13F | Beacon Financial Advisory LLC | 205,303 | 16.14 | 7,243 | 26.94 | ||||
| 2025-08-05 | 13F | Atlas Wealth LLC | 92,197 | 121.20 | 3,250 | 141.56 | ||||
| 2025-08-12 | 13F | LPL Financial LLC | 10,728,693 | 22.05 | 378,508 | 33.40 | ||||
| 2025-08-13 | 13F | Ted Buchan & Co | 10,082 | 0.00 | 356 | 9.23 | ||||
| 2025-07-11 | 13F | Diversified Trust Co | 89,748 | 3,166 | ||||||
| 2025-07-30 | 13F | Studio Investment Management Llc | 32,144 | 0.26 | 1,134 | 9.67 | ||||
| 2025-08-06 | 13F | Prospera Financial Services Inc | 337,087 | 0.65 | 11,899 | 10.00 | ||||
| 2025-07-14 | 13F | Harbor Group, Inc. | 40,697 | 165.85 | 1,436 | 190.49 | ||||
| 2025-08-13 | 13F | Capital Analysts, Inc. | 283,743 | 85.98 | 10 | 150.00 | ||||
| 2025-08-14 | 13F | London & Capital Asset Management Ltd | 10,101 | 356 | ||||||
| 2025-07-11 | 13F | Compass Ion Advisors, LLC | 79,621 | -11.02 | 2,809 | -2.74 | ||||
| 2025-08-06 | 13F | Centerpoint Advisory Group | 97,734 | 2.87 | 3,448 | 12.46 | ||||
| 2025-08-12 | 13F | XTX Topco Ltd | 6,637 | 234 | ||||||
| 2025-08-05 | 13F | GPS Wealth Strategies Group, LLC | 3,573 | 51.33 | 126 | 65.79 | ||||
| 2025-08-08 | 13F | Tortoise Investment Management, LLC | 1,014 | 0.00 | 36 | 9.38 | ||||
| 2025-08-13 | 13F | CMC Financial Group | 13,892 | -3.34 | 490 | 5.83 | ||||
| 2025-08-14 | 13F | Wells Fargo & Company/mn | 2,600,129 | -8.34 | 91,733 | 0.18 | ||||
| 2025-08-14 | 13F | Gotham Asset Management, LLC | 22,730 | 0.00 | 802 | 9.28 | ||||
| 2025-08-06 | 13F | Mark Sheptoff Financial Planning, Llc | 89 | 0.00 | 3 | 50.00 | ||||
| 2025-08-05 | 13F | Strategic Financial Concepts, LLC | 105,671 | 8.12 | 3,728 | 18.20 | ||||
| 2025-08-11 | 13F | Annis Gardner Whiting Capital Advisors, LLC | 9,936 | 0.65 | 351 | 10.06 | ||||
| 2025-07-11 | 13F | Bond & Devick Financial Network, Inc. | 5,847 | 206 | ||||||
| 2025-07-17 | 13F | ERn Financial, LLC | 0 | -100.00 | 0 | |||||
| 2025-08-13 | 13F | Per Stirling Capital Management, LLC. | 27,513 | -27.81 | 971 | -21.14 | ||||
| 2025-08-14 | 13F | Comerica Bank | 60,657 | -1.56 | 2,140 | 7.54 | ||||
| 2025-07-29 | 13F | Private Trust Co Na | 14,661 | 14.65 | 517 | 25.49 | ||||
| 2025-08-14 | 13F | Modern Wealth Management, LLC | 1,278,309 | 1.15 | 45,099 | 10.55 | ||||
| 2025-04-25 | 13F | Verity Asset Management, Inc. | 0 | -100.00 | 0 | |||||
| 2025-07-24 | 13F | Financial Security Advisor, Inc. | 172,742 | -1.29 | 6,094 | 7.90 | ||||
| 2025-07-14 | 13F | CRA Financial Services, LLC | 62,642 | 9.96 | 2,210 | 20.24 | ||||
| 2025-07-25 | 13F | Hazlett, Burt & Watson, Inc. | 17,440 | 6,359.26 | 1 | |||||
| 2025-08-19 | 13F | Advisory Services Network, LLC | 129,390 | 4.24 | 4,741 | 18.32 | ||||
| 2025-07-25 | 13F | Northwest Capital Management Inc | 0 | -100.00 | 0 | |||||
| 2025-08-05 | 13F | Atlas Wealth Partners, LLC | 8,193 | -4.65 | 0 | |||||
| 2025-08-14 | 13F | Warren Averett Asset Management, LLC | 260,137 | 3.53 | 9,178 | 13.16 | ||||
| 2025-05-01 | 13F | Iron Horse Wealth Management, LLC | 0 | -100.00 | 0 | |||||
| 2025-07-29 | 13F | Arcus Capital Partners, LLC | 311,329 | -27.98 | 10,984 | -21.29 | ||||
| 2025-08-08 | 13F | Sittner & Nelson, Llc | 22,359 | 17.83 | 789 | 28.76 | ||||
| 2025-08-14 | 13F | Jane Street Group, Llc | 26,199 | 924 | ||||||
| 2025-08-14 | 13F | Voya Investment Management Llc | 2,762,859 | -0.79 | 97,474 | 8.43 | ||||
| 2025-08-08 | 13F | Avantax Advisory Services, Inc. | 44,651 | 56.35 | 1,575 | 71.01 | ||||
| 2025-08-11 | 13F | United Advisor Group, LLC | 21,617 | 232.06 | 763 | 262.86 | ||||
| 2025-08-13 | 13F | Baird Financial Group, Inc. | 2,725,494 | 7.71 | 96,155 | 17.72 | ||||
| 2025-08-11 | 13F | Principal Securities, Inc. | 48,958 | -2.92 | 1,727 | 2.98 | ||||
| 2025-08-06 | 13F | Legacy Investment Solutions, LLC | 677 | 0.00 | 24 | 0.00 | ||||
| 2025-08-06 | 13F | Wedbush Securities Inc | 74,465 | 11.58 | 3 | 0.00 | ||||
| 2025-07-07 | 13F | OMNI 360 Wealth, Inc. | 33,434 | 15.22 | 1,180 | 25.96 | ||||
| 2025-07-25 | 13F | Atria Wealth Solutions, Inc. | 379,262 | 15.04 | 13,498 | 26.84 | ||||
| 2025-07-21 | 13F | Ameritas Advisory Services, LLC | 4,945 | -56.89 | 174 | -53.60 | ||||
| 2025-08-14 | 13F | Sunbelt Securities, Inc. | 56,618 | 4.65 | 1,884 | 7.85 | ||||
| 2025-08-27 | NP | JNL SERIES TRUST - JNL iShares Tactical Moderate Fund (A) | 288,076 | 0.03 | 10,163 | 9.33 | ||||
| 2025-08-14 | 13F | Guardian Wealth Advisors, Llc / Nc | 12,285 | 0.00 | 433 | 9.34 | ||||
| 2025-07-16 | 13F | Essex Financial Services, Inc. | 147,281 | 15.72 | 5,196 | 26.48 | ||||
| 2025-08-14 | 13F/A | Rockefeller Capital Management L.P. | 319,921 | 6.61 | 11,287 | 16.51 | ||||
| 2025-08-08 | 13F | Pnc Financial Services Group, Inc. | 233 | 8 | ||||||
| 2025-08-07 | 13F | Allworth Financial LP | 269,620 | 1.93 | 9,512 | 13.77 | ||||
| 2025-08-12 | 13F | Weaver Consulting Group | 51,021 | 11.72 | 1,800 | 22.12 | ||||
| 2025-07-15 | 13F | DKM Wealth Management, Inc. | 387,863 | -1.51 | 13,684 | 7.65 | ||||
| 2025-07-25 | 13F | Concurrent Investment Advisors, LLC | 61,446 | 96.71 | 2,168 | 114.98 | ||||
| 2025-07-22 | 13F | Macroview Investment Management Llc | 15,972 | -1.41 | 563 | 7.85 | ||||
| 2025-07-21 | 13F | Warner Financial, Inc | 34,804 | 0.10 | 1 | 0.00 | ||||
| 2025-07-30 | 13F | Strategic Blueprint, LLC | 6,725 | -56.31 | 237 | -52.22 | ||||
| 2025-08-08 | 13F | Good Life Advisors, LLC | 83,999 | -4.94 | 2,963 | 3.89 | ||||
| 2025-07-31 | 13F | Cambridge Investment Research Advisors, Inc. | 1,765,583 | 6.11 | 62 | 16.98 | ||||
| 2025-08-14 | 13F | NCM Capital Management, LLC | 169,122 | 12.82 | 5,974 | 23.46 | ||||
| 2025-08-14 | 13F | Colony Group, LLC | 20,733 | 731 | ||||||
| 2025-08-15 | 13F | CI Private Wealth, LLC | 191,700 | 128.98 | 6,763 | 150.30 | ||||
| 2025-08-04 | 13F | IFG Advisory, LLC | 299,794 | 505.22 | 10,577 | 561.83 | ||||
| 2025-08-14 | 13F | D. E. Shaw & Co., Inc. | 7,856 | 277 | ||||||
| 2025-08-14 | 13F | Benjamin Edwards Inc | 62,019 | 511.99 | 2,188 | 569.11 | ||||
| 2025-08-11 | 13F | Aptus Capital Advisors, LLC | 12,360 | -0.20 | 436 | 9.27 | ||||
| 2025-04-23 | 13F | Creative Financial Designs Inc /adv | 0 | -100.00 | 0 | |||||
| 2025-07-22 | 13F | Confluence Wealth Services, Inc. | 6,615 | 233 | ||||||
| 2025-07-16 | 13F | Beaumont Financial Advisors, LLC | 551,269 | -2.94 | 19,449 | 6.08 | ||||
| 2025-08-13 | 13F | Certior Financial Group, Llc | 209,668 | 6.12 | 7,397 | 15.99 | ||||
| 2025-08-04 | 13F | Pensionmark Financial Group, Llc | 231,101 | 11.36 | 8,153 | 21.70 | ||||
| 2025-07-23 | 13F | GGM Financials LLC | 0 | -100.00 | 0 | |||||
| 2025-08-12 | 13F | J.w. Cole Advisors, Inc. | 43,884 | 83.98 | 1,548 | 101.30 | ||||
| 2025-07-25 | 13F | Priebe Wealth Holdings LLC | 16,300 | -8.43 | 575 | 0.17 | ||||
| 2025-08-05 | 13F | Carolinas Wealth Consulting Llc | 0 | -100.00 | 0 | -100.00 | ||||
| 2025-08-07 | 13F | Summit Asset Management, LLC | 6,981 | 0.00 | 246 | 9.33 | ||||
| 2025-07-18 | 13F | Truist Financial Corp | 81,822 | 7.92 | 2,887 | 17.94 | ||||
| 2025-05-01 | 13F | Grant/GrossMendelsohn, LLC | 248,089 | -9.19 | 7,879 | -13.30 | ||||
| 2025-07-22 | 13F | Miracle Mile Advisors, LLC | 358,277 | 12.04 | 12,640 | 22.46 | ||||
| 2025-08-14 | 13F | Marathon Capital Management | 8,775 | -9.30 | 310 | -0.96 | ||||
| 2025-08-15 | 13F | Kestra Advisory Services, LLC | 467,657 | 87.19 | 16,499 | 104.59 | ||||
| 2025-07-10 | 13F | Redhawk Wealth Advisors, Inc. | 41,365 | -0.33 | 1,459 | 8.96 | ||||
| 2025-07-17 | 13F | Sfm, Llc | 102,166 | 0.08 | 3,604 | 9.38 | ||||
| 2025-08-12 | 13F | Winnow Wealth Llc | 3,450 | 122 | ||||||
| 2025-07-23 | 13F | Capital Management Associates, Inc | 5,818 | 205 | ||||||
| 2025-08-14 | 13F | Qube Research & Technologies Ltd | 39,632 | 1,398 | ||||||
| 2025-07-17 | 13F | Patton Albertson Miller Group, Llc | 141,589 | -0.38 | 4,995 | 8.87 | ||||
| 2025-08-27 | NP | JNL SERIES TRUST - JNL iShares Tactical Moderate Growth Fund (I) | 659,779 | -0.16 | 23,277 | 9.12 | ||||
| 2025-08-08 | 13F | Fortis Group Advisors, LLC | 190,943 | -44.11 | 6,996 | -36.57 | ||||
| 2025-07-18 | 13F | Midwest Financial Group LLC | 11,344 | 29.56 | 400 | 41.84 | ||||
| 2025-07-30 | 13F | Schaper Benz & Wise Investment Counsel Inc/wi | 29,595 | 11.51 | 1,044 | 21.96 | ||||
| 2025-08-08 | 13F | Thoroughbred Financial Services, Llc | 90,911 | 63.98 | 3 | 200.00 | ||||
| 2025-07-29 | 13F | AssuredPartners Investment Advisors, LLC | 6,012 | 212 | ||||||
| 2025-07-30 | 13F | Bogart Wealth, LLC | 500 | 0.00 | 18 | 6.25 | ||||
| 2025-08-13 | 13F | Harfst & Associates, Inc. | 310,372 | 148.31 | 10,950 | 171.42 | ||||
| 2025-08-06 | 13F | Bensler, LLC | 9,067 | 320 | ||||||
| 2025-07-24 | 13F | Eastern Bank | 397,629 | 4.44 | 14,028 | 14.14 | ||||
| 2025-08-08 | 13F | MTM Investment Management, LLC | 288,967 | 35.61 | 10,195 | 47.65 | ||||
| 2025-08-18 | 13F | N.E.W. Advisory Services LLC | 28,643 | 1,011 | ||||||
| 2025-04-22 | 13F | World Equity Group, Inc. | 0 | -100.00 | 0 | |||||
| 2025-07-10 | 13F | High Net Worth Advisory Group LLC | 73,101 | -0.68 | 2,579 | 8.59 | ||||
| 2025-08-14 | 13F | GWM Advisors LLC | 89,066 | 4.76 | 3,142 | 14.50 | ||||
| 2025-07-11 | 13F | Sprinkle Financial Consultants LLC | 114,722 | 31.43 | 4,047 | 43.66 | ||||
| 2025-08-05 | 13F | Dahring | Cusmano Llc | 73,875 | -0.40 | 2,606 | 8.86 | ||||
| 2025-08-12 | 13F | OneAscent Financial Services LLC | 24,085 | 116.92 | 1 | |||||
| 2025-08-11 | 13F | Private Advisor Group, LLC | 577,628 | 7.28 | 20,379 | 17.26 | ||||
| 2025-08-13 | 13F | Keystone Financial Group | 240,362 | 7.23 | 8,480 | 17.19 | ||||
| 2025-08-06 | 13F | ORBA Wealth Advisors, L.L.C. | 54,138 | -47.67 | 1,910 | -42.83 | ||||
| 2025-07-01 | 13F | Private Client Services, Llc | 8,422 | -0.24 | 297 | 9.19 | ||||
| 2025-08-12 | 13F | Argent Trust Co | 13,768 | 16.23 | 486 | 26.96 | ||||
| 2025-08-14 | 13F | Aqr Capital Management Llc | 9,400 | 332 | ||||||
| 2025-07-24 | 13F | Jfs Wealth Advisors, Llc | 12,750 | 8.51 | 450 | 18.47 | ||||
| 2025-08-13 | 13F | WCG Wealth Advisors LLC | 128,687 | 33.67 | 4,540 | 46.12 | ||||
| 2025-05-15 | 13F | National Wealth Management Group, LLC | 317,222 | 5.56 | 10,240 | 2.42 | ||||
| 2025-07-30 | 13F | Principle Wealth Partners Llc | 334,480 | 1.64 | 11,800 | 11.09 | ||||
| 2025-08-18 | 13F | Tyler-Stone Wealth Management | 5,681 | 200 | ||||||
| 2025-08-12 | 13F | Ade, Llc | 509,206 | 4.16 | 17,965 | 13.83 | ||||
| 2025-08-04 | 13F | Mayflower Financial Advisors, LLC | 37,804 | 0.00 | 1,334 | 9.26 | ||||
| 2025-07-17 | 13F | Presper Financial Architects, LLC | 140,321 | 5 | ||||||
| 2025-08-07 | 13F | Kestra Private Wealth Services, Llc | 16,147 | 570 | ||||||
| 2025-08-14 | 13F | PYA Waltman Capital, LLC | 723,196 | 2.90 | 25,514 | 12.46 | ||||
| 2025-07-17 | 13F | Eclectic Associates Inc /adv | 99,765 | 38.12 | 3,520 | 50.97 | ||||
| 2025-08-08 | 13F | Capital Investment Advisory Services, LLC | 89,271 | 41.14 | 3,149 | 54.29 | ||||
| 2025-07-31 | 13F | Glass Jacobson Investment Advisors llc | 1,250 | 3.39 | 44 | 10.00 | ||||
| 2025-08-19 | 13F | Cape Investment Advisory, Inc. | 138 | 0.00 | 5 | 0.00 | ||||
| 2025-08-14 | 13F | Menora Mivtachim Holdings Ltd. | 325,727 | 54.36 | 11,492 | 68.71 | ||||
| 2025-08-04 | 13F | Northwest Financial Advisors | 15,606 | -7.17 | 551 | 1.48 | ||||
| 2025-08-05 | 13F | Sigma Planning Corp | 89,730 | 12.91 | 3,166 | 23.39 | ||||
| 2025-07-15 | 13F | Aspire Capital Advisors LLC | 7,125 | 251 | ||||||
| 2025-08-14 | 13F | Garden State Investment Advisory Services LLC | 206,666 | -6.91 | 7,295 | 1.73 | ||||
| 2025-07-28 | 13F | WealthPLAN Partners, LLC | 75,266 | 2.04 | 2,655 | 11.55 | ||||
| 2025-08-13 | 13F | Brown Advisory Inc | 6,124 | 216 | ||||||
| 2025-08-14 | 13F | Bank Of America Corp /de/ | 1,210,150 | 10.79 | 42,694 | 21.09 | ||||
| 2025-08-04 | 13F | Mesirow Financial Investment Management, Inc. | 973,312 | 10.28 | 34,339 | 20.53 | ||||
| 2025-08-12 | 13F | Accordant Advisory Group Inc | 3,450 | 122 | ||||||
| 2025-08-14 | 13F | Stifel Financial Corp | 1,397,256 | 82.11 | 49,295 | 99.04 | ||||
| 2025-04-25 | 13F | MidAtlantic Capital Management, Inc. | 0 | -100.00 | 0 | |||||
| 2025-08-14 | 13F | Great Valley Advisor Group, Inc. | 595,164 | 56.56 | 20,997 | 71.12 | ||||
| 2025-08-27 | NP | JNL SERIES TRUST - JNL iShares Tactical Growth Fund (A) | 856,138 | 0.59 | 30,205 | 9.94 | ||||
| 2025-07-10 | 13F | Sharkey, Howes & Javer | 146,498 | -5.08 | 5,168 | 3.75 | ||||
| 2025-07-30 | 13F | Onyx Bridge Wealth Group LLC | 279,053 | 5.43 | 9,845 | 15.23 | ||||
| 2025-08-08 | 13F | KM Capital Management Ltd. | 7,560 | 0.00 | 267 | 9.02 | ||||
| 2025-08-12 | 13F | Jpmorgan Chase & Co | 58,087 | 2,049 | ||||||
| 2025-08-13 | 13F | Level Four Advisory Services, Llc | 914,706 | 2.47 | 32,271 | 11.99 | ||||
| 2025-07-22 | 13F | Merit Financial Group, LLC | 82,600 | -13.98 | 2,914 | -5.97 | ||||
| 2025-07-10 | 13F | Focus Financial Network, Inc. | 111,106 | -2.15 | 3,920 | 6.93 | ||||
| 2025-07-11 | 13F | Farther Finance Advisors, LLC | 2,083 | 4.41 | 73 | 14.06 | ||||
| 2025-08-06 | 13F | Founders Financial Securities Llc | 45,358 | 1,600 | ||||||
| 2025-08-13 | 13F | Cary Street Partners Financial Llc | 52,091 | -3.79 | 1,838 | 5.15 | ||||
| 2025-08-13 | 13F | Vermillion & White Wealth Management Group, LLC | 273 | 18.70 | 10 | 28.57 | ||||
| 2025-08-14 | 13F | Mariner, LLC | 89,104 | 0.97 | 3,144 | 10.36 | ||||
| 2025-07-10 | 13F | American Financial Advisors, LLC | 31,429 | 110.35 | 1,109 | 129.88 | ||||
| 2025-07-25 | 13F | Apollon Financial, LLC | 19,160 | 4.07 | 676 | 13.64 | ||||
| 2025-08-04 | 13F | Atria Investments Llc | 13,265 | 18.93 | 468 | 29.72 | ||||
| 2025-07-30 | 13F | Cornerstone Advisory, LLC | 537,301 | -1.79 | 18,956 | 8.07 | ||||
| 2025-08-14 | 13F | Royal Bank Of Canada | 2,133,941 | 15.57 | 75,285 | 26.31 | ||||
| 2025-07-24 | 13F | Ronald Blue Trust, Inc. | 0 | -100.00 | 0 | |||||
| 2025-08-12 | 13F | Steward Partners Investment Advisory, Llc | 3,653 | 13.80 | 129 | 24.27 | ||||
| 2025-07-07 | 13F | Global Wealth Strategies & Associates | 800 | 0.00 | 28 | 12.00 | ||||
| 2025-08-15 | 13F | Sugar Maple Asset Management, LLC | 99,059 | 45.10 | 3,495 | 58.60 | ||||
| 2025-08-12 | 13F | Founders Financial Alliance, LLC | 8,709 | 9.42 | 307 | 19.92 | ||||
| 2025-08-04 | 13F | HBK Sorce Advisory LLC | 0 | -100.00 | 0 | |||||
| 2025-08-05 | 13F | Westside Investment Management, Inc. | 17,945 | 3.58 | 633 | 13.24 | ||||
| 2025-05-15 | 13F | Tower Research Capital LLC (TRC) | 0 | -100.00 | 0 | |||||
| 2025-05-14 | 13F | Congress Wealth Management LLC / DE / | 0 | -100.00 | 0 | |||||
| 2025-07-28 | 13F | Harbour Investments, Inc. | 17,360 | 4.95 | 612 | 14.82 | ||||
| 2025-07-18 | 13F | First Pacific Financial | 459 | 16 | ||||||
| 2025-07-14 | 13F | AdvisorNet Financial, Inc | 39,660 | 5.55 | 1,399 | 15.43 | ||||
| 2025-07-28 | 13F | Axxcess Wealth Management, Llc | 13,560 | 67.51 | 478 | 83.14 | ||||
| 2025-08-14 | 13F | Citadel Advisors Llc | 41,803 | 18.13 | 1,475 | 29.07 | ||||
| 2025-08-04 | 13F | Ledyard National Bank | 221,367 | 3.02 | 7,810 | 12.59 | ||||
| 2025-08-04 | 13F | Bay Colony Advisory Group, Inc d/b/a Bay Colony Advisors | 11,155 | 1.96 | 394 | 11.65 | ||||
| 2025-08-14 | 13F | Integrated Wealth Concepts LLC | 124,740 | 5.45 | 4,401 | 15.24 | ||||
| 2025-08-07 | 13F | Rollins Financial Advisors, LLC | 9,678 | 341 | ||||||
| 2025-07-11 | 13F | Annex Advisory Services, LLC | 8,121 | 287 | ||||||
| 2025-07-23 | 13F | Seamount Financial Group Inc | 47,116 | 5.30 | 1,662 | 15.10 | ||||
| 2025-08-14 | 13F | Price T Rowe Associates Inc /md/ | 15,517,215 | 13.90 | 547 | 24.60 | ||||
| 2025-07-30 | 13F | CMG Global Holdings, LLC | 52,636 | 1,928 | ||||||
| 2025-07-25 | 13F | Cwm, Llc | 52,026 | 7.86 | 2 | 0.00 | ||||
| 2025-08-07 | 13F | PCG Wealth Advisors, LLC | 0 | -100.00 | 0 | |||||
| 2025-05-14 | 13F | Paces Ferry Wealth Advisors, Llc | 0 | -100.00 | 0 | |||||
| 2025-07-31 | 13F | McCarthy Asset Management, Inc. | 539,671 | -1.36 | 19,040 | 7.81 | ||||
| 2025-08-14 | 13F | IHT Wealth Management, LLC | 14,976 | 7.32 | 528 | 17.33 | ||||
| 2025-08-15 | 13F | Morgan Stanley | 2,774,738 | 121.85 | 97,893 | 142.47 | ||||
| 2025-08-11 | 13F | Regal Investment Advisors LLC | 49,608 | 10.25 | 1,750 | 20.52 | ||||
| 2025-08-12 | 13F | Global Retirement Partners, LLC | 182,967 | -0.56 | 6,455 | 5.46 | ||||
| 2025-05-12 | 13F | Independent Advisor Alliance | 0 | -100.00 | 0 | |||||
| 2025-08-06 | 13F | Legacy Wealth Managment, LLC/ID | 677 | 0.00 | 24 | 9.52 | ||||
| 2025-08-13 | 13F | Northwestern Mutual Wealth Management Co | 541,925 | 36.89 | 19,119 | 49.61 | ||||
| 2025-08-29 | 13F | Centaurus Financial, Inc. | 135,837 | 26.27 | 5 | 33.33 | ||||
| 2025-07-28 | 13F | Keeler & Nadler Financial Planning & Wealth Management | 8,268 | -37.45 | 292 | -31.53 | ||||
| 2025-08-04 | 13F | Assetmark, Inc | 0 | -100.00 | 0 | |||||
| 2025-08-12 | 13F | Cornerstone Wealth Management, LLC | 28,348 | 13.87 | 1,000 | 24.53 | ||||
| 2025-08-14 | 13F | Mml Investors Services, Llc | 116,736 | 20.52 | 4 | 33.33 | ||||
| 2025-08-12 | 13F | CIBC Private Wealth Group, LLC | 391 | -49.61 | 14 | -40.91 | ||||
| 2025-08-14 | 13F | Godshalk Welsh Capital Management, Inc. | 40,475 | 2.66 | 1,428 | 12.19 | ||||
| 2025-07-24 | 13F | Robertson Stephens Wealth Management, LLC | 70,637 | -3.45 | 2,492 | 5.55 | ||||
| 2025-08-14 | 13F | McIlrath & Eck, LLC | 0 | -100.00 | 0 | |||||
| 2025-08-01 | 13F | Envestnet Asset Management Inc | 367,223 | 6.53 | 12,956 | 16.43 | ||||
| 2025-04-30 | 13F | POM Investment Strategies, LLC | 0 | -100.00 | 0 | |||||
| 2025-08-11 | 13F | Nations Financial Group Inc, /ia/ /adv | 238,766 | 0.10 | 8,424 | 9.40 | ||||
| 2025-08-13 | 13F | Renaissance Technologies Llc | 33,200 | 1,171 | ||||||
| 2025-08-13 | 13F | IAG Wealth Partners, LLC | 62 | 0.00 | 2 | 0.00 | ||||
| 2025-07-22 | 13F | DAVENPORT & Co LLC | 104,935 | 13.80 | 3,702 | 24.40 | ||||
| 2025-08-04 | 13F | Kovack Advisors, Inc. | 7,763 | 12.85 | 274 | 22.97 | ||||
| 2025-07-24 | 13F | IFP Advisors, Inc | 25,296 | 11.49 | 892 | 21.86 | ||||
| 2025-08-11 | 13F | Advisor Resource Council | 0 | -100.00 | 0 | |||||
| 2025-08-06 | 13F | Commonwealth Equity Services, Llc | 4,262,710 | -13.61 | 150 | -5.66 | ||||
| 2025-08-08 | 13F | WASHINGTON TRUST Co | 0 | -100.00 | 0 | |||||
| 2025-07-09 | 13F | Sar Wealth Management Group, Llc | 57,906 | 9.44 | 2,043 | 19.63 | ||||
| 2025-07-30 | 13F | D.a. Davidson & Co. | 318,015 | 1.80 | 11,220 | 11.26 | ||||
| 2025-07-30 | 13F | Paragon Advisors, LLC | 139,461 | 8.03 | 4,920 | 18.07 | ||||
| 2025-08-08 | 13F | Creative Planning | 24,673 | 26.70 | 870 | 38.54 | ||||
| 2025-07-15 | 13F | FMA Wealth Management, LLC | 29,214 | 4.57 | 1,031 | 9.46 | ||||
| 2025-08-18 | 13F | V2 Financial group LLC | 151,360 | -1.99 | 5,340 | 7.10 | ||||
| 2025-08-14 | 13F | Ausdal Financial Partners, Inc. | 344,469 | 8.68 | 12,153 | 18.78 | ||||
| 2025-07-01 | 13F | Harbor Investment Advisory, Llc | 46,524 | 43.75 | 1,641 | 57.18 | ||||
| 2025-08-14 | 13F | Wiley Bros.-aintree Capital, Llc | 14,754 | 11.99 | 521 | 22.64 | ||||
| 2025-08-15 | 13F | Equitable Holdings, Inc. | 99,758 | 11.84 | 3,519 | 22.23 | ||||
| 2025-07-11 | 13F | LongView Wealth Management | 22,800 | 15.15 | 804 | 25.82 | ||||
| 2025-08-12 | 13F | SRS Capital Advisors, Inc. | 30,858 | -6.50 | 1,089 | 2.16 | ||||
| 2025-09-04 | 13F/A | Advisor Group Holdings, Inc. | 2,788,479 | 15.98 | 98,385 | 26.76 | ||||
| 2025-08-08 | 13F | Advyzon Investment Management, LLC | 7,277 | 257 | ||||||
| 2025-08-04 | 13F | WNY Asset Management, LLC | 20,807 | -8.24 | 734 | 0.41 | ||||
| 2025-08-12 | 13F | Proequities, Inc. | 0 | 0 | ||||||
| 2025-07-29 | 13F | Koshinski Asset Management, Inc. | 59,707 | 17.44 | 2,106 | 28.34 | ||||
| 2025-07-31 | 13F | Trademark Financial Management, LLC | 0 | -100.00 | 0 | |||||
| 2025-08-05 | 13F | Bank of New York Mellon Corp | 1,828,658 | 0.12 | 64,515 | 9.42 | ||||
| 2025-08-14 | 13F | CoreCap Advisors, LLC | 21,023 | 1,721.75 | 742 | 1,902.70 | ||||
| 2025-08-14 | 13F | Principia Wealth Advisory, LLC | 790 | 1.28 | 28 | 12.50 | ||||
| 2025-06-26 | NP | FLCE - Frontier Asset U.S. Large Cap Equity ETF | 145,638 | 9.43 | 4,663 | 1.77 | ||||
| 2025-07-08 | 13F | Lowe Wealth Advisors, LLC | 25,774 | 40.29 | 909 | 53.29 | ||||
| 2025-08-05 | 13F | Fourth Dimension Wealth, LLC | 30 | 0.00 | 1 | |||||
| 2025-08-06 | 13F | Walkner Condon Financial Advisors LLC | 40,260 | -10.68 | 1,420 | -2.34 | ||||
| 2025-07-08 | 13F | Chemistry Wealth Management LLC | 155,089 | 8.81 | 5,472 | 18.93 | ||||
| 2025-07-09 | 13F | Heritage Wealth Architects, Inc. | 5,836 | 206 | ||||||
| 2025-08-12 | 13F | Frontier Asset Management, LLC | 31,301 | -25.61 | 1,104 | -18.70 | ||||
| 2025-08-12 | 13F | Integrated Advisors Network LLC | 46,819 | 8.94 | 1,652 | 19.03 | ||||
| 2025-07-18 | 13F | Financial Consulate, Inc | 514,761 | -1.06 | 18,161 | 8.13 | ||||
| 2025-08-11 | 13F | HighTower Advisors, LLC | 229,565 | 0.48 | 8,099 | 9.83 | ||||
| 2025-08-13 | 13F | Jones Financial Companies Lllp | 1,031,681 | 50.77 | 36,305 | 64.82 | ||||
| 2025-08-05 | 13F | HFG Advisors, Inc. | 75,286 | 1.70 | 2,656 | 11.18 | ||||
| 2025-08-06 | 13F | Vantage Financial Partners, LLC | 101,219 | 3,571 | ||||||
| 2025-08-11 | 13F | Hopwood Financial Services, Inc. | 8,520 | 21.35 | 301 | 32.74 | ||||
| 2025-08-14 | 13F | Hilltop Holdings Inc. | 63,003 | -0.66 | 2,223 | 8.55 | ||||
| 2025-07-21 | 13F | Patriot Financial Group Insurance Agency, LLC | 58,499 | -1.87 | 2,064 | 7.22 | ||||
| 2025-08-06 | 13F | Nvwm, Llc | 52,673 | 2.00 | 1,858 | 11.52 | ||||
| 2025-08-07 | 13F | Resources Investment Advisors, LLC. | 779,889 | -1.97 | 27,514 | 7.14 |