Mga Batayang Estadistika
| Pemilik Institusional | 142 total, 139 long only, 1 short only, 2 long/short - change of -10.13% MRQ |
| Alokasi Portofolio Rata-rata | 0.1326 % - change of -16.48% MRQ |
| Saham Institusional (Jangka Panjang) | 20,961,440 (ex 13D/G) - change of -1.65MM shares -7.29% MRQ |
| Nilai Institusional (Jangka Panjang) | $ 137,074 USD ($1000) |
Kepemilikan Institusional dan Pemegang Saham
BlackRock TCP Capital Corp. (US:TCPC) memiliki 142 pemilik institusional dan pemegang saham yang telah mengajukan formulir 13D/G atau 13F kepada Komisi Bursa Efek (Securities Exchange Commission/SEC). Lembaga-lembaga ini memegang total 21,272,201 saham. Pemegang saham terbesar meliputi Van Eck Associates Corp, BIZD - VanEck Vectors BDC Income ETF, KBWD - Invesco KBW High Dividend Yield Financial ETF, UBS Group AG, Invesco Ltd., Transcend Wealth Collective, Llc, Next Capital Management LLC, Two Sigma Advisers, Lp, Two Sigma Investments, Lp, and Morgan Stanley .
Struktur kepemilikan institusional BlackRock TCP Capital Corp. (NasdaqGS:TCPC) menunjukkan posisi terkini di perusahaan oleh institusi dan dana, serta perubahan terbaru dalam ukuran posisi. Pemegang saham utama dapat mencakup investor individu, reksa dana, dana lindung nilai, atau institusi. Jadwal 13D menunjukkan bahwa investor memegang (atau pernah memegang) lebih dari 5% saham perusahaan dan bermaksud (atau pernah bermaksud) untuk secara aktif mengejar perubahan strategi bisnis. Jadwal 13G menunjukkan investasi pasif lebih dari 5%.
The share price as of September 5, 2025 is 7.24 / share. Previously, on September 6, 2024, the share price was 9.11 / share. This represents a decline of 20.53% over that period.

Skor Sentimen Dana
Skor Sentimen Dana (sebelumnya dikenal sebagai Skor Akumulasi Kepemilikan) menemukan saham-saham yang paling banyak dibeli oleh dana. Ini adalah hasil dari model kuantitatif multi-faktor yang canggih yang mengidentifikasi perusahaan dengan tingkat akumulasi institusional tertinggi. Model penilaian menggunakan kombinasi dari total peningkatan pemilik yang diungkapkan, perubahan dalam alokasi portofolio pada pemilik tersebut, dan metrik lainnya. Angka berkisar dari 0 hingga 100, dengan angka yang lebih tinggi menunjukkan tingkat akumulasi yang lebih tinggi dibandingkan dengan perusahaan sejenisnya, dan 50 adalah rata-ratanya.
Frekuensi Pembaruan: Setiap Hari
Lihat Ownership Explorer, yang menyediakan daftar perusahaan dengan peringkat tertinggi.
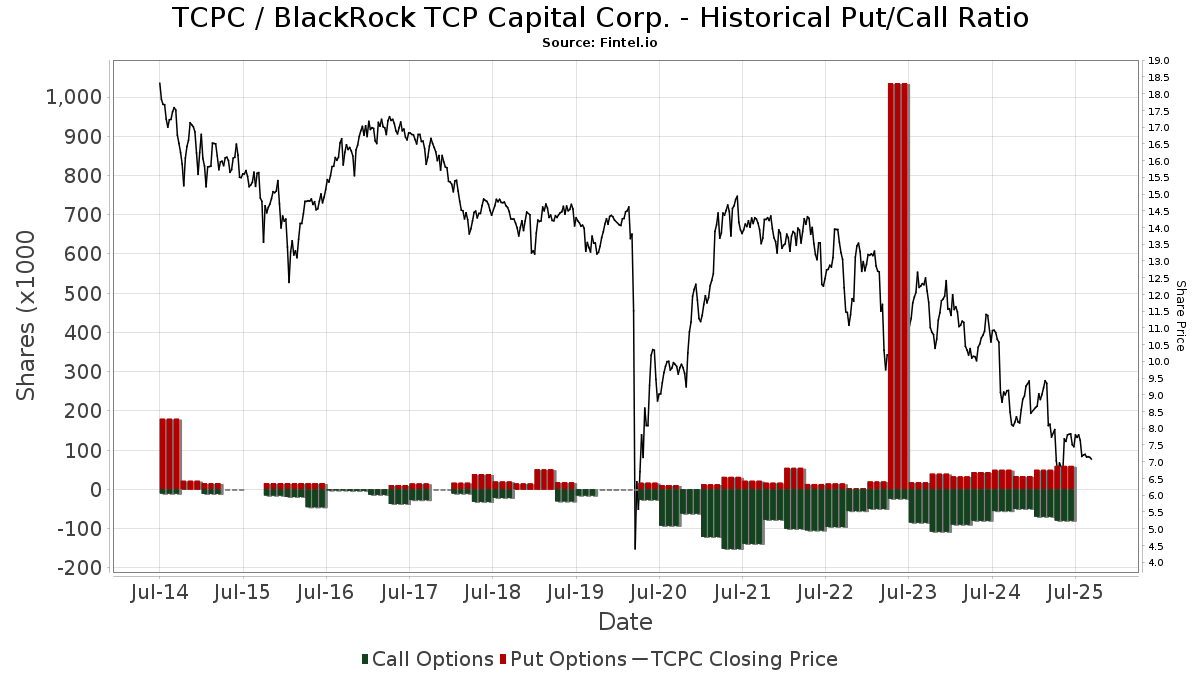
Rasio Put/Call Institusional
Selain melaporkan isu ekuitas dan utang standar, institusi dengan aset di bawah manajemen lebih dari 100 juta dolar AS juga harus mengungkapkan kepemilikan opsi put dan call mereka. Karena opsi put umumnya menunjukkan sentimen negatif, dan opsi call menunjukkan sentimen positif, kita dapat mengetahui sentimen institusional secara keseluruhan dengan memplot rasio put terhadap call. Grafik di sebelah kanan memplot rasio put/call historis untuk instrumen ini.
Menggunakan Rasio Put/Call sebagai indikator sentimen investor mengatasi salah satu kekurangan utama dari penggunaan total kepemilikan institusional, yaitu sejumlah besar aset yang dikelola diinvestasikan secara pasif untuk melacak indeks. Dana yang dikelola secara pasif biasanya tidak membeli opsi, sehingga indikator rasio put/call lebih akurat dalam melacak sentimen dana yang dikelola secara aktif.
Pengajuan 13F dan NPORT
Detail pada pengajuan 13F tersedia gratis. Detail pada pengajuan NP memerlukan keanggotaan premium. Baris berwarna hijau menunjukkan posisi baru. Baris berwarna merah menunjukkan posisi yang sudah ditutup. Klik tautan ini ikon untuk melihat riwayat transaksi selengkapnya.
Tingkatkan
untuk membuka data premium dan mengekspor ke Excel ![]() .
.
| Tanggal File | Sumber | Investor | Ketik | Presyo ng Avg (Silangan) |
Saham | Δ Saham (%) |
Dilaporkan Nilai ($1000) |
Nilai Δ (%) |
Alokasi Port (%) |
|
|---|---|---|---|---|---|---|---|---|---|---|
| 2025-07-23 | 13F | Kingswood Wealth Advisors, Llc | 0 | -100.00 | 0 | -100.00 | ||||
| 2025-08-08 | 13F | Alberta Investment Management Corp | 0 | -100.00 | 0 | |||||
| 2025-08-14 | 13F | Federation des caisses Desjardins du Quebec | 1,150 | 0.00 | 9 | -11.11 | ||||
| 2025-07-22 | 13F | Romano Brothers And Company | 87,645 | 0.00 | 675 | -3.99 | ||||
| 2025-08-14 | 13F | Royal Bank Of Canada | 32,988 | 11.40 | 254 | 7.17 | ||||
| 2025-04-09 | 13F | American National Bank | 0 | -100.00 | 0 | -100.00 | ||||
| 2025-08-12 | 13F | LPL Financial LLC | 212,989 | -4.68 | 1,640 | -8.33 | ||||
| 2025-08-15 | 13F | Morgan Stanley | 707,036 | -24.10 | 5,444 | -27.04 | ||||
| 2025-07-10 | 13F | Redhawk Wealth Advisors, Inc. | 106,720 | 822 | ||||||
| 2025-07-23 | 13F | Joel Isaacson & Co., LLC | 16,710 | 0.00 | 129 | -3.76 | ||||
| 2025-08-12 | 13F | Barings Llc | 497,580 | 0.00 | 3,831 | -3.86 | ||||
| 2025-08-04 | 13F | Arkadios Wealth Advisors | 65,670 | -31.96 | 506 | -34.67 | ||||
| 2025-08-13 | 13F | Loomis Sayles & Co L P | 245,000 | 0.00 | 1,886 | 188,500.00 | ||||
| 2025-08-13 | 13F | Colonial Trust Advisors | 573 | 4 | ||||||
| 2025-08-14 | 13F | Van Eck Associates Corp | 2,178,715 | 7.30 | 17 | 0.00 | ||||
| 2025-08-06 | 13F | Ethos Financial Group, LLC | 0 | -100.00 | 0 | -100.00 | ||||
| 2025-08-14 | 13F | CF Capital LLC | 0 | -100.00 | 0 | |||||
| 2025-08-01 | 13F | Transcend Wealth Collective, Llc | 1,333,693 | -9.43 | 10,269 | -12.94 | ||||
| 2025-08-04 | 13F | Muzinich & Co., Inc. | 256,389 | -2.84 | 1,974 | -6.58 | ||||
| 2025-08-08 | 13F | Cetera Investment Advisers | 58,379 | -89.64 | 450 | -90.05 | ||||
| 2025-08-01 | 13F | Y-Intercept (Hong Kong) Ltd | 0 | -100.00 | 0 | |||||
| 2025-08-13 | 13F | Northern Trust Corp | 29,776 | 229 | ||||||
| 2025-08-14 | 13F | Citadel Advisors Llc | Put | 0 | -100.00 | 0 | ||||
| 2025-08-13 | 13F | Transce3nd, LLC | 6,868 | 0.53 | 53 | -3.70 | ||||
| 2025-08-14 | 13F | Mariner, LLC | 29,592 | 2.98 | 228 | -1.30 | ||||
| 2025-07-30 | 13F | Bogart Wealth, LLC | 11,812 | 0.00 | 91 | -4.26 | ||||
| 2025-07-11 | 13F | Farther Finance Advisors, LLC | 799 | 0.00 | 6 | 0.00 | ||||
| 2025-07-30 | NP | ORR - Militia Long/Short Equity ETF | Short | -310,761 | 311.67 | -2,436 | 282.42 | |||
| 2025-04-11 | 13F | Seacrest Wealth Management, Llc | 0 | -100.00 | 0 | |||||
| 2025-05-12 | 13F | Connor, Clark & Lunn Investment Management Ltd. | 0 | -100.00 | 0 | |||||
| 2025-05-12 | 13F | Fmr Llc | 0 | -100.00 | 0 | |||||
| 2025-07-21 | 13F | Ameritas Advisory Services, LLC | 1,364 | 11 | ||||||
| 2025-07-31 | 13F | Sumitomo Mitsui Trust Holdings, Inc. | 253,357 | -2.88 | 1,951 | -6.65 | ||||
| 2025-08-12 | 13F | J.w. Cole Advisors, Inc. | 142,047 | 24.94 | 1,094 | 20.11 | ||||
| 2025-08-14 | 13F | Ubs Asset Management Americas Inc | 131,304 | -11.45 | 1,011 | -14.83 | ||||
| 2025-05-13 | 13F | Evoke Wealth, Llc | 0 | -100.00 | 0 | |||||
| 2025-08-06 | 13F | Prospera Financial Services Inc | 14,936 | 115 | ||||||
| 2025-08-13 | 13F | Virtus Investment Advisers, Inc. | 165,000 | 6.35 | 1,270 | 2.25 | ||||
| 2025-07-10 | 13F | Wealth Enhancement Advisory Services, Llc | 11,656 | 13.12 | 91 | 10.98 | ||||
| 2025-08-05 | 13F | Huntington National Bank | 1,000 | 8 | ||||||
| 2025-07-31 | 13F | Cambridge Investment Research Advisors, Inc. | 26,389 | -4.93 | 0 | |||||
| 2025-08-12 | 13F | Advisors Asset Management, Inc. | 58,397 | -57.51 | 450 | -59.18 | ||||
| 2025-08-14 | 13F | Aquatic Capital Management LLC | 0 | -100.00 | 0 | |||||
| 2025-04-21 | 13F | Nelson, Van Denburg & Campbell Wealth Management Group, LLC | 0 | -100.00 | 0 | |||||
| 2025-08-12 | 13F | Legal & General Group Plc | 559,479 | -0.01 | 4,300 | -4.25 | ||||
| 2025-08-11 | 13F | Nomura Asset Management Co Ltd | 3,904 | 30 | ||||||
| 2025-08-07 | 13F | Samalin Investment Counsel, LLC | 65,611 | -4.32 | 505 | -8.01 | ||||
| 2025-08-14 | 13F | Kovitz Investment Group Partners, LLC | 120,032 | -51.56 | 924 | -53.43 | ||||
| 2025-08-12 | 13F | BlackRock, Inc. | 510,941 | 29.32 | 3,934 | 24.34 | ||||
| 2025-05-12 | 13F | National Bank Of Canada /fi/ | 0 | -100.00 | 0 | |||||
| 2025-08-11 | 13F | United Advisor Group, LLC | 141,741 | -5.80 | 1,091 | -9.46 | ||||
| 2025-07-24 | 13F | Us Bancorp \de\ | 1,991 | 0.00 | 15 | 0.00 | ||||
| 2025-05-15 | 13F | Alpine Global Management, LLC | 0 | -100.00 | 0 | -100.00 | ||||
| 2025-08-07 | 13F | Midwest Trust Co | 12,500 | 96 | ||||||
| 2025-08-13 | 13F | Cerity Partners LLC | 24,643 | -74.79 | 190 | -75.83 | ||||
| 2025-08-27 | 13F/A | Squarepoint Ops LLC | 0 | -100.00 | 0 | -100.00 | ||||
| 2025-05-13 | 13F | Cercano Management LLC | 0 | -100.00 | 0 | |||||
| 2025-08-13 | 13F | Lido Advisors, LLC | 27,775 | -30.85 | 214 | -33.64 | ||||
| 2025-05-13 | 13F | Sterling Capital Management LLC | 0 | -100.00 | 0 | |||||
| 2025-08-14 | 13F | Bank Of America Corp /de/ | 223,722 | 101.64 | 1,723 | 93.92 | ||||
| 2025-08-25 | 13F/A | Neuberger Berman Group LLC | 21,200 | 0.00 | 163 | -3.55 | ||||
| 2025-08-05 | 13F | Mission Wealth Management, Lp | 14,859 | 114 | ||||||
| 2025-07-17 | 13F | Sound Income Strategies, LLC | 1,468 | 0.00 | 11 | 0.00 | ||||
| 2025-05-30 | NP | ERNZ - TrueShares Active Yield ETF | 0 | -100.00 | 0 | -100.00 | ||||
| 2025-08-13 | 13F | Invesco Ltd. | 1,423,209 | -7.63 | 10,959 | -11.21 | ||||
| 2025-08-14 | 13F | Schonfeld Strategic Advisors LLC | 0 | -100.00 | 0 | |||||
| 2025-08-13 | 13F | OMERS ADMINISTRATION Corp | 0 | -100.00 | 0 | |||||
| 2025-08-14 | 13F | Two Sigma Advisers, Lp | 950,517 | 2.34 | 7,319 | -1.63 | ||||
| 2025-08-12 | 13F | Change Path, LLC | 96,565 | 11.69 | 744 | 7.37 | ||||
| 2025-08-12 | 13F | CIBC Private Wealth Group, LLC | 3,160 | 0.00 | 24 | 20.00 | ||||
| 2025-07-11 | 13F | Mallini Complete Financial Planning LLC | 22,898 | 1.75 | 176 | -2.22 | ||||
| 2025-08-13 | 13F | EverSource Wealth Advisors, LLC | 750 | 0.00 | 6 | -16.67 | ||||
| 2025-08-12 | 13F | Journey Strategic Wealth Llc | 10,826 | 0.00 | 83 | -3.49 | ||||
| 2025-08-12 | 13F | Wood Tarver Financial Group, LLC | 470 | 0.00 | 0 | -100.00 | ||||
| 2025-08-14 | 13F | Goldman Sachs Group Inc | 0 | -100.00 | 0 | |||||
| 2025-07-28 | NP | KBWD - Invesco KBW High Dividend Yield Financial ETF This fund is a listed as child fund of Invesco Ltd. and if that institution has disclosed ownership in this security, then these positions will not be double counted when calculating total shares and total value | 1,516,037 | -4.05 | 11,886 | -10.87 | ||||
| 2025-05-15 | 13F | Hrt Financial Lp | 0 | -100.00 | 0 | |||||
| 2025-08-08 | 13F | Larson Financial Group LLC | 1,000 | 0.00 | 8 | -12.50 | ||||
| 2025-08-07 | 13F/A | Tortoise Investment Management, LLC | 0 | -100.00 | 0 | |||||
| 2025-08-06 | 13F | Legacy Wealth Managment, LLC/ID | 0 | -100.00 | 0 | -100.00 | ||||
| 2025-08-15 | 13F | Great West Life Assurance Co /can/ | 86,364 | 4.41 | 1 | |||||
| 2025-08-08 | 13F/A | Ignite Planners, LLC | 30,754 | -67.55 | 236 | -63.07 | ||||
| 2025-08-04 | 13F | MeadowBrook Investment Advisors LLC | 6,733 | 0.00 | 52 | -3.77 | ||||
| 2025-08-01 | 13F | Financial Counselors Inc | 0 | -100.00 | 0 | |||||
| 2025-07-22 | 13F | Accel Wealth Management | 12,000 | 0.00 | 92 | -4.17 | ||||
| 2025-07-22 | 13F | Wealthcare Advisory Partners LLC | 10,135 | -3.49 | 78 | -7.14 | ||||
| 2025-08-06 | 13F | Legacy Investment Solutions, LLC | 0 | -100.00 | 0 | -100.00 | ||||
| 2025-08-14 | 13F | Aqr Capital Management Llc | 59,557 | 459 | ||||||
| 2025-07-31 | 13F | Nisa Investment Advisors, Llc | 0 | -100.00 | 0 | |||||
| 2025-07-23 | 13F | Columbus Macro, LLC | 0 | -100.00 | 0 | |||||
| 2025-08-04 | 13F | Creekmur Asset Management LLC | 1 | 0.00 | 0 | |||||
| 2025-06-25 | NP | VPC - Virtus Private Credit Strategy ETF | 141,720 | -3.57 | 969 | -28.38 | ||||
| 2025-08-13 | 13F | Wealthedge Investment Advisors, Llc | 0 | -100.00 | 0 | |||||
| 2025-08-14 | 13F | Two Sigma Investments, Lp | 712,321 | 8.83 | 5,485 | 4.62 | ||||
| 2025-08-14 | 13F | Atomi Financial Group, Inc. | 13,151 | 0.00 | 101 | -3.81 | ||||
| 2025-07-25 | 13F | Verdence Capital Advisors LLC | 0 | -100.00 | 0 | |||||
| 2025-08-13 | 13F | M&t Bank Corp | 24,122 | 0.00 | 186 | -4.15 | ||||
| 2025-09-04 | 13F/A | Advisor Group Holdings, Inc. | 63,921 | 1.89 | 492 | -1.99 | ||||
| 2025-08-12 | 13F | Jpmorgan Chase & Co | 0 | -100.00 | 0 | |||||
| 2025-07-28 | 13F | Harbour Investments, Inc. | 221 | 2.79 | 2 | 0.00 | ||||
| 2025-07-30 | 13F | Privium Fund Management (UK) Ltd | 125,977 | -15.04 | 983 | -16.78 | ||||
| 2025-08-15 | 13F | Caxton Associates Llp | 60,779 | 16.21 | 468 | 11.72 | ||||
| 2025-08-05 | 13F | Simplex Trading, Llc | 0 | -100.00 | 0 | |||||
| 2025-08-15 | 13F | Captrust Financial Advisors | 38,312 | -62.14 | 295 | -63.58 | ||||
| 2025-08-14 | 13F | Eight 31 Financial Llc | 17,246 | 133 | ||||||
| 2025-08-14 | 13F | Stifel Financial Corp | 75,444 | -0.78 | 581 | -4.76 | ||||
| 2025-07-28 | 13F | Curated Wealth Partners LLC | 38,587 | 0.00 | 297 | -3.88 | ||||
| 2025-08-14 | 13F | BI Asset Management Fondsmaeglerselskab A/S | 417,991 | 6.06 | 3 | 0.00 | ||||
| 2025-07-18 | 13F | Truist Financial Corp | 0 | -100.00 | 0 | |||||
| 2025-08-14 | 13F | Comerica Bank | 1,840 | -1.18 | 14 | 0.00 | ||||
| 2025-08-14 | 13F/A | Rockefeller Capital Management L.P. | 120,624 | -44.46 | 929 | -46.64 | ||||
| 2025-08-14 | 13F | Millennium Management Llc | 11,447 | 88 | ||||||
| 2025-07-31 | 13F | Caitong International Asset Management Co., Ltd | 960 | 153.97 | 7 | 133.33 | ||||
| 2025-08-07 | 13F | Lakeridge Wealth Management LLC | 0 | -100.00 | 0 | |||||
| 2025-08-12 | 13F | Clear Street Markets Llc | 0 | -100.00 | 0 | |||||
| 2025-08-13 | 13F | Centiva Capital, LP | 0 | -100.00 | 0 | |||||
| 2025-05-15 | 13F | Talon Private Wealth, LLC | 0 | -100.00 | 0 | -100.00 | ||||
| 2025-05-09 | 13F | Pathway Financial Advisers, LLC | 0 | -100.00 | 0 | |||||
| 2025-05-14 | 13F | Credit Agricole S A | 235 | 0.00 | 2 | -50.00 | ||||
| 2025-08-12 | 13F | Dynamic Technology Lab Private Ltd | 48,440 | 359.15 | 373 | 338.82 | ||||
| 2025-08-14 | 13F | AllSquare Wealth Management LLC | 0 | -100.00 | 0 | |||||
| 2025-08-18 | 13F | Geneos Wealth Management Inc. | 304 | 0.00 | 2 | 0.00 | ||||
| 2025-08-13 | 13F | WealthTrust Axiom LLC | 14,975 | 0.00 | 115 | -3.36 | ||||
| 2025-08-06 | 13F | Commonwealth Equity Services, Llc | 68,149 | 0.21 | 1 | |||||
| 2025-06-27 | NP | LBO - WHITEWOLF Publicly Listed Private Equity ETF | 8,743 | 14.27 | 60 | -15.71 | ||||
| 2025-08-08 | 13F | MTM Investment Management, LLC | 5,976 | 46 | ||||||
| 2025-08-14 | 13F | Ameriprise Financial Inc | 21,380 | -1.03 | 165 | -5.20 | ||||
| 2025-08-19 | 13F | Asset Dedication, LLC | 148 | 0.00 | 1 | 0.00 | ||||
| 2025-08-14 | 13F | Quarry LP | 2,064 | 16 | ||||||
| 2025-08-11 | 13F | TD Waterhouse Canada Inc. | 215 | 0.00 | 2 | 0.00 | ||||
| 2025-08-15 | 13F | Kestra Advisory Services, LLC | 56,782 | -24.68 | 437 | -27.53 | ||||
| 2025-07-28 | 13F | BRYN MAWR TRUST Co | 2,000 | 0.00 | 15 | -6.25 | ||||
| 2025-08-14 | 13F | UBS Group AG | 1,475,030 | 12.37 | 11,358 | 8.02 | ||||
| 2025-08-11 | 13F | Hexagon Capital Partners LLC | 0 | -100.00 | 0 | |||||
| 2025-07-31 | 13F | Oppenheimer & Co Inc | 13,900 | -17.75 | 107 | -20.74 | ||||
| 2025-08-11 | 13F | Universal- Beteiligungs- und Servicegesellschaft mbH | 51,900 | 0.00 | 400 | -3.86 | ||||
| 2025-08-14 | 13F | Jane Street Group, Llc | 20,428 | 157 | ||||||
| 2025-05-15 | 13F | Ares Management Llc | 0 | -100.00 | 0 | |||||
| 2025-08-07 | 13F | Hennion & Walsh Asset Management, Inc. | 290,474 | -24.42 | 2,237 | -27.36 | ||||
| 2025-08-04 | 13F | Spire Wealth Management | 0 | -100.00 | 0 | |||||
| 2025-08-12 | 13F | Bokf, Na | 208 | 0.00 | 2 | 0.00 | ||||
| 2025-08-15 | 13F | Tower Research Capital LLC (TRC) | 0 | -100.00 | 0 | |||||
| 2025-07-17 | 13F | GraniteShares Advisors LLC | 319,833 | 6.67 | 2,463 | 2.54 | ||||
| 2025-08-06 | 13F | First Horizon Advisors, Inc. | 0 | -100.00 | 0 | |||||
| 2025-08-13 | 13F | Jones Financial Companies Lllp | 1,715 | 0.00 | 13 | 0.00 | ||||
| 2025-08-13 | 13F | Marshall Wace, Llp | 525,266 | 4,045 | ||||||
| 2025-08-14 | 13F | Susquehanna International Group, Llp | Call | 28,600 | -45.73 | 220 | -47.87 | |||
| 2025-08-21 | NP | BIZD - VanEck Vectors BDC Income ETF | 1,926,567 | 2.81 | 14,835 | -1.17 | ||||
| 2025-08-01 | 13F | Envestnet Asset Management Inc | 64,809 | -89.08 | 499 | -89.50 | ||||
| 2025-08-05 | 13F | Next Capital Management LLC | 1,134,826 | 2,131.36 | 8,738 | 2,046.93 | ||||
| 2025-08-13 | 13F | Northwestern Mutual Wealth Management Co | 0 | -100.00 | 0 | |||||
| 2025-08-11 | 13F | Lsv Asset Management | 361,470 | 1.78 | 3 | 0.00 | ||||
| 2025-08-14 | 13F | Susquehanna International Group, Llp | 65,302 | 47.26 | 503 | 41.41 | ||||
| 2025-08-14 | 13F | Susquehanna International Group, Llp | Put | 57,000 | 25.00 | 439 | 20.00 | |||
| 2025-08-12 | 13F | XTX Topco Ltd | 21,536 | 166 | ||||||
| 2025-03-28 | NP | DVDN - Kingsbarn Dividend Opportunity ETF | 6,318 | 58 | ||||||
| 2025-05-13 | 13F | M Holdings Securities, Inc. | 0 | -100.00 | 0 | |||||
| 2025-04-22 | 13F | TrueMark Investments, LLC | 0 | -100.00 | 0 | |||||
| 2025-08-05 | 13F | Simplex Trading, Llc | Put | 3,100 | 10.71 | 0 | ||||
| 2025-08-05 | 13F | Simplex Trading, Llc | Call | 5,700 | 62.86 | 0 | ||||
| 2025-07-29 | 13F | Disciplined Investments, LLC | 20,000 | 0.00 | 154 | -3.75 | ||||
| 2025-08-07 | 13F | Verus Capital Partners, Llc | 12,750 | -79.47 | 98 | -80.28 | ||||
| 2025-08-12 | 13F | Steward Partners Investment Advisory, Llc | 13,563 | 0.00 | 104 | -3.70 | ||||
| 2025-08-05 | 13F | Access Investment Management LLC | 54,300 | 0.00 | 418 | -11.44 | ||||
| 2025-08-11 | 13F | VSM Wealth Advisory, LLC | 7,563 | -32.65 | 58 | -34.83 | ||||
| 2025-07-23 | 13F | Steel Peak Wealth Management LLC | 10,000 | 0.00 | 77 | -3.75 | ||||
| 2025-08-14 | 13F | Sunbelt Securities, Inc. | 13,580 | -6.86 | 118 | 1.72 | ||||
| 2025-05-14 | 13F | Virtus ETF Advisers LLC | 0 | -100.00 | 0 | |||||
| 2025-07-25 | 13F | Cwm, Llc | 2,295 | 0.00 | 0 | |||||
| 2025-08-11 | 13F | Nations Financial Group Inc, /ia/ /adv | 50,811 | -2.55 | 391 | -6.24 | ||||
| 2025-07-17 | 13F | Janney Montgomery Scott LLC | 0 | -100.00 | 0 | |||||
| 2025-08-14 | 13F | Raymond James Financial Inc | 90,675 | 7.73 | 698 | 3.56 | ||||
| 2025-08-08 | 13F | Avantax Advisory Services, Inc. | 12,922 | 0.20 | 100 | -3.88 | ||||
| 2025-07-18 | 13F | Bartlett & Co. Wealth Management Llc | 20,000 | 25.00 | 154 | 20.31 | ||||
| 2025-05-15 | 13F | Balyasny Asset Management Llc | 0 | -100.00 | 0 | -100.00 | ||||
| 2025-05-15 | 13F | Two Sigma Securities, Llc | 0 | -100.00 | 0 | |||||
| 2025-08-05 | 13F | GPS Wealth Strategies Group, LLC | 2,761 | 0.00 | 21 | -4.55 | ||||
| 2025-05-14 | 13F | Group One Trading, L.p. | 0 | -100.00 | 0 | |||||
| 2025-08-08 | 13F | Pnc Financial Services Group, Inc. | 10,200 | 0.00 | 79 | -3.70 | ||||
| 2025-07-24 | 13F | IFP Advisors, Inc | 200 | -13.04 | 2 | 0.00 | ||||
| 2025-08-13 | 13F | ExodusPoint Capital Management, LP | 0 | -100.00 | 0 | |||||
| 2025-08-07 | 13F | Allworth Financial LP | 1,956 | 15 | ||||||
| 2025-05-12 | 13F | Entropy Technologies, LP | 0 | -100.00 | 0 | |||||
| 2025-08-12 | 13F | Proequities, Inc. | Put | 0 | 0 | |||||
| 2025-08-14 | 13F | GWM Advisors LLC | 1,334 | -27.26 | 10 | -28.57 | ||||
| 2025-05-09 | 13F | Atria Wealth Solutions, Inc. | 0 | -100.00 | 0 | |||||
| 2025-08-12 | 13F | Proequities, Inc. | Call | 0 | 0 | |||||
| 2025-08-12 | 13F | Proequities, Inc. | 0 | 0 | ||||||
| 2025-08-14 | 13F | McIlrath & Eck, LLC | 5,489 | 0.00 | 42 | -2.33 | ||||
| 2025-08-14 | 13F | Group One Trading, L.p. | Call | 25,000 | 1,150.00 | 192 | 1,100.00 | |||
| 2025-05-12 | 13F | Virtu Financial LLC | 0 | -100.00 | 0 | |||||
| 2025-08-08 | 13F | Creative Planning | 11,062 | 85 | ||||||
| 2025-06-12 | 13F/A | Deutsche Bank Ag\ | 0 | -100.00 | 0 | |||||
| 2025-08-05 | 13F | Key FInancial Inc | 26 | 0.00 | 0 | |||||
| 2025-08-14 | 13F | Wells Fargo & Company/mn | 66,327 | 0.08 | 511 | -3.77 | ||||
| 2025-07-21 | 13F | Future Financial Wealth Managment LLC | 4,000 | 0.00 | 31 | -6.25 | ||||
| 2025-07-07 | 13F | Investors Research Corp | 3,471 | 0.00 | 27 | -3.70 | ||||
| 2025-07-30 | 13F | D.a. Davidson & Co. | 459,881 | -3.28 | 3,541 | -7.01 | ||||
| 2025-08-12 | 13F | Insigneo Advisory Services, Llc | 12,055 | -0.86 | 93 | -5.15 | ||||
| 2025-07-09 | 13F | Triumph Capital Management | 30,834 | -2.63 | 237 | -6.32 | ||||
| 2025-08-11 | 13F | Citigroup Inc | 1 | 0 | ||||||
| 2025-08-29 | NP | GraniteShares ETF Trust - GraniteShares HIPS US High Income ETF | 319,833 | 6.67 | 2,463 | 2.54 | ||||
| 2025-07-22 | 13F | Merit Financial Group, LLC | 13,942 | 0.90 | 107 | -2.73 | ||||
| 2025-08-14 | 13F | Citadel Advisors Llc | Call | 20,100 | 76.32 | 155 | 69.23 | |||
| 2025-08-14 | 13F | New England Asset Management Inc | 170,034 | 0.00 | 1,309 | -3.82 | ||||
| 2025-08-14 | 13F | Wiley Bros.-aintree Capital, Llc | 35,580 | 0.00 | 274 | -3.87 | ||||
| 2025-05-14 | 13F | CI Private Wealth, LLC | 0 | -100.00 | 0 | -100.00 |