Mga Batayang Estadistika
| Pemilik Institusional | 139 total, 130 long only, 2 short only, 7 long/short - change of -9.15% MRQ |
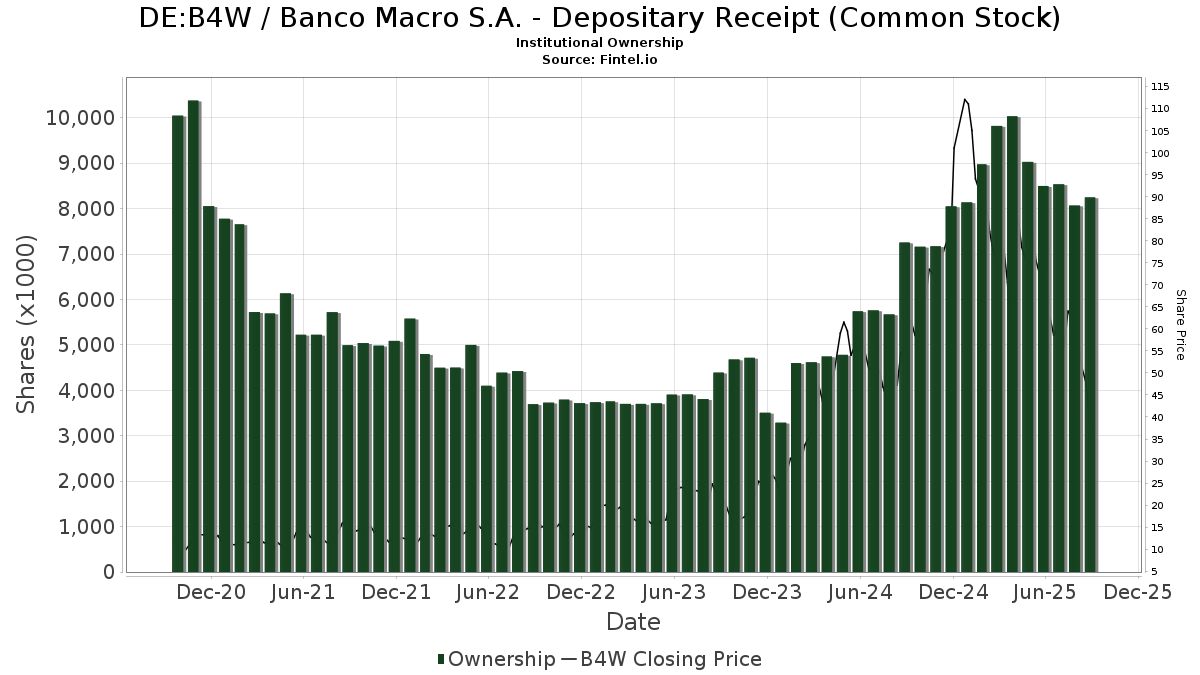
| Harga Saham | 49.60 |
| Alokasi Portofolio Rata-rata | 0.3337 % - change of -15.25% MRQ |
| Saham Institusional (Jangka Panjang) | 8,248,141 (ex 13D/G) - change of -0.19MM shares -2.29% MRQ |
| Nilai Institusional (Jangka Panjang) | $ 455,910 USD ($1000) |
Kepemilikan Institusional dan Pemegang Saham
Banco Macro S.A. - Depositary Receipt (Common Stock) (DE:B4W) memiliki 139 pemilik institusional dan pemegang saham yang telah mengajukan formulir 13D/G atau 13F kepada Komisi Bursa Efek (Securities Exchange Commission/SEC). Lembaga-lembaga ini memegang total 8,248,187 saham. Pemegang saham terbesar meliputi AIM INVESTMENT FUNDS (INVESCO INVESTMENT FUNDS) - Invesco Oppenheimer International Bond Fund Class R6, TT International Asset Management LTD, ARGT - Global X MSCI Argentina ETF, MIRAE ASSET GLOBAL ETFS HOLDINGS Ltd., AIM INVESTMENT FUNDS (INVESCO INVESTMENT FUNDS) - Invesco Oppenheimer Global Strategic Income Fund Class R6, PointState Capital LP, Morgan Stanley, Susquehanna International Group, Llp, Millennium Management Llc, and Cape Ann Asset Management Ltd .
Struktur kepemilikan institusional Banco Macro S.A. - Depositary Receipt (Common Stock) (DB:B4W) menunjukkan posisi terkini di perusahaan oleh institusi dan dana, serta perubahan terbaru dalam ukuran posisi. Pemegang saham utama dapat mencakup investor individu, reksa dana, dana lindung nilai, atau institusi. Jadwal 13D menunjukkan bahwa investor memegang (atau pernah memegang) lebih dari 5% saham perusahaan dan bermaksud (atau pernah bermaksud) untuk secara aktif mengejar perubahan strategi bisnis. Jadwal 13G menunjukkan investasi pasif lebih dari 5%.
The share price as of September 5, 2025 is 49.60 / share. Previously, on September 9, 2024, the share price was 56.00 / share. This represents a decline of 11.43% over that period.
Skor Sentimen Dana
Skor Sentimen Dana (sebelumnya dikenal sebagai Skor Akumulasi Kepemilikan) menemukan saham-saham yang paling banyak dibeli oleh dana. Ini adalah hasil dari model kuantitatif multi-faktor yang canggih yang mengidentifikasi perusahaan dengan tingkat akumulasi institusional tertinggi. Model penilaian menggunakan kombinasi dari total peningkatan pemilik yang diungkapkan, perubahan dalam alokasi portofolio pada pemilik tersebut, dan metrik lainnya. Angka berkisar dari 0 hingga 100, dengan angka yang lebih tinggi menunjukkan tingkat akumulasi yang lebih tinggi dibandingkan dengan perusahaan sejenisnya, dan 50 adalah rata-ratanya.
Frekuensi Pembaruan: Setiap Hari
Lihat Ownership Explorer, yang menyediakan daftar perusahaan dengan peringkat tertinggi.
Pengajuan 13F dan NPORT
Detail pada pengajuan 13F tersedia gratis. Detail pada pengajuan NP memerlukan keanggotaan premium. Baris berwarna hijau menunjukkan posisi baru. Baris berwarna merah menunjukkan posisi yang sudah ditutup. Klik tautan ini ikon untuk melihat riwayat transaksi selengkapnya.
Tingkatkan
untuk membuka data premium dan mengekspor ke Excel ![]() .
.
| Tanggal File | Sumber | Investor | Ketik | Presyo ng Avg (Silangan) |
Saham | Δ Saham (%) |
Dilaporkan Nilai ($1000) |
Nilai Δ (%) |
Alokasi Port (%) |
|
|---|---|---|---|---|---|---|---|---|---|---|
| 2025-07-21 | 13F | Ameritas Advisory Services, LLC | 4 | 0 | ||||||
| 2025-08-14 | 13F | Two Sigma Investments, Lp | 14,200 | -57.36 | 997 | -60.38 | ||||
| 2025-06-23 | NP | UBPIX - Ultralatin America Profund Investor Class | 436 | 39 | ||||||
| 2025-08-14 | 13F | Engineers Gate Manager LP | 37,118 | 12.75 | 2,606 | 4.87 | ||||
| 2025-07-24 | 13F | Ramirez Asset Management, Inc. | 33,433 | 94.97 | 2,347 | 81.38 | ||||
| 2025-09-04 | 13F/A | Advisor Group Holdings, Inc. | 2,004 | -77.88 | 141 | -79.50 | ||||
| 2025-05-09 | 13F | JGP Global Gestao de Recursos Ltda. | 0 | -100.00 | 0 | |||||
| 2025-06-23 | NP | Global Macro Portfolio - Global Macro Portfolio | 9,553 | 19.41 | 846 | 6.29 | ||||
| 2025-07-24 | 13F | Us Bancorp \de\ | 4,350 | 0.00 | 305 | -7.01 | ||||
| 2025-05-16 | 13F/A | Axiom International Investors Llc /de | 39,871 | -86.84 | 3,011 | -89.73 | ||||
| 2025-05-13 | 13F | Quadrature Capital Ltd | 0 | -100.00 | 0 | -100.00 | ||||
| 2025-08-29 | NP | AIM VARIABLE INSURANCE FUNDS (INVESCO VARIABLE INSURANCE FUNDS) - Invesco Oppenheimer V.I. Global Strategic Income Fund Series II | 170,000 | 0.00 | 1,193 | -23.88 | ||||
| 2025-08-13 | 13F | Jones Financial Companies Lllp | 0 | -100.00 | 0 | |||||
| 2025-08-14 | 13F | FIL Ltd | 0 | -100.00 | 0 | |||||
| 2025-08-14 | 13F | Qube Research & Technologies Ltd | 85,228 | 1.38 | 5,984 | -5.73 | ||||
| 2025-05-15 | 13F | Maple Rock Capital Partners Inc. | 0 | -100.00 | 0 | |||||
| 2025-08-13 | 13F | Invesco Ltd. | 14,445 | -39.89 | 1,014 | -44.10 | ||||
| 2025-08-14 | 13F | Schonfeld Strategic Advisors LLC | 0 | -100.00 | 0 | |||||
| 2025-08-13 | 13F | Measured Wealth Private Client Group, LLC | 7,365 | 517 | ||||||
| 2025-08-26 | NP | EHLS - Even Herd Long Short ETF | 7,814 | -15.29 | 549 | -21.26 | ||||
| 2025-08-14 | 13F | D. E. Shaw & Co., Inc. | Call | 16,700 | 119.74 | 1,173 | 104.54 | |||
| 2025-05-14 | 13F | Jump Financial, LLC | 0 | -100.00 | 0 | |||||
| 2025-08-13 | 13F | Oaktree Capital Management Lp | 60,591 | -76.74 | 4,254 | -78.37 | ||||
| 2025-08-14 | 13F | Susquehanna International Group, Llp | 213,240 | 453.97 | 14,972 | 415.18 | ||||
| 2025-08-14 | 13F | Susquehanna International Group, Llp | Put | 290,400 | 114.16 | 20,389 | 99.12 | |||
| 2025-08-14 | 13F | Susquehanna International Group, Llp | Call | 77,800 | -33.96 | 5,462 | -38.59 | |||
| 2025-08-01 | 13F | Shilanski & Associates, Inc. | 4,768 | -0.10 | 335 | -7.22 | ||||
| 2025-05-15 | 13F | Hood River Capital Management LLC | 0 | -100.00 | 0 | |||||
| 2025-08-07 | 13F | Monaco Asset Management SAM | 13,000 | 225.00 | 913 | 201.99 | ||||
| 2025-08-12 | 13F | Jpmorgan Chase & Co | 79,947 | 14.64 | 5,613 | 6.61 | ||||
| 2025-08-14 | 13F | Millennium Management Llc | 286,592 | 813.62 | 20,122 | 749.70 | ||||
| 2025-08-14 | 13F | TCG Advisory Services, LLC | 3,828 | 13.39 | 269 | 5.51 | ||||
| 2025-07-21 | 13F | Ping Capital Management, Inc. | 121,004 | -7.14 | 8,496 | -13.66 | ||||
| 2025-08-14 | 13F | Aquatic Capital Management LLC | 0 | -100.00 | 0 | |||||
| 2025-08-14 | 13F | Laurion Capital Management LP | 3,000 | 0.00 | 211 | -7.08 | ||||
| 2025-05-15 | 13F | Aqr Capital Management Llc | 0 | -100.00 | 0 | |||||
| 2025-08-04 | 13F | Atria Investments Llc | 7,754 | -2.17 | 544 | -9.03 | ||||
| 2025-08-13 | 13F | Amundi | 16,433 | -22.21 | 1,142 | -27.54 | ||||
| 2025-08-14 | 13F | Jane Street Group, Llc | 29,875 | 117.99 | 2,098 | 102.80 | ||||
| 2025-05-07 | 13F | Nkcfo Llc | 0 | -100.00 | 0 | |||||
| 2025-08-04 | 13F | Deuterium Capital Management, LLC | 0 | -100.00 | 0 | -100.00 | ||||
| 2025-08-14 | 13F | Jane Street Group, Llc | Put | 7,800 | 548 | |||||
| 2025-08-14 | 13F | Gemsstock Ltd. | 196,725 | -4.84 | 13,812 | -11.51 | ||||
| 2025-08-28 | NP | IDVO - Amplify International Enhanced Dividend Income ETF | 41,572 | 20.91 | 2,919 | 12.40 | ||||
| 2025-08-14 | 13F | Group One Trading, L.p. | Put | 35,400 | 218.92 | 2,485 | 196.54 | |||
| 2025-07-21 | 13F | Mirae Asset Global Investments Co., Ltd. | 0 | -100.00 | 0 | |||||
| 2025-08-14 | 13F | Group One Trading, L.p. | 11,989 | 469.82 | 842 | 432.28 | ||||
| 2025-08-04 | 13F | GAM Holding AG | 4,781 | 336 | ||||||
| 2025-08-14 | 13F | Diversify Wealth Management, Llc | 3,541 | -84.14 | 259 | -87.17 | ||||
| 2025-08-14 | 13F | Group One Trading, L.p. | Call | 30,500 | 30.34 | 2,141 | 21.23 | |||
| 2025-08-14 | 13F | Integrated Wealth Concepts LLC | 5,128 | 360 | ||||||
| 2025-04-29 | 13F | Truist Financial Corp | 0 | -100.00 | 0 | |||||
| 2025-08-14 | 13F | Goldman Sachs Group Inc | 83,393 | 24.81 | 5,855 | 16.06 | ||||
| 2025-08-05 | 13F | Simplex Trading, Llc | Call | 6,400 | 20.75 | 0 | ||||
| 2025-08-11 | 13F | Cape Ann Asset Management Ltd | 277,516 | 38.07 | 19,484 | 28.38 | ||||
| 2025-08-15 | 13F | Tower Research Capital LLC (TRC) | 40 | -86.06 | 3 | -90.48 | ||||
| 2025-08-05 | 13F | Simplex Trading, Llc | Put | 27,500 | 145.54 | 2 | ||||
| 2025-08-11 | 13F | HighTower Advisors, LLC | 0 | -100.00 | 0 | |||||
| 2025-08-05 | 13F | Simplex Trading, Llc | 20,843 | 952.68 | 1 | |||||
| 2025-08-13 | 13F | Arrowstreet Capital, Limited Partnership | 265,740 | -22.67 | 18,658 | -28.10 | ||||
| 2025-07-24 | 13F | Ronald Blue Trust, Inc. | 490 | -17.09 | 34 | -22.73 | ||||
| 2025-08-13 | 13F | Northwestern Mutual Wealth Management Co | 5 | -50.00 | 0 | |||||
| 2025-08-14 | 13F | Wells Fargo & Company/mn | 1,816 | 96.75 | 128 | 84.06 | ||||
| 2025-08-04 | 13F | Hantz Financial Services, Inc. | 334 | 6,580.00 | 0 | |||||
| 2025-05-15 | 13F | Jain Global LLC | 0 | -100.00 | 0 | |||||
| 2025-08-04 | 13F | AdvisorShares Investments LLC | 22,703 | 18.68 | 1,594 | 8.59 | ||||
| 2025-08-13 | 13F | Marshall Wace, Llp | 120,191 | 4,089.30 | 8,439 | 3,806.48 | ||||
| 2025-05-15 | 13F | Verition Fund Management LLC | 0 | -100.00 | 0 | -100.00 | ||||
| 2025-08-01 | 13F | Y-Intercept (Hong Kong) Ltd | 0 | -100.00 | 0 | |||||
| 2025-08-14 | 13F | Erste Asset Management GmbH | 10,000 | 0.00 | 716 | -8.68 | ||||
| 2025-06-30 | NP | AIM INVESTMENT FUNDS (INVESCO INVESTMENT FUNDS) - Invesco Oppenheimer International Bond Fund Class R6 | 950,000 | 0.00 | 8,506 | -20.92 | ||||
| 2025-08-14 | 13F | Vident Advisory, LLC | 0 | -100.00 | 0 | |||||
| 2025-08-14 | 13F | Citadel Advisors Llc | 61,558 | -25.80 | 4,322 | -31.02 | ||||
| 2025-08-14 | 13F | Citadel Advisors Llc | Put | 22,500 | -69.43 | 1,580 | -71.59 | |||
| 2025-08-08 | 13F | SG Americas Securities, LLC | 5,146 | 0 | ||||||
| 2025-08-14 | 13F | Citadel Advisors Llc | Call | 14,800 | 34.55 | 1,039 | 25.18 | |||
| 2025-08-11 | 13F | Lsv Asset Management | 0 | -100.00 | 0 | |||||
| 2025-08-14 | 13F | Discovery Capital Management, Llc / Ct | 23,400 | 1,643 | ||||||
| 2025-08-08 | 13F | Itau Unibanco Holding S.A. | 25,310 | 57.69 | 1,777 | 177,600.00 | ||||
| 2025-08-14 | 13F | CIBC World Markets Inc. | 0 | -100.00 | 0 | |||||
| 2025-08-08 | 13F | Larson Financial Group LLC | 31 | 2 | ||||||
| 2025-08-12 | 13F | Global Retirement Partners, LLC | 107 | 8 | ||||||
| 2025-08-01 | 13F | Envestnet Asset Management Inc | 32,747 | 16.82 | 2,299 | 8.65 | ||||
| 2025-08-05 | 13F | Claro Advisors LLC | 0 | -100.00 | 0 | |||||
| 2025-08-15 | 13F | Kestra Advisory Services, LLC | 0 | -100.00 | 0 | |||||
| 2025-05-12 | 13F | Fmr Llc | 0 | -100.00 | 0 | |||||
| 2025-08-13 | 13F | Hsbc Holdings Plc | 20,253 | -31.93 | 1,431 | -36.96 | ||||
| 2025-05-13 | 13F | Alliance Wealth Advisors, LLC /UT | 0 | -100.00 | 0 | |||||
| 2025-07-14 | 13F | GAMMA Investing LLC | 749 | -27.21 | 53 | -32.47 | ||||
| 2025-08-12 | 13F | Ci Investments Inc. | 98,392 | 41.22 | 7 | 20.00 | ||||
| 2025-05-15 | 13F | Mariner, LLC | 0 | -100.00 | 0 | |||||
| 2025-08-14 | 13F | Point72 Asia (Singapore) Pte. Ltd. | 655 | 46 | ||||||
| 2025-07-30 | NP | APIE - ActivePassive International Equity ETF | 3,876 | -20.52 | 328 | -19.85 | ||||
| 2025-07-28 | 13F | Bayforest Capital Ltd | 234 | 16 | ||||||
| 2025-08-07 | 13F | Capital Wealth Planning, LLC | 21,802 | -36.59 | 1,531 | -41.06 | ||||
| 2025-07-08 | 13F | Northwest & Ethical Investments L.P. | 0 | -100.00 | 0 | -100.00 | ||||
| 2025-07-29 | 13F | Beverly Hills Private Wealth, LLC | 4,070 | -4.46 | 286 | -11.21 | ||||
| 2025-05-27 | NP | NMMEX - Active M Emerging Markets Equity Fund | 2,285 | -67.43 | 173 | -74.63 | ||||
| 2025-08-12 | 13F | SPX Equities Gestao de Recursos Ltda | 41,483 | -49.33 | 2,913 | -52.90 | ||||
| 2025-03-26 | NP | MCYAX - MainStay Candriam Emerging Markets Equity Fund Class A | 3,200 | -65.96 | 318 | -56.73 | ||||
| 2025-07-25 | 13F | NorthRock Partners, LLC | 6,000 | 0.00 | 421 | -7.06 | ||||
| 2025-08-14 | 13F | Militia Capital Partners, LP | 0 | -100.00 | 0 | |||||
| 2025-07-25 | 13F | Allspring Global Investments Holdings, LLC | 56,568 | 0.00 | 3,972 | -7.02 | ||||
| 2025-08-06 | 13F | Titan Global Capital Management Usa Llc | 8,368 | 4.01 | 588 | -3.29 | ||||
| 2025-08-14 | 13F | Headlands Technologies LLC | 579 | -86.06 | 41 | -87.22 | ||||
| 2025-07-30 | 13F | Eqis Capital Management, Inc. | 0 | -100.00 | 0 | |||||
| 2025-08-14 | 13F | Hrt Financial Lp | 0 | -100.00 | 0 | |||||
| 2025-07-09 | 13F | Crocodile Capital Partners GmbH | 7,500 | 0.00 | 527 | -7.07 | ||||
| 2025-08-11 | 13F | TD Waterhouse Canada Inc. | 1 | 0.00 | 0 | |||||
| 2025-08-06 | 13F | Fox Run Management, L.l.c. | 4,089 | -53.68 | 287 | -56.91 | ||||
| 2025-05-28 | NP | WBENX - William Blair Emerging Markets Growth Fund Class N | 39,793 | 23.62 | 3,005 | -3.53 | ||||
| 2025-08-14 | 13F | Banco BTG Pactual S.A. | 5,850 | -86.27 | 411 | -87.25 | ||||
| 2025-08-14 | 13F | Cubist Systematic Strategies, LLC | 117,770 | 10.01 | 8,269 | 2.29 | ||||
| 2025-08-15 | 13F | Duquesne Family Office LLC | 220,900 | -48.84 | 16 | -53.12 | ||||
| 2025-08-14 | 13F | PointState Capital LP | 435,374 | 73.19 | 30,568 | 61.03 | ||||
| 2025-08-14 | 13F | Stifel Financial Corp | 15,539 | -0.36 | 1,091 | -7.39 | ||||
| 2025-08-13 | 13F | EverSource Wealth Advisors, LLC | 1,128 | -1.91 | 79 | -8.14 | ||||
| 2025-08-14 | 13F | Tudor Investment Corp Et Al | Call | 6,000 | 15.38 | 421 | 7.40 | |||
| 2025-08-19 | 13F | Marex Group plc | 14,493 | 1,018 | ||||||
| 2025-08-14 | 13F | Bnp Paribas Arbitrage, Sa | 18,337 | 65.99 | 1,287 | 54.32 | ||||
| 2025-06-23 | NP | Global Macro Absolute Return Advantage Portfolio - Global Macro Absolute Return Advantage Portfolio | 37,671 | 24.46 | 3,335 | 10.76 | ||||
| 2025-06-27 | NP | ARGT - Global X MSCI Argentina ETF This fund is a listed as child fund of Mirae Asset Global Investments Co., Ltd. and if that institution has disclosed ownership in this security, then these positions will not be double counted when calculating total shares and total value | 567,141 | -9.23 | 50,203 | -19.20 | ||||
| 2025-07-30 | 13F | Wallace Advisory Group, LLC | 0 | -100.00 | 0 | |||||
| 2025-08-14 | 13F | GWM Advisors LLC | 9,330 | 0.14 | 655 | -6.83 | ||||
| 2025-04-15 | 13F | Redhawk Wealth Advisors, Inc. | 0 | -100.00 | 0 | |||||
| 2025-07-16 | 13F | ABS Direct Equity Fund LLC | 3,695 | -9.88 | 259 | -16.18 | ||||
| 2025-08-13 | 13F | Townsquare Capital Llc | 0 | -100.00 | 0 | |||||
| 2025-08-08 | NP | QGBLX - Quantified Global Fund Investor Class | 5,653 | 397 | ||||||
| 2025-08-14 | 13F | Raymond James Financial Inc | 511 | -93.44 | 36 | -94.05 | ||||
| 2025-08-11 | 13F | Citigroup Inc | 72 | -77.85 | 5 | -79.17 | ||||
| 2025-08-14 | 13F/A | Barclays Plc | 9,718 | 67.55 | 1 | |||||
| 2025-08-14 | 13F | Barometer Capital Management Inc. | 8,871 | 11.29 | 619 | 3.00 | ||||
| 2025-08-12 | 13F | Personal Cfo Solutions, Llc | 0 | -100.00 | 0 | |||||
| 2025-08-13 | 13F | Berbice Capital Management LLC | 0 | -100.00 | 0 | |||||
| 2025-08-14 | 13F | MIRAE ASSET GLOBAL ETFS HOLDINGS Ltd. | 536,497 | -6.28 | 37,667 | -12.86 | ||||
| 2025-06-30 | NP | AIM INVESTMENT FUNDS (INVESCO INVESTMENT FUNDS) - Invesco Oppenheimer Global Strategic Income Fund Class R6 | 530,000 | 0.00 | 4,745 | -20.92 | ||||
| 2025-07-11 | 13F | Harbour Capital Advisors, LLC | 4,995 | -1.38 | 347 | -7.96 | ||||
| 2025-08-14 | 13F/A | Skopos Labs, Inc. | 1,029 | 743.44 | 72 | 700.00 | ||||
| 2025-08-11 | 13F | Principal Securities, Inc. | 0 | -100.00 | 0 | |||||
| 2025-08-12 | 13F | Atlas Capital Advisors Llc | 4,806 | 0.00 | 337 | -6.91 | ||||
| 2025-05-05 | 13F | Kestra Private Wealth Services, Llc | 0 | -100.00 | 0 | |||||
| 2025-04-28 | 13F | D.a. Davidson & Co. | 0 | -100.00 | 0 | |||||
| 2025-07-31 | 13F | Caitong International Asset Management Co., Ltd | 50 | 1,566.67 | 4 | |||||
| 2025-08-25 | NP | AADR - AdvisorShares Dorsey Wright ADR ETF | 22,703 | 18.68 | 1,594 | 10.32 | ||||
| 2025-08-06 | 13F | First Horizon Advisors, Inc. | 814 | 57 | ||||||
| 2025-08-12 | 13F | XTX Topco Ltd | 0 | -100.00 | 0 | |||||
| 2025-08-14 | 13F | Glenorchy Capital Ltd | 50,759 | -1.69 | 3,564 | -8.59 | ||||
| 2025-08-15 | 13F | Morgan Stanley | 354,414 | 71.93 | 24,883 | 59.87 | ||||
| 2025-08-05 | 13F | X-Square Capital, LLC | 5,440 | -9.33 | 0 | |||||
| 2025-07-09 | 13F | Systrade AG | 0 | -100.00 | 0 | |||||
| 2025-08-13 | 13F | Northern Trust Corp | 0 | -100.00 | 0 | |||||
| 2025-08-14 | 13F | Balyasny Asset Management Llc | 31,634 | 2,221 | ||||||
| 2025-07-16 | 13F | ORG Wealth Partners, LLC | 91 | 0.00 | 6 | 0.00 | ||||
| 2025-08-14 | 13F | Bank Of America Corp /de/ | 15,652 | 148.64 | 1,099 | 131.16 | ||||
| 2025-06-23 | NP | Global Macro Capital Opportunities Portfolio - Global Macro Capital Opportunities Portfolio | 77,755 | 45.86 | 6,883 | 29.82 | ||||
| 2025-08-14 | 13F | Turim 21 Investimentos Ltda. | 8,675 | 609 | ||||||
| 2025-08-08 | 13F | Cetera Investment Advisers | 13,925 | 3.33 | 978 | -3.93 | ||||
| 2025-08-04 | 13F | Yorktown Management & Research Co Inc | 5,100 | 0.00 | 358 | -7.01 | ||||
| 2025-08-05 | 13F | Sigma Planning Corp | 6,275 | 0.00 | 441 | -6.98 | ||||
| 2025-08-14 | 13F | Brevan Howard Capital Management LP | 90,357 | -14.34 | 6,565 | -15.93 | ||||
| 2025-08-13 | 13F | Mirabella Financial Services Llp | 0 | -100.00 | 0 | |||||
| 2025-08-08 | 13F | SBI Securities Co., Ltd. | 544 | -29.81 | 38 | -34.48 | ||||
| 2025-08-12 | 13F | LPL Financial LLC | 25,253 | 59.86 | 1,773 | 48.74 | ||||
| 2025-08-27 | NP | TIFF INVESTMENT PROGRAM - TIFF Multi-Asset Fund | Short | -46 | -3 | |||||
| 2025-08-12 | 13F | BlackRock, Inc. | 265,284 | 0.00 | 18,626 | -7.02 | ||||
| 2025-08-14 | 13F | Royal Bank Of Canada | 1,270 | -28.65 | 89 | -34.07 | ||||
| 2025-08-14 | 13F | Voloridge Investment Management, Llc | 44,775 | 3,144 | ||||||
| 2025-07-10 | 13F | TT International Asset Management LTD | 894,385 | -7.15 | 62,795 | -13.67 | ||||
| 2025-08-08 | 13F | Candriam Luxembourg S.C.A. | 0 | -100.00 | 0 | |||||
| 2025-08-14 | 13F | Caption Management, LLC | Put | 45,900 | -17.89 | 3,223 | -23.67 | |||
| 2025-08-14 | 13F | Caption Management, LLC | 41,478 | 26.00 | 2,912 | 17.18 | ||||
| 2025-08-14 | 13F | Point72 Asset Management, L.P. | 81,700 | 108.05 | 5,736 | 93.46 | ||||
| 2025-08-14 | 13F | Peak6 Llc | 0 | -100.00 | 0 | |||||
| 2025-08-13 | 13F | Walleye Capital LLC | 9,390 | 659 | ||||||
| 2025-08-14 | 13F | Peak6 Llc | Put | 0 | -100.00 | 0 | ||||
| 2025-04-16 | 13F | Byrne Asset Management LLC | 0 | -100.00 | 0 | |||||
| 2025-07-31 | 13F | Cambridge Investment Research Advisors, Inc. | 0 | -100.00 | 0 | |||||
| 2025-08-14 | 13F | Peak6 Llc | Call | 0 | -100.00 | 0 | ||||
| 2025-08-14 | 13F | UBS Group AG | 39,842 | 99.69 | 2,797 | 85.72 | ||||
| 2025-08-14 | 13F | Toroso Investments, LLC | 7,814 | -15.29 | 549 | -21.26 | ||||
| 2025-08-08 | 13F | Fiera Capital Corp | 71,498 | 5,020 | ||||||
| 2025-08-18 | 13F | Wolverine Trading, Llc | Put | 4,700 | 336 | |||||
| 2025-08-13 | 13F | Walleye Trading LLC | Call | 2,600 | 2,500.00 | 183 | 2,500.00 | |||
| 2025-08-13 | 13F | Walleye Trading LLC | Put | 81,900 | -33.58 | 5,750 | -38.24 | |||
| 2025-08-13 | 13F | Walleye Trading LLC | 76,983 | -21.47 | 5,405 | -26.98 | ||||
| 2025-08-08 | 13F | Wrapmanager Inc | 3,337 | -4.55 | 234 | -11.03 | ||||
| 2025-08-14 | 13F | Rokos Capital Management LLP | 37,683 | 0.00 | 2,645 | -6.77 | ||||
| 2025-08-11 | 13F | Dorsey Wright & Associates | 32,170 | -38.65 | 2,259 | -42.94 | ||||
| 2025-03-27 | NP | REMSX - Emerging Markets Fund Class S | 12,744 | 46.15 | 1,267 | 85.78 | ||||
| 2025-07-29 | 13F | William Blair Investment Management, Llc | 0 | -100.00 | 0 | |||||
| 2025-05-15 | 13F | Wolverine Trading, Llc | Call | 0 | -100.00 | 0 | -100.00 | |||
| 2025-07-16 | 13F | ORG Partners LLC | 71 | 57.78 | 5 | 100.00 | ||||
| 2025-05-15 | 13F | D. E. Shaw & Co., Inc. | 0 | -100.00 | 0 | -100.00 | ||||
| 2025-07-11 | 13F | Farther Finance Advisors, LLC | 52 | 85.71 | 4 | 50.00 | ||||
| 2025-08-13 | 13F | Russell Investments Group, Ltd. | 0 | -100.00 | 0 | |||||
| 2025-08-14 | 13F | Diversify Advisory Services, LLC | 0 | -100.00 | 0 | |||||
| 2025-08-13 | 13F | Quantbot Technologies LP | 3,308 | -60.67 | 232 | -63.46 | ||||
| 2025-08-25 | NP | EITEX - Parametric Tax-Managed Emerging Markets Fund Institutional Class | 1,900 | 0.00 | 133 | -6.99 | ||||
| 2025-08-12 | 13F | Virtu Financial LLC | 0 | -100.00 | 0 | |||||
| 2025-07-15 | 13F | Burns Matteson Capital Management, LLC | 3,777 | 40.99 | 265 | 31.19 | ||||
| 2025-08-12 | 13F | Sagil Capital Llp | 143,765 | 10,094 | ||||||
| 2025-05-14 | 13F | Absolute Gestao de Investimentos Ltda. | 0 | -100.00 | 0 | |||||
| 2025-08-12 | 13F | Proequities, Inc. | Put | 0 | 0 | |||||
| 2025-08-12 | 13F | Insigneo Advisory Services, Llc | 9,603 | 130.07 | 674 | 113.97 | ||||
| 2025-08-12 | 13F | Proequities, Inc. | Call | 0 | 0 | |||||
| 2025-08-12 | 13F | Proequities, Inc. | 0 | 0 | ||||||
| 2025-07-25 | 13F | Legal Advantage Investments, Inc. | 7,850 | 0.00 | 551 | -6.93 | ||||
| 2025-07-29 | 13F | Activest Wealth Management | 9,826 | -3.04 | 690 | -9.93 | ||||
| 2025-06-30 | NP | APITX - Yorktown Growth Fund Class L Shares | 5,100 | 0.00 | 451 | -11.05 |