Mga Batayang Estadistika
| Pemilik Institusional | 290 total, 281 long only, 2 short only, 7 long/short - change of -0.34% MRQ |
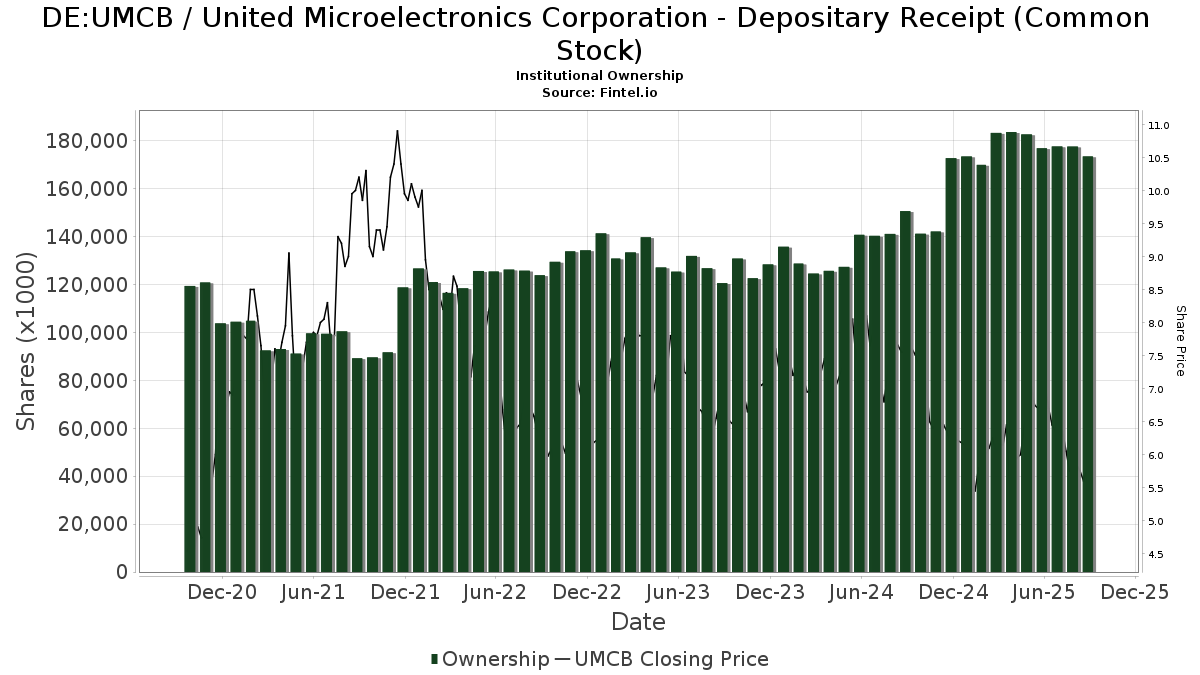
| Harga Saham | 5.85 |
| Alokasi Portofolio Rata-rata | 0.1014 % - change of -8.91% MRQ |
| Saham Institusional (Jangka Panjang) | 173,438,953 (ex 13D/G) - change of -3.43MM shares -1.94% MRQ |
| Nilai Institusional (Jangka Panjang) | $ 1,272,967 USD ($1000) |
Kepemilikan Institusional dan Pemegang Saham
United Microelectronics Corporation - Depositary Receipt (Common Stock) (DE:UMCB) memiliki 290 pemilik institusional dan pemegang saham yang telah mengajukan formulir 13D/G atau 13F kepada Komisi Bursa Efek (Securities Exchange Commission/SEC). Lembaga-lembaga ini memegang total 173,438,953 saham. Pemegang saham terbesar meliputi BlackRock, Inc., Morgan Stanley, UBS Group AG, Vanguard Group Inc, SOXX - iShares PHLX Semiconductor ETF, Rafferty Asset Management, LLC, Bank Of America Corp /de/, VEIEX - Vanguard Emerging Markets Stock Index Fund Investor Shares, SOXL - Direxion Daily Semiconductor Bull 3X Shares, and Goldman Sachs Group Inc .
Struktur kepemilikan institusional United Microelectronics Corporation - Depositary Receipt (Common Stock) (DB:UMCB) menunjukkan posisi terkini di perusahaan oleh institusi dan dana, serta perubahan terbaru dalam ukuran posisi. Pemegang saham utama dapat mencakup investor individu, reksa dana, dana lindung nilai, atau institusi. Jadwal 13D menunjukkan bahwa investor memegang (atau pernah memegang) lebih dari 5% saham perusahaan dan bermaksud (atau pernah bermaksud) untuk secara aktif mengejar perubahan strategi bisnis. Jadwal 13G menunjukkan investasi pasif lebih dari 5%.
The share price as of September 5, 2025 is 5.85 / share. Previously, on September 6, 2024, the share price was 7.60 / share. This represents a decline of 23.03% over that period.
Skor Sentimen Dana
Skor Sentimen Dana (sebelumnya dikenal sebagai Skor Akumulasi Kepemilikan) menemukan saham-saham yang paling banyak dibeli oleh dana. Ini adalah hasil dari model kuantitatif multi-faktor yang canggih yang mengidentifikasi perusahaan dengan tingkat akumulasi institusional tertinggi. Model penilaian menggunakan kombinasi dari total peningkatan pemilik yang diungkapkan, perubahan dalam alokasi portofolio pada pemilik tersebut, dan metrik lainnya. Angka berkisar dari 0 hingga 100, dengan angka yang lebih tinggi menunjukkan tingkat akumulasi yang lebih tinggi dibandingkan dengan perusahaan sejenisnya, dan 50 adalah rata-ratanya.
Frekuensi Pembaruan: Setiap Hari
Lihat Ownership Explorer, yang menyediakan daftar perusahaan dengan peringkat tertinggi.
Pengajuan 13F dan NPORT
Detail pada pengajuan 13F tersedia gratis. Detail pada pengajuan NP memerlukan keanggotaan premium. Baris berwarna hijau menunjukkan posisi baru. Baris berwarna merah menunjukkan posisi yang sudah ditutup. Klik tautan ini ikon untuk melihat riwayat transaksi selengkapnya.
Tingkatkan
untuk membuka data premium dan mengekspor ke Excel ![]() .
.
| Tanggal File | Sumber | Investor | Ketik | Presyo ng Avg (Silangan) |
Saham | Δ Saham (%) |
Dilaporkan Nilai ($1000) |
Nilai Δ (%) |
Alokasi Port (%) |
|
|---|---|---|---|---|---|---|---|---|---|---|
| 2025-08-14 | 13F | Aquatic Capital Management LLC | 0 | -100.00 | 0 | |||||
| 2025-08-18 | 13F | Geneos Wealth Management Inc. | 117 | 1 | ||||||
| 2025-08-14 | 13F | Nomura Holdings Inc | 0 | -100.00 | 0 | |||||
| 2025-08-28 | NP | GMF - SPDR(R) S&P(R) EMERGING ASIA PACIFIC ETF | 157,044 | -6.51 | 1,201 | 0.00 | ||||
| 2025-05-02 | 13F | Capital A Wealth Management, LLC | 504 | 0.00 | 4 | 0.00 | ||||
| 2025-08-27 | 13F/A | Squarepoint Ops LLC | Call | 0 | -100.00 | 0 | -100.00 | |||
| 2025-07-21 | 13F | Hennessy Advisors Inc | 14,908 | -25.82 | 114 | -20.28 | ||||
| 2025-08-08 | 13F | Wealth Alliance | 10,042 | 77 | ||||||
| 2025-08-12 | 13F | CIBC Private Wealth Group, LLC | 2,024 | 47.52 | 15 | 87.50 | ||||
| 2025-08-14 | 13F | Mml Investors Services, Llc | 10,507 | 0 | ||||||
| 2025-08-04 | 13F | Simon Quick Advisors, Llc | 22,710 | 51.17 | 174 | 61.68 | ||||
| 2025-06-26 | NP | HFIGX - Hartford Schroders Diversified Growth Fund Class I | 10,628 | 31.23 | 75 | 60.87 | ||||
| 2025-06-26 | NP | DFCEX - Emerging Markets Core Equity Portfolio - Institutional Class This fund is a listed as child fund of Dimensional Fund Advisors Lp and if that institution has disclosed ownership in this security, then these positions will not be double counted when calculating total shares and total value | 82,862 | 0.00 | 583 | 21.97 | ||||
| 2025-08-12 | 13F/A | Cozad Asset Management Inc | 12,829 | 0.00 | 98 | 7.69 | ||||
| 2025-08-14 | 13F | Old Mission Capital Llc | 0 | -100.00 | 0 | |||||
| 2025-08-13 | 13F | Russell Investments Group, Ltd. | 171 | 17,000.00 | 1 | |||||
| 2025-06-30 | NP | TRFM - AAM Transformers ETF | 21,837 | 154 | ||||||
| 2025-08-11 | 13F | Vanguard Group Inc | 14,825,471 | -5.64 | 113,415 | 0.95 | ||||
| 2025-08-14 | 13F | SIH Partners, LLLP | Put | 0 | -100.00 | 0 | ||||
| 2025-06-30 | NP | VMNVX - Vanguard Global Minimum Volatility Fund Admiral Shares | 4,743,496 | -11.55 | 33,394 | 7.73 | ||||
| 2025-07-25 | 13F | Johnson Investment Counsel Inc | 29,000 | -32.24 | 222 | -27.78 | ||||
| 2025-08-07 | 13F | Parkside Financial Bank & Trust | 1,020 | 61.90 | 8 | 75.00 | ||||
| 2025-08-14 | 13F | Ubs Asset Management Americas Inc | 25,600 | -88.09 | 196 | -87.31 | ||||
| 2025-08-14 | 13F | Atomi Financial Group, Inc. | 50,360 | 40.49 | 385 | 50.39 | ||||
| 2025-06-27 | NP | SOXL - Direxion Daily Semiconductor Bull 3X Shares | 6,757,244 | 17.13 | 47,571 | 42.66 | ||||
| 2025-08-05 | 13F | Crestwood Advisors Group LLC | 19,614 | 9.26 | 150 | 17.19 | ||||
| 2025-08-27 | 13F/A | Squarepoint Ops LLC | 148,637 | -16.61 | 1,137 | -10.75 | ||||
| 2025-08-08 | 13F | Allianz Se | 0 | -100.00 | 0 | |||||
| 2025-08-14 | 13F | CoreCap Advisors, LLC | 2,805 | 0.00 | 21 | 5.00 | ||||
| 2025-08-14 | 13F | Goldman Sachs Group Inc | 5,585,582 | -1.24 | 42,730 | 5.67 | ||||
| 2025-08-26 | NP | Profunds - Profund Vp Emerging Markets | 39,885 | 11.17 | 305 | 19.14 | ||||
| 2025-08-14 | 13F | Integrated Wealth Concepts LLC | 13,298 | 102 | ||||||
| 2025-05-15 | 13F | Wolverine Trading, Llc | Call | 0 | -100.00 | 0 | ||||
| 2025-08-13 | 13F | Jones Financial Companies Lllp | 5,262 | 43.77 | 40 | 73.91 | ||||
| 2025-08-14 | 13F | LMR Partners LLP | 0 | -100.00 | 0 | |||||
| 2025-08-14 | 13F | Symmetry Investments LP | Call | 0 | -100.00 | 0 | ||||
| 2025-04-01 | NP | CVY - Invesco Zacks Multi-Asset Income ETF This fund is a listed as child fund of Invesco Ltd. and if that institution has disclosed ownership in this security, then these positions will not be double counted when calculating total shares and total value | 137,461 | 0.09 | 795 | -15.44 | ||||
| 2025-07-21 | 13F | Ameriflex Group, Inc. | 267 | -50.74 | 2 | -33.33 | ||||
| 2025-08-13 | 13F | Quantbot Technologies LP | 7,971 | -97.28 | 61 | -97.14 | ||||
| 2025-07-17 | 13F | HB Wealth Management, LLC | 13,471 | 103 | ||||||
| 2025-04-29 | 13F | Bank of New York Mellon Corp | 0 | -100.00 | 0 | |||||
| 2025-08-13 | 13F | EverSource Wealth Advisors, LLC | 21,111 | 51.08 | 161 | 62.63 | ||||
| 2025-08-13 | 13F | Natixis Advisors, L.p. | 163,518 | -5.05 | 1 | 0.00 | ||||
| 2025-07-23 | 13F | Prime Capital Investment Advisors, LLC | 14,249 | -32.78 | 109 | -27.81 | ||||
| 2025-07-17 | 13F | Clean Yield Group | 218 | 0.00 | 2 | 0.00 | ||||
| 2025-08-11 | 13F | Frank, Rimerman Advisors LLC | 62,082 | 475 | ||||||
| 2025-05-15 | 13F | Angeles Investment Advisors, LLC | 0 | -100.00 | 0 | |||||
| 2025-08-05 | 13F | Key FInancial Inc | 1,200 | 0.00 | 9 | 12.50 | ||||
| 2025-05-14 | 13F | Fisher Asset Management, LLC | 0 | -100.00 | 0 | |||||
| 2025-08-14 | 13F | Axa S.a. | 63,004 | 0.00 | 482 | 6.89 | ||||
| 2025-08-12 | 13F | Coldstream Capital Management Inc | 0 | -100.00 | 0 | |||||
| 2025-08-13 | 13F | Invesco Ltd. | 87,636 | -23.66 | 670 | -18.29 | ||||
| 2025-08-12 | 13F | SRS Capital Advisors, Inc. | 1,293 | 10 | ||||||
| 2025-08-13 | 13F | Guggenheim Capital Llc | 350,382 | -5.26 | 2,680 | 1.36 | ||||
| 2025-08-14 | 13F | Jain Global LLC | 49,197 | 376 | ||||||
| 2025-05-15 | 13F | MIRAE ASSET GLOBAL ETFS HOLDINGS Ltd. | 0 | -100.00 | 0 | |||||
| 2025-08-14 | 13F | SIH Partners, LLLP | Call | 0 | -100.00 | 0 | ||||
| 2025-08-13 | 13F | Jump Financial, LLC | 0 | -100.00 | 0 | |||||
| 2025-07-22 | 13F | Carolina Wealth Advisors, LLC | 30 | 0 | ||||||
| 2025-08-14 | 13F | Optiver Holding B.V. | 1 | 0 | ||||||
| 2025-07-31 | 13F | Nisa Investment Advisors, Llc | 500 | 0.00 | 4 | 33.33 | ||||
| 2025-07-24 | 13F | Callan Family Office, LLC | 54,754 | 406.79 | 419 | 442.86 | ||||
| 2025-08-13 | 13F | Bollard Group LLC | 0 | -100.00 | 0 | |||||
| 2025-08-27 | NP | RYWTX - Emerging Markets 2x Strategy Fund Class A | 12,432 | 147.90 | 95 | 171.43 | ||||
| 2025-05-13 | 13F | Arrowpoint Investment Partners (Singapore) Pte. Ltd. | 0 | -100.00 | 0 | |||||
| 2025-08-13 | 13F | Arrowstreet Capital, Limited Partnership | 317,271 | 2,427 | ||||||
| 2025-08-14 | 13F | Hrt Financial Lp | 0 | -100.00 | 0 | |||||
| 2025-07-14 | 13F | Abound Wealth Management | 160 | 0.00 | 1 | 0.00 | ||||
| 2025-08-14 | 13F | Man Group plc | 19,346 | -90.33 | 148 | -89.72 | ||||
| 2025-07-24 | 13F | PDS Planning, Inc | 70,758 | 3.49 | 541 | 10.86 | ||||
| 2025-07-25 | 13F | Sequoia Financial Advisors, LLC | 176,603 | 29.43 | 1,351 | 38.56 | ||||
| 2025-07-28 | 13F | Kiker Wealth Management, LLC | 670 | 0.00 | 5 | 25.00 | ||||
| 2025-08-12 | 13F | Park Square Financial Group, LLC | 524 | 0.00 | 4 | 33.33 | ||||
| 2025-08-14 | 13F | Jane Street Group, Llc | Call | 0 | -100.00 | 0 | ||||
| 2025-08-14 | 13F | Jane Street Group, Llc | 0 | -100.00 | 0 | |||||
| 2025-08-14 | 13F | Millennium Management Llc | 58,780 | -99.26 | 450 | -99.20 | ||||
| 2025-05-14 | 13F | KilterHowling LLC | 0 | -100.00 | 0 | |||||
| 2025-07-18 | 13F | BSW Wealth Partners | 35,482 | -3.36 | 271 | 3.44 | ||||
| 2025-07-28 | 13F | BRYN MAWR TRUST Co | 325 | 0.00 | 2 | 0.00 | ||||
| 2025-07-11 | 13F | Viking Fund Management Llc | 12,000 | 92 | ||||||
| 2025-08-12 | 13F | Enterprise Financial Services Corp | 12,008 | 92 | ||||||
| 2025-08-12 | 13F | MAI Capital Management | 21,104 | 6,934.67 | 161 | 7,950.00 | ||||
| 2025-08-25 | 13F/A | Neuberger Berman Group LLC | 62,104 | 475 | ||||||
| 2025-08-27 | NP | RYDEX VARIABLE TRUST - Electronics Fund Variable Annuity | 14,808 | -61.56 | 113 | -58.91 | ||||
| 2025-08-14 | 13F | Ameriprise Financial Inc | 30,574 | -2.34 | 245 | 9.42 | ||||
| 2025-07-28 | NP | NSI - National Security Emerging Markets Index ETF | 29,978 | 38.48 | 228 | 64.03 | ||||
| 2025-08-13 | 13F | Walleye Trading LLC | Put | 23,100 | -93.35 | 177 | -92.91 | |||
| 2025-08-14 | 13F | Vident Advisory, LLC | 569,810 | 50.83 | 4,359 | 61.38 | ||||
| 2025-08-29 | NP | MPLAX - Praxis International Index Fund Class A | 177,976 | -10.76 | 1,362 | -4.49 | ||||
| 2025-04-28 | 13F | Vontobel Holding Ltd. | 0 | -100.00 | 0 | |||||
| 2025-08-12 | 13F | Ameritas Investment Partners, Inc. | 2 | 0.00 | 0 | |||||
| 2025-08-14 | 13F/A | Barclays Plc | 5,257,834 | 43.33 | 40 | 53.85 | ||||
| 2025-05-15 | 13F | Laird Norton Trust Company, Llc | 0 | -100.00 | 0 | |||||
| 2025-07-23 | 13F | Canopy Partners, LLC | 24,325 | -9.17 | 186 | -2.62 | ||||
| 2025-05-15 | 13F | Gts Securities Llc | 0 | -100.00 | 0 | |||||
| 2025-08-14 | 13F | Stifel Financial Corp | 126,016 | -0.50 | 964 | 6.52 | ||||
| 2025-08-13 | 13F | First Trust Advisors Lp | 112,176 | -17.81 | 858 | -12.00 | ||||
| 2025-08-14 | 13F | Fmr Llc | 220,351 | -60.04 | 1,686 | -57.26 | ||||
| 2025-08-11 | 13F | Principal Securities, Inc. | 367 | 28.32 | 3 | 100.00 | ||||
| 2025-08-13 | 13F | Marshall Wace, Llp | 0 | -100.00 | 0 | |||||
| 2025-07-21 | 13F | Mirae Asset Global Investments Co., Ltd. | 1,031 | 8 | ||||||
| 2025-08-12 | 13F | Global Retirement Partners, LLC | 10,457 | 1.69 | 80 | 19.70 | ||||
| 2025-08-12 | 13F | Proequities, Inc. | Put | 0 | 0 | |||||
| 2025-08-12 | 13F | Proequities, Inc. | Call | 0 | 0 | |||||
| 2025-08-12 | 13F | Proequities, Inc. | 0 | 0 | ||||||
| 2025-08-14 | 13F | Henry James International Management Inc. | 14,000 | 0.50 | 107 | 8.08 | ||||
| 2025-05-15 | 13F | Qube Research & Technologies Ltd | 0 | -100.00 | 0 | |||||
| 2025-08-14 | 13F | Federation des caisses Desjardins du Quebec | 2,500 | 25.00 | 19 | 35.71 | ||||
| 2025-08-01 | 13F | Ashton Thomas Private Wealth, LLC | 0 | -100.00 | 0 | |||||
| 2025-08-01 | 13F | Bessemer Group Inc | 12,515 | 0.00 | 0 | |||||
| 2025-08-13 | 13F | West Family Investments, Inc. | 187,696 | 37.23 | 1,436 | 46.88 | ||||
| 2025-08-14 | 13F | State Street Corp | 4,292,954 | 8.22 | 34,449 | 21.46 | ||||
| 2025-08-14 | 13F | Scientech Research LLC | 0 | -100.00 | 0 | |||||
| 2025-08-12 | 13F | BlackRock, Inc. | 24,317,060 | 6.67 | 186,026 | 14.13 | ||||
| 2025-08-14 | 13F/A | Skopos Labs, Inc. | 40,994 | 186.37 | 314 | 206.86 | ||||
| 2025-07-24 | 13F | Us Bancorp \de\ | 266,887 | 1.87 | 2,042 | 8.97 | ||||
| 2025-08-04 | 13F | Atria Investments Llc | 20,404 | -0.42 | 156 | 6.85 | ||||
| 2025-08-07 | 13F | Sierra Ocean, Llc | 731 | -16.84 | 6 | -16.67 | ||||
| 2025-08-14 | 13F | Prestige Wealth Management Group LLC | 661 | 0.00 | 5 | 25.00 | ||||
| 2025-05-09 | 13F | Headlands Technologies LLC | 0 | -100.00 | 0 | |||||
| 2025-08-14 | 13F | Millennium Management Llc | Call | 0 | -100.00 | 0 | -100.00 | |||
| 2025-08-13 | 13F | Walleye Capital LLC | Call | 0 | -100.00 | 0 | -100.00 | |||
| 2025-08-13 | 13F | Twin Peaks Wealth Advisors, LLC | 323 | 2 | ||||||
| 2025-07-15 | 13F | Ballentine Partners, LLC | 183,254 | 16.11 | 1,402 | 24.20 | ||||
| 2025-08-06 | 13F | Golden State Wealth Management, LLC | 0 | -100.00 | 0 | |||||
| 2025-08-14 | 13F | Ancora Advisors, LLC | 381 | 3 | ||||||
| 2025-07-16 | 13F | Signaturefd, Llc | 232,860 | 6.33 | 1,781 | 13.80 | ||||
| 2025-07-31 | 13F | Caitong International Asset Management Co., Ltd | 0 | -100.00 | 0 | |||||
| 2025-04-29 | 13F | Lee Danner & Bass Inc | 0 | -100.00 | 0 | |||||
| 2025-08-06 | 13F | Valued Wealth Advisors LLC | 423 | 0.00 | 3 | 0.00 | ||||
| 2025-08-14 | 13F | Colony Group, LLC | 16,417 | 22.12 | 126 | 30.21 | ||||
| 2025-05-15 | 13F | Graham Capital Management, L.P. | 0 | -100.00 | 0 | |||||
| 2025-08-12 | 13F | LPL Financial LLC | 58,489 | -5.46 | 447 | 1.13 | ||||
| 2025-08-15 | 13F | CI Private Wealth, LLC | 320,301 | 83.51 | 2,450 | 96.47 | ||||
| 2025-08-13 | 13F | Quadrant Capital Group Llc | 397,602 | 154.54 | 3,042 | 172.49 | ||||
| 2025-07-17 | 13F | CogentBlue Wealth Advisors, LLC | 10,372 | -50.04 | 79 | -46.62 | ||||
| 2025-08-14 | 13F | Susquehanna International Group, Llp | 360,128 | -45.58 | 2,755 | -41.79 | ||||
| 2025-06-30 | NP | VT - Vanguard Total World Stock Index Fund ETF Shares | 51,487 | 0.00 | 362 | 21.89 | ||||
| 2025-08-12 | 13F | Dimensional Fund Advisors Lp | 1,743,615 | 21.75 | 13,339 | 30.27 | ||||
| 2025-08-14 | 13F | Susquehanna International Group, Llp | Call | 20,900 | -94.02 | 160 | -93.63 | |||
| 2025-08-14 | 13F | Susquehanna International Group, Llp | Put | 166,300 | 351.90 | 1,272 | 383.65 | |||
| 2025-08-13 | 13F | Walleye Capital LLC | Put | 51,200 | 25,500.00 | 392 | 39,000.00 | |||
| 2025-08-13 | 13F | Walleye Capital LLC | 688 | -99.05 | 5 | -99.03 | ||||
| 2025-05-12 | 13F | Aigen Investment Management, Lp | 0 | -100.00 | 0 | |||||
| 2025-06-27 | NP | SOXY - YieldMax(TM) Target 12(TM) Semiconductor Option Income ETF | 4,190 | 25.00 | 29 | 52.63 | ||||
| 2025-07-22 | 13F | Valeo Financial Advisors, LLC | 10,683 | 82 | ||||||
| 2025-08-08 | 13F/A | Ignite Planners, LLC | 113,172 | 1.56 | 847 | 8.32 | ||||
| 2025-08-14 | 13F | Banque Transatlantique SA | 0 | -100.00 | 0 | |||||
| 2025-08-13 | 13F | Schroder Investment Management Group | 4,237,787 | -1.45 | 32,419 | 15.10 | ||||
| 2025-05-01 | 13F | Bleakley Financial Group, LLC | 0 | -100.00 | 0 | -100.00 | ||||
| 2025-07-11 | 13F/A | Umb Bank N A/mo | 1,725 | 0.00 | 13 | 8.33 | ||||
| 2025-07-29 | 13F | Private Trust Co Na | 0 | -100.00 | 0 | |||||
| 2025-04-30 | 13F | Banque Pictet & Cie Sa | 0 | -100.00 | 0 | |||||
| 2025-08-15 | 13F | Morgan Stanley | 21,814,127 | 21.18 | 166,878 | 29.65 | ||||
| 2025-04-22 | NP | GINN - Goldman Sachs Innovate Equity ETF | 45,381 | -8.07 | 293 | -12.31 | ||||
| 2025-05-15 | 13F | DZ BANK AG Deutsche Zentral Genossenschafts Bank, Frankfurt am Main | 0 | -100.00 | 0 | |||||
| 2025-08-14 | 13F | Two Sigma Advisers, Lp | 11,700 | -96.64 | 90 | -96.42 | ||||
| 2025-08-14 | 13F | GWM Advisors LLC | 700 | 0.00 | 5 | 0.00 | ||||
| 2025-07-24 | 13F | Jfs Wealth Advisors, Llc | 2,826 | 0.00 | 22 | 5.00 | ||||
| 2025-05-05 | 13F | Lindbrook Capital, Llc | 28,053 | 12.30 | 201 | 23.46 | ||||
| 2025-05-08 | 13F | Harbour Investments, Inc. | 0 | -100.00 | 0 | |||||
| 2025-07-14 | 13F | Abacus Wealth Partners, LLC | 23,169 | 177 | ||||||
| 2025-06-30 | NP | VGTSX - Vanguard Total International Stock Index Fund Investor Shares | 1,006,015 | 0.00 | 7,082 | 21.81 | ||||
| 2025-08-14 | 13F | Rafferty Asset Management, LLC | 8,403,064 | 50.68 | 64,283 | 61.22 | ||||
| 2025-08-12 | 13F | Steward Partners Investment Advisory, Llc | 9 | 0 | ||||||
| 2025-06-30 | NP | VEIEX - Vanguard Emerging Markets Stock Index Fund Investor Shares | 6,767,268 | -4.92 | 47,642 | 15.81 | ||||
| 2025-07-15 | 13F | Foster Victor Wealth Advisors, LLC | 23,578 | -2.06 | 182 | 9.70 | ||||
| 2025-08-13 | 13F | Walleye Trading LLC | 0 | -100.00 | 0 | -100.00 | ||||
| 2025-08-13 | 13F | Walleye Trading LLC | Call | 0 | -100.00 | 0 | -100.00 | |||
| 2025-05-15 | 13F | Bayesian Capital Management, LP | 0 | -100.00 | 0 | |||||
| 2025-08-11 | 13F | Citigroup Inc | 3,727,817 | -38.19 | 28,518 | -33.86 | ||||
| 2025-08-14 | 13F | Xponance, Inc. | 17,665 | 0.93 | 135 | 8.00 | ||||
| 2025-08-07 | 13F | Hennion & Walsh Asset Management, Inc. | 160,373 | -12.49 | 1,227 | -6.41 | ||||
| 2025-08-14 | 13F | Smartleaf Asset Management LLC | 3,574 | 27 | ||||||
| 2025-07-31 | 13F | Buckingham Strategic Partners | 24,685 | -33.24 | 189 | -28.79 | ||||
| 2025-08-29 | NP | FRDM - Freedom 100 Emerging Markets ETF | 1,191,434 | 16.76 | 9,114 | 24.92 | ||||
| 2025-05-14 | 13F | Credit Agricole S A | 210 | 0.00 | 2 | 0.00 | ||||
| 2025-08-13 | 13F | Victory Capital Management Inc | 104,945 | 0.00 | 803 | 6.93 | ||||
| 2025-06-27 | NP | SPTE - SP Funds S&P Global Technology ETF | 63,394 | -37.72 | 446 | -24.15 | ||||
| 2025-07-08 | 13F | Parallel Advisors, LLC | 132,375 | 17.06 | 1,013 | 25.56 | ||||
| 2025-08-14 | 13F | Toroso Investments, LLC | 110,375 | 24.76 | 844 | 33.54 | ||||
| 2025-06-30 | NP | VEU - Vanguard FTSE All-World ex-US Index Fund ETF Shares | 2,283,026 | 0.00 | 16,073 | 21.80 | ||||
| 2025-08-14 | 13F | Wells Fargo & Company/mn | 5,800 | 74.54 | 44 | 91.30 | ||||
| 2025-08-04 | 13F | Creekmur Asset Management LLC | 1 | 0.00 | 0 | |||||
| 2025-08-01 | 13F | Y-Intercept (Hong Kong) Ltd | 970,407 | 84.38 | 7,424 | 97.26 | ||||
| 2025-08-14 | 13F | KADENSA CAPITAL Ltd | 1,335,392 | 13.63 | 10,216 | 21.58 | ||||
| 2025-08-14 | 13F | Royal Bank Of Canada | 11,471 | 118.70 | 87 | 128.95 | ||||
| 2025-07-14 | 13F | UMA Financial Services, Inc. | 375 | 86.57 | 3 | 100.00 | ||||
| 2025-08-08 | 13F | Larson Financial Group LLC | 745 | 6 | ||||||
| 2025-07-30 | 13F | Ethic Inc. | 343,574 | -0.01 | 2,639 | 10.01 | ||||
| 2025-05-14 | 13F | Groupama Asset Managment | 0 | -100.00 | 0 | |||||
| 2025-08-08 | 13F | Candriam Luxembourg S.C.A. | 28,764 | 0.00 | 220 | 7.32 | ||||
| 2025-08-07 | 13F | Profund Advisors Llc | 122,831 | 2.61 | 940 | 9.82 | ||||
| 2025-07-29 | NP | RBB FUND, INC. - Aquarius International Fund | 36,418 | 0.00 | 277 | 18.38 | ||||
| 2025-08-08 | 13F | Creative Planning | 1,689,542 | 33.98 | 12,925 | 43.35 | ||||
| 2025-07-28 | 13F | Moran Wealth Management, LLC | 672,124 | 1.63 | 5,142 | 8.74 | ||||
| 2025-08-12 | 13F | Mizuho Securities Co. Ltd. | 501 | 4 | ||||||
| 2025-08-06 | 13F | Savant Capital, LLC | 29,336 | 224 | ||||||
| 2025-08-28 | NP | SPGM - SPDR(R) Portfolio MSCI Global Stock Market ETF | 85,532 | 2.96 | 654 | 10.29 | ||||
| 2025-07-11 | 13F | Farther Finance Advisors, LLC | 4,240 | -14.86 | 32 | -5.88 | ||||
| 2025-08-12 | 13F | Advisors Asset Management, Inc. | 235,539 | 10.30 | 1,802 | 18.02 | ||||
| 2025-08-14 | 13F | Wetherby Asset Management Inc | 326,804 | 12.33 | 2,502 | 32.47 | ||||
| 2025-07-31 | 13F | Resonant Capital Advisors, LLC | 14,592 | 119 | ||||||
| 2025-08-12 | 13F | Clear Street Markets Llc | Put | 200 | 2 | |||||
| 2025-08-12 | 13F | Clear Street Markets Llc | 5,600 | 43 | ||||||
| 2025-08-14 | 13F | Silvercrest Asset Management Group Llc | 0 | -100.00 | 0 | |||||
| 2025-07-22 | 13F | Valley National Advisers Inc | 0 | -100.00 | 0 | |||||
| 2025-03-28 | NP | HAOSX - Harbor Overseas Fund Institutional Class | 52,590 | -26.82 | 304 | -38.29 | ||||
| 2025-08-08 | 13F | Mitsubishi UFJ Trust & Banking Corp | 10,300 | 79 | ||||||
| 2025-08-13 | 13F | Capital Fund Management S.a. | 35,800 | 274 | ||||||
| 2025-07-25 | 13F | LRI Investments, LLC | 364 | 0.00 | 3 | 0.00 | ||||
| 2025-06-26 | NP | DEXC - Dimensional Emerging Markets ex China Core Equity ETF | 76,000 | 18.75 | 535 | 44.99 | ||||
| 2025-05-15 | 13F | CAPROCK Group, Inc. | 115,769 | -10.28 | 828 | -1.19 | ||||
| 2025-07-30 | NP | AIS - VistaShares Artificial Intelligence Supercycle ETF | 4,991 | 187.50 | 38 | 236.36 | ||||
| 2025-08-04 | 13F | Migdal Insurance & Financial Holdings Ltd. | 0 | -100.00 | 0 | |||||
| 2025-08-05 | 13F | NewSquare Capital LLC | 1,052 | -10.09 | 8 | 0.00 | ||||
| 2025-08-11 | 13F | EntryPoint Capital, LLC | 18,812 | -3.71 | 144 | 2.88 | ||||
| 2025-08-12 | 13F | Jpmorgan Chase & Co | Call | 0 | -100.00 | 0 | -100.00 | |||
| 2025-08-01 | 13F | Envestnet Asset Management Inc | 90,114 | -4.23 | 689 | 2.53 | ||||
| 2025-06-26 | NP | SGIDX - Steward Global Equity Income Fund Class A | 541,403 | 8.58 | 3,811 | 32.23 | ||||
| 2025-05-08 | 13F | Waldron Private Wealth LLC | 0 | -100.00 | 0 | |||||
| 2025-08-14 | 13F | Bnp Paribas Arbitrage, Sa | Call | 0 | -100.00 | 0 | ||||
| 2025-06-26 | NP | DFAE - Dimensional Emerging Core Equity Market ETF | 357,000 | 4.08 | 2,513 | 26.79 | ||||
| 2025-08-12 | 13F | Prudential Financial Inc | 23,570 | 0.00 | 180 | 7.14 | ||||
| 2025-08-28 | NP | SPEM - SPDR(R) Portfolio Emerging Markets ETF | 3,729,594 | 8.86 | 28,531 | 16.47 | ||||
| 2025-05-16 | 13F | Coppell Advisory Solutions LLC | 0 | -100.00 | 0 | |||||
| 2025-07-24 | 13F | IFP Advisors, Inc | 535 | 25.59 | 4 | 33.33 | ||||
| 2025-08-14 | 13F | Farringdon Capital, Ltd. | 22,816 | 175 | ||||||
| 2025-08-14 | 13F | Glenmede Investment Management, LP | 27,705 | 212 | ||||||
| 2025-08-14 | 13F | D. E. Shaw & Co., Inc. | 477,789 | -30.38 | 3,655 | -25.50 | ||||
| 2025-08-14 | 13F | Mercer Global Advisors Inc /adv | 43,028 | -5.80 | 329 | 0.92 | ||||
| 2025-08-11 | 13F | Pinnacle Wealth Planning Services, Inc. | 25,754 | -22.00 | 197 | -16.53 | ||||
| 2025-03-31 | NP | GIAX - Nicholas Global Equity and Income ETF | 138,029 | 112.27 | 798 | 79.50 | ||||
| 2025-08-07 | 13F | Aviva Plc | 13,807 | 0.00 | 106 | 7.14 | ||||
| 2025-08-06 | 13F | Commonwealth Equity Services, Llc | 16,120 | -14.72 | 0 | |||||
| 2025-08-12 | 13F | O'shaughnessy Asset Management, Llc | 385,531 | 25.03 | 2,949 | 33.80 | ||||
| 2025-07-22 | 13F | IMC-Chicago, LLC | Call | 0 | -100.00 | 0 | -100.00 | |||
| 2025-08-13 | 13F | Cerity Partners LLC | 242,862 | -25.09 | 1,859 | -19.84 | ||||
| 2025-08-14 | 13F | UBS Group AG | 16,888,821 | 9.34 | 129,199 | 16.98 | ||||
| 2025-08-14 | 13F | UBS Group AG | Call | 50,000 | 382 | |||||
| 2025-08-11 | 13F | Bell Investment Advisors, Inc | 1,176 | 72.18 | 9 | 100.00 | ||||
| 2025-07-25 | 13F | JustInvest LLC | 365,708 | 31.80 | 2,798 | 41.05 | ||||
| 2025-07-25 | 13F | Allspring Global Investments Holdings, LLC | 13,281 | -95.19 | 101 | -94.76 | ||||
| 2025-07-30 | NP | APIE - ActivePassive International Equity ETF | 167,502 | -19.75 | 1,275 | -5.35 | ||||
| 2025-08-13 | 13F | Safe Harbor Fiduciary, LLC | 300 | 0.00 | 2 | 0.00 | ||||
| 2025-05-15 | 13F | Bridgefront Capital, LLC | 0 | -100.00 | 0 | |||||
| 2025-08-14 | 13F | Aqr Capital Management Llc | 1,445,478 | 0.69 | 11,058 | 7.73 | ||||
| 2025-07-18 | 13F | Generali Investments CEE, investicni spolecnost, a.s. | 170,779 | 0.00 | 1,306 | 6.96 | ||||
| 2025-07-17 | 13F | Greenleaf Trust | 150,786 | 0.71 | 1,154 | 7.76 | ||||
| 2025-08-04 | 13F | Assetmark, Inc | 680 | 5 | ||||||
| 2025-08-05 | 13F | GPS Wealth Strategies Group, LLC | 768 | 0.00 | 6 | 0.00 | ||||
| 2025-08-11 | 13F | Inspire Advisors, LLC | 18,355 | -5.57 | 140 | 1.45 | ||||
| 2025-08-14 | 13F | Beaird Harris Wealth Management, LLC | 1,000 | 0.00 | 8 | 0.00 | ||||
| 2025-08-07 | 13F | Vise Technologies, Inc. | 192,714 | 614.05 | 1,474 | 742.29 | ||||
| 2025-08-11 | 13F | HighTower Advisors, LLC | 22,054 | -26.87 | 169 | -21.86 | ||||
| 2025-08-29 | NP | SA FUNDS INVESTMENT TRUST - SA Emerging Markets Value Fund | 56,252 | 0.00 | 430 | 6.97 | ||||
| 2025-08-12 | 13F | Pathstone Holdings, LLC | 99,535 | 10.49 | 766 | 18.79 | ||||
| 2025-08-08 | 13F | SBI Securities Co., Ltd. | 11,958 | -1.84 | 91 | 4.60 | ||||
| 2025-06-30 | 13F/A | Deutsche Bank Ag\ | 0 | -100.00 | 0 | |||||
| 2025-07-25 | 13F | Cwm, Llc | 19,213 | -6.41 | 0 | |||||
| 2025-08-14 | 13F | Group One Trading, L.p. | Put | 100 | -97.22 | 1 | -100.00 | |||
| 2025-08-14 | 13F | Group One Trading, L.p. | Call | 73,600 | -69.97 | 563 | -67.87 | |||
| 2025-08-13 | 13F | Northwestern Mutual Wealth Management Co | 1,956 | 15 | ||||||
| 2025-08-19 | 13F | Asset Dedication, LLC | 0 | -100.00 | 0 | |||||
| 2025-08-28 | NP | SOXX - iShares PHLX Semiconductor ETF | 11,448,043 | 0.88 | 87,578 | 7.93 | ||||
| 2025-08-14 | 13F | Group One Trading, L.p. | 521 | 4 | ||||||
| 2025-08-15 | 13F | Tower Research Capital LLC (TRC) | 6,344 | -89.04 | 49 | -88.38 | ||||
| 2025-05-14 | 13F | Renaissance Technologies Llc | 0 | -100.00 | 0 | |||||
| 2025-08-14 | 13F | Aprio Wealth Management, LLC | 22,584 | -2.64 | 173 | 4.24 | ||||
| 2025-08-26 | NP | Profunds - Profund Vp Asia 30 | 68,097 | -7.23 | 521 | -0.76 | ||||
| 2025-08-05 | 13F | Redwood Wealth Management Group, LLC | 36,671 | -9.16 | 281 | -2.78 | ||||
| 2025-08-14 | 13F | Schonfeld Strategic Advisors LLC | 134,341 | -57.36 | 1,028 | -54.40 | ||||
| 2025-08-14 | 13F | Bank Of America Corp /de/ | 7,044,452 | -11.71 | 53,890 | -5.54 | ||||
| 2025-07-25 | 13F | Yousif Capital Management, Llc | 39,941 | 5.84 | 306 | 13.38 | ||||
| 2025-04-24 | 13F | Diversified Trust Co | 0 | -100.00 | 0 | |||||
| 2025-07-14 | 13F | GAMMA Investing LLC | 13,164 | 8.72 | 101 | 16.28 | ||||
| 2025-07-31 | 13F | R Squared Ltd | 0 | -100.00 | 0 | |||||
| 2025-08-12 | 13F | Legal & General Group Plc | 14,134 | 108 | ||||||
| 2025-08-14 | 13F | Sculptor Capital LP | Put | 0 | -100.00 | 0 | ||||
| 2025-08-08 | 13F | Cetera Investment Advisers | 20,211 | 1.75 | 155 | 8.45 | ||||
| 2025-08-14 | 13F | CIBC World Markets Inc. | 17,732 | 19.75 | 136 | 28.57 | ||||
| 2025-08-14 | 13F | Engineers Gate Manager LP | 0 | -100.00 | 0 | |||||
| 2025-08-14 | 13F | Sculptor Capital LP | 0 | -100.00 | 0 | |||||
| 2025-08-13 | 13F | Mackenzie Financial Corp | 72,734 | -64.36 | 556 | -61.89 | ||||
| 2025-05-01 | 13F | Genesis Investment Management, LLP | 0 | -100.00 | 0 | |||||
| 2025-07-09 | 13F | Sivia Capital Partners, LLC | 29,408 | 25.78 | 225 | 34.13 | ||||
| 2025-07-25 | 13F | Atria Wealth Solutions, Inc. | 23,550 | 87.65 | 187 | 108.99 | ||||
| 2025-08-04 | 13F | Hantz Financial Services, Inc. | 21,456 | 2,160.91 | 0 | |||||
| 2025-08-29 | 13F | Infini Capital Management Ltd | 0 | -100.00 | 0 | |||||
| 2025-08-12 | 13F | Jpmorgan Chase & Co | 1,668,846 | 33.27 | 12,767 | 42.59 | ||||
| 2025-08-14 | 13F | Sei Investments Co | 72,599 | 20.20 | 555 | 28.77 | ||||
| 2025-08-14 | 13F | Citadel Advisors Llc | Call | 27,700 | -5.78 | 212 | 0.48 | |||
| 2025-08-14 | 13F | Citadel Advisors Llc | Put | 64,200 | 13.63 | 491 | 21.84 | |||
| 2025-06-26 | NP | SNTKX - Steward International Enhanced Index Fund Class A | 136,133 | 0.00 | 958 | 21.88 | ||||
| 2025-08-14 | 13F | Verition Fund Management LLC | 62,081 | -76.45 | 475 | -74.84 | ||||
| 2025-08-14 | 13F | Quantinno Capital Management LP | 346,994 | 37.44 | 2,655 | 47.04 | ||||
| 2025-07-11 | 13F | Annex Advisory Services, LLC | 0 | -100.00 | 0 | |||||
| 2025-08-14 | 13F | Citadel Advisors Llc | 592,879 | -77.23 | 4,536 | -75.64 | ||||
| 2025-07-28 | 13F | Bayforest Capital Ltd | 19,329 | 148 | ||||||
| 2025-05-02 | 13F | Apollon Wealth Management, LLC | 0 | -100.00 | 0 | |||||
| 2025-05-06 | 13F | Venturi Wealth Management, LLC | 0 | -100.00 | 0 | |||||
| 2025-05-14 | 13F | Boston Private Wealth Llc | 0 | -100.00 | 0 | |||||
| 2025-07-30 | 13F | FNY Investment Advisers, LLC | 1,400 | 0 | ||||||
| 2025-07-16 | 13F | Highline Wealth Partners Llc | 725 | 16.56 | 6 | 25.00 | ||||
| 2025-08-11 | 13F | Lsv Asset Management | 565,611 | -2.09 | 4 | 0.00 | ||||
| 2025-08-13 | 13F | Baird Financial Group, Inc. | 525,406 | -2.91 | 4,019 | 3.88 | ||||
| 2025-07-23 | 13F | High Note Wealth, LLC | 28 | 0.00 | 0 | |||||
| 2025-08-13 | 13F | BCJ Capital Management, LLC | 11,246 | 86 | ||||||
| 2025-09-04 | 13F/A | Advisor Group Holdings, Inc. | 14,756 | 11.45 | 113 | 19.15 | ||||
| 2025-07-24 | 13F | Leo Wealth, LLC | 14,471 | 32.02 | 111 | 41.03 | ||||
| 2025-08-11 | 13F | Brown Brothers Harriman & Co | 558 | 4 | ||||||
| 2025-05-14 | 13F | Van Hulzen Asset Management, LLC | 0 | -100.00 | 0 | |||||
| 2025-08-05 | 13F | Bridgewater Advisors Inc. | 75,594 | -2.19 | 538 | 0.75 | ||||
| 2025-06-26 | NP | DFEM - Dimensional Emerging Markets Core Equity 2 ETF | 188,000 | 2.17 | 1,324 | 24.46 | ||||
| 2025-07-31 | 13F | Cambridge Investment Research Advisors, Inc. | 76,135 | -0.43 | 1 | |||||
| 2025-08-08 | 13F | Crossmark Global Holdings, Inc. | 1,281,177 | 1.85 | 9,801 | 8.98 | ||||
| 2025-08-07 | 13F | Acadian Asset Management Llc | 314,993 | 93.97 | 2 | 100.00 | ||||
| 2025-05-01 | 13F | Schechter Investment Advisors, LLC | 15,635 | -25.62 | 112 | -18.38 | ||||
| 2025-07-25 | 13F | Natural Investments, Llc | 16,309 | 41.66 | 0 | |||||
| 2025-07-21 | 13F | Ascent Group, LLC | 18,153 | 139 | ||||||
| 2025-06-26 | NP | Dfa Investment Trust Co - The Emerging Markets Series This fund is a listed as child fund of Dimensional Fund Advisors Lp and if that institution has disclosed ownership in this security, then these positions will not be double counted when calculating total shares and total value | 59,082 | 0.00 | 416 | 21.70 | ||||
| 2025-07-14 | 13F | Foster Group, Inc. | 43,350 | 3.04 | 332 | 10.33 | ||||
| 2025-08-07 | 13F | Verus Capital Partners, Llc | 38,900 | 2.10 | 298 | 9.19 | ||||
| 2025-08-11 | 13F | Private Advisor Group, LLC | 0 | -100.00 | 0 | |||||
| 2025-04-30 | 13F | Rehmann Capital Advisory Group | 0 | -100.00 | 0 | |||||
| 2025-08-01 | 13F | May Hill Capital, LLC | 12,460 | 95 | ||||||
| 2025-08-14 | 13F | Jane Street Group, Llc | Put | 780,000 | -0.36 | 5,967 | 6.61 | |||
| 2025-07-30 | 13F | Eqis Capital Management, Inc. | 23,376 | -6.00 | 179 | 0.56 | ||||
| 2025-04-17 | 13F | Vista Wealth Management Group, LLC | 12,426 | 89 | ||||||
| 2025-05-15 | 13F | Glenmede Trust Co Na | 28,216 | -28.44 | 202 | -21.18 | ||||
| 2025-05-12 | 13F | Virtu Financial LLC | 0 | -100.00 | 0 | |||||
| 2025-05-08 | 13F | XTX Topco Ltd | 0 | -100.00 | 0 | |||||
| 2025-08-28 | NP | JINTX - Johnson International Fund | 29,000 | -32.24 | 222 | -27.78 | ||||
| 2025-08-14 | 13F | Ariadne Wealth Management, LP | 32,625 | -3.57 | 223 | -11.51 | ||||
| 2025-08-14 | 13F | Two Sigma Investments, Lp | 378,628 | -70.52 | 2,897 | -68.46 | ||||
| 2025-07-23 | 13F | Shell Asset Management Co | 0 | 0 | ||||||
| 2025-08-15 | 13F | WealthCollab, LLC | 779 | 6.86 | 6 | 0.00 | ||||
| 2025-08-13 | 13F | Rsm Us Wealth Management Llc | 0 | -100.00 | 0 | |||||
| 2025-08-13 | 13F | GeoWealth Management, LLC | 14,251 | -19.59 | 109 | -13.49 | ||||
| 2025-08-14 | 13F | Mariner, LLC | 186,692 | 83.86 | 1,428 | 97.51 | ||||
| 2025-08-13 | 13F | Hsbc Holdings Plc | 0 | -100.00 | 0 | |||||
| 2025-08-14 | 13F | Barometer Capital Management Inc. | 15,447 | 0.00 | 118 | 7.27 | ||||
| 2025-07-24 | 13F | Ronald Blue Trust, Inc. | 99,341 | 27.89 | 760 | 36.76 | ||||
| 2025-04-28 | 13F | North of South Capital LLP | 0 | -100.00 | 0 | |||||
| 2025-07-29 | 13F | Wealthstream Advisors, Inc. | 25,205 | 53.08 | 193 | 64.10 | ||||
| 2025-07-30 | 13F | Cullen/frost Bankers, Inc. | 0 | -100.00 | 0 | |||||
| 2025-08-14 | 13F | Bnp Paribas Arbitrage, Sa | 1,486,004 | -11.08 | 11,368 | -4.86 | ||||
| 2025-06-27 | NP | SPWO - SP Funds S&P World (ex-US) ETF | 19,843 | 13.50 | 140 | 37.62 | ||||
| 2025-07-25 | 13F | Verdence Capital Advisors LLC | 12,014 | 9.08 | 92 | 16.67 | ||||
| 2025-08-05 | 13F | Simplex Trading, Llc | Put | 7,200 | -50.34 | 0 | ||||
| 2025-08-05 | 13F | Simplex Trading, Llc | 4,038 | -68.30 | 0 | |||||
| 2025-08-11 | 13F | United Capital Financial Advisers, Llc | 17,332 | 5.52 | 133 | 12.82 | ||||
| 2025-08-05 | 13F | Simplex Trading, Llc | Call | 37,400 | -19.57 | 0 | ||||
| 2025-08-08 | 13F | Pnc Financial Services Group, Inc. | 105,368 | 16.42 | 806 | 24.57 | ||||
| 2025-08-14 | 13F | Ieq Capital, Llc | 81,253 | 192.59 | 622 | 213.64 | ||||
| 2025-08-13 | 13F | Northern Trust Corp | 3,616,436 | 8.44 | 27,666 | 16.02 | ||||
| 2025-08-07 | 13F | BOK Financial Private Wealth, Inc. | 0 | -100.00 | 0 | |||||
| 2025-04-14 | 13F | IMC-Chicago, LLC | Put | 0 | -100.00 | 0 | -100.00 | |||
| 2025-08-12 | 13F | Franklin Resources Inc | 24,735 | 37.86 | 189 | 47.66 | ||||
| 2025-08-14 | 13F | Maple Rock Capital Partners Inc. | 3,140,443 | 24,024 | ||||||
| 2025-07-25 | 13F | Wealth Architects, LLC | 14,981 | 0.11 | 115 | 6.54 | ||||
| 2025-08-14 | 13F | Parallax Volatility Advisers, L.P. | Put | 20,000 | 0.00 | 153 | 6.99 | |||
| 2025-08-14 | 13F | Evergreen Capital Management Llc | 44,198 | 362 | ||||||
| 2025-06-26 | NP | DFEV - Dimensional Emerging Markets Value ETF | 308,787 | 9.72 | 2,174 | 33.64 | ||||
| 2025-07-17 | 13F | Sound Income Strategies, LLC | 200 | 0.00 | 2 | 0.00 | ||||
| 2025-08-27 | NP | RYSIX - Electronics Fund Investor Class | 107,029 | -7.64 | 819 | -1.21 | ||||
| 2025-04-14 | 13F | IMC-Chicago, LLC | 0 | -100.00 | 0 | -100.00 | ||||
| 2025-08-14 | 13F | Tcw Group Inc | 81,253 | -18.55 | 622 | -12.90 | ||||
| 2025-08-14 | 13F | Parallax Volatility Advisers, L.P. | 6,198 | -41.52 | 47 | -37.33 | ||||
| 2025-06-26 | NP | HTECX - Hennessy Technology Fund Investor Class | 14,908 | -25.82 | 105 | -10.34 | ||||
| 2025-06-23 | NP | UUPIX - Ultraemerging Markets Profund Investor Class | 9,621 | 9.48 | 68 | 34.00 | ||||
| 2025-07-17 | 13F | Nelson, Van Denburg & Campbell Wealth Management Group, LLC | 14,367 | -28.40 | 110 | -23.78 | ||||
| 2025-07-21 | 13F | Qrg Capital Management, Inc. | 66,027 | 4.13 | 505 | 11.48 | ||||
| 2025-08-14 | 13F | Balyasny Asset Management Llc | 463,477 | 18.69 | 3,546 | 27.02 | ||||
| 2025-07-15 | 13F | Fifth Third Bancorp | 398 | 0.00 | 3 | 50.00 | ||||
| 2025-08-05 | 13F | Bank Of Montreal /can/ | 16,842 | -5.90 | 129 | 0.79 | ||||
| 2025-08-06 | 13F | True Wealth Design, LLC | 359 | -44.85 | 3 | -50.00 | ||||
| 2025-08-14 | 13F | Voloridge Investment Management, Llc | 0 | -100.00 | 0 | |||||
| 2025-05-13 | 13F | Wellington Management Group Llp | 0 | -100.00 | 0 | -100.00 | ||||
| 2025-08-12 | 13F | Rhumbline Advisers | 716,330 | -0.31 | 5,480 | 6.66 | ||||
| 2025-06-26 | NP | DEHP - Dimensional Emerging Markets High Profitability ETF | 56,218 | -10.36 | 396 | 9.12 | ||||
| 2025-08-27 | NP | RMEAX - Aspiriant Risk-Managed Equity Allocation Fund Advisor Shares | 62,250 | -6.60 | 476 | 0.00 | ||||
| 2025-07-28 | 13F | Ritholtz Wealth Management | 87,663 | 2.36 | 671 | 9.48 | ||||
| 2025-08-07 | 13F | Allworth Financial LP | 7,000 | 6.48 | 54 | 17.78 | ||||
| 2025-08-04 | 13F | Savvy Advisors, Inc. | 0 | -100.00 | 0 | |||||
| 2025-07-03 | 13F | Garde Capital, Inc. | 200 | 2 | ||||||
| 2025-07-22 | 13F | Cedar Mountain Advisors, LLC | 1,000 | 0.00 | 8 | 0.00 | ||||
| 2025-08-14 | 13F | Raymond James Financial Inc | 35,610 | -22.68 | 272 | -17.33 | ||||
| 2025-08-08 | 13F | Wiser Advisor Group LLC | 0 | -100.00 | 0 | |||||
| 2025-04-11 | 13F | First Affirmative Financial Network | 36,935 | 55.89 | 264 | 72.55 | ||||
| 2025-06-30 | NP | AIM INTERNATIONAL MUTUAL FUNDS (INVESCO INTERNATIONAL MUTUAL FUNDS) - Invesco Oppenheimer Global Multi-Asset Growth Fund Class R6 | 7,909 | 35.08 | 56 | 66.67 | ||||
| 2025-08-28 | NP | CWI - SPDR(R) MSCI ACWI EX-US ETF | 206,513 | -10.95 | 1,580 | -4.76 | ||||
| 2025-05-05 | 13F | Transce3nd, LLC | 0 | -100.00 | 0 |