Mga Batayang Estadistika
| Pemilik Institusional | 309 total, 308 long only, 0 short only, 1 long/short - change of 2.64% MRQ |
| Alokasi Portofolio Rata-rata | 0.5489 % - change of -12.72% MRQ |
| Saham Institusional (Jangka Panjang) | 95,864,273 (ex 13D/G) - change of 10.42MM shares 12.20% MRQ |
| Nilai Institusional (Jangka Panjang) | $ 2,246,647 USD ($1000) |
Kepemilikan Institusional dan Pemegang Saham
VanEck ETF Trust - VanEck J.P. Morgan EM Local Currency Bond ETF (US:EMLC) memiliki 309 pemilik institusional dan pemegang saham yang telah mengajukan formulir 13D/G atau 13F kepada Komisi Bursa Efek (Securities Exchange Commission/SEC). Lembaga-lembaga ini memegang total 95,864,273 saham. Pemegang saham terbesar meliputi Charles Schwab Investment Management Inc, Sei Investments Co, Proficio Capital Partners LLC, Neuberger Berman Group LLC, Valmark Advisers, Inc., Asset Management One Co., Ltd., D. E. Shaw & Co., Inc., Varma Mutual Pension Insurance Co, UBS Group AG, and IMC-Chicago, LLC .
Struktur kepemilikan institusional VanEck ETF Trust - VanEck J.P. Morgan EM Local Currency Bond ETF (ARCA:EMLC) menunjukkan posisi terkini di perusahaan oleh institusi dan dana, serta perubahan terbaru dalam ukuran posisi. Pemegang saham utama dapat mencakup investor individu, reksa dana, dana lindung nilai, atau institusi. Jadwal 13D menunjukkan bahwa investor memegang (atau pernah memegang) lebih dari 5% saham perusahaan dan bermaksud (atau pernah bermaksud) untuk secara aktif mengejar perubahan strategi bisnis. Jadwal 13G menunjukkan investasi pasif lebih dari 5%.
The share price as of September 12, 2025 is 25.50 / share. Previously, on September 13, 2024, the share price was 25.02 / share. This represents an increase of 1.92% over that period.

Skor Sentimen Dana
Skor Sentimen Dana (sebelumnya dikenal sebagai Skor Akumulasi Kepemilikan) menemukan saham-saham yang paling banyak dibeli oleh dana. Ini adalah hasil dari model kuantitatif multi-faktor yang canggih yang mengidentifikasi perusahaan dengan tingkat akumulasi institusional tertinggi. Model penilaian menggunakan kombinasi dari total peningkatan pemilik yang diungkapkan, perubahan dalam alokasi portofolio pada pemilik tersebut, dan metrik lainnya. Angka berkisar dari 0 hingga 100, dengan angka yang lebih tinggi menunjukkan tingkat akumulasi yang lebih tinggi dibandingkan dengan perusahaan sejenisnya, dan 50 adalah rata-ratanya.
Frekuensi Pembaruan: Setiap Hari
Lihat Ownership Explorer, yang menyediakan daftar perusahaan dengan peringkat tertinggi.
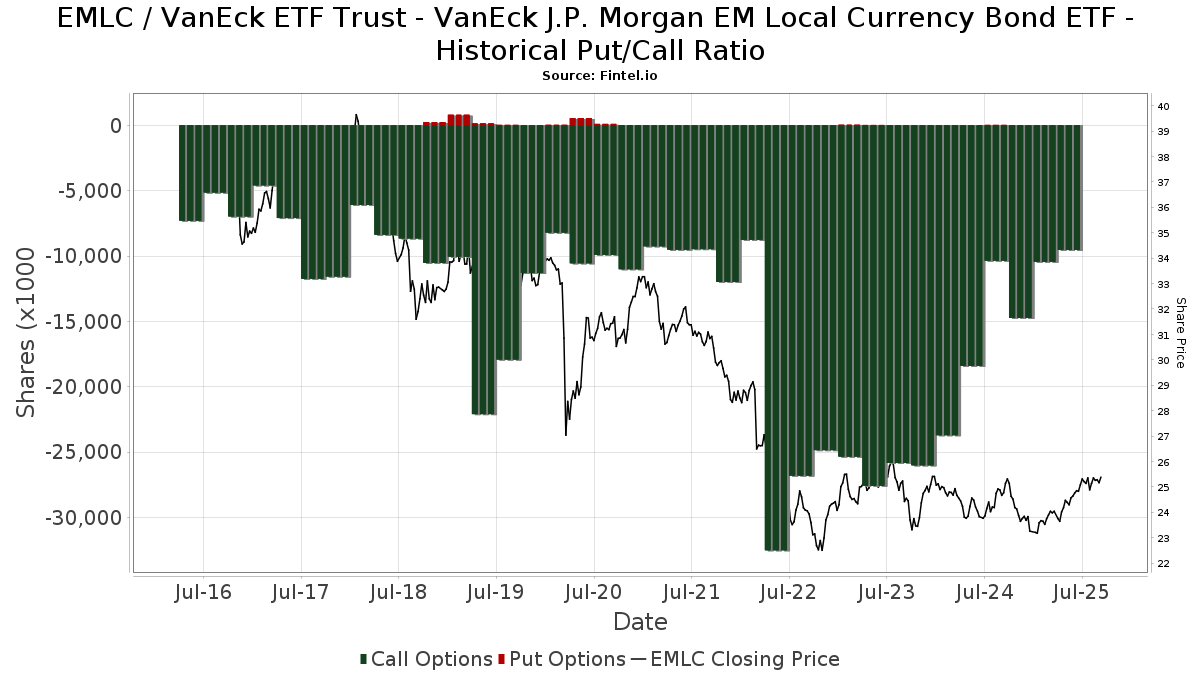
Rasio Put/Call Institusional
Selain melaporkan isu ekuitas dan utang standar, institusi dengan aset di bawah manajemen lebih dari 100 juta dolar AS juga harus mengungkapkan kepemilikan opsi put dan call mereka. Karena opsi put umumnya menunjukkan sentimen negatif, dan opsi call menunjukkan sentimen positif, kita dapat mengetahui sentimen institusional secara keseluruhan dengan memplot rasio put terhadap call. Grafik di sebelah kanan memplot rasio put/call historis untuk instrumen ini.
Menggunakan Rasio Put/Call sebagai indikator sentimen investor mengatasi salah satu kekurangan utama dari penggunaan total kepemilikan institusional, yaitu sejumlah besar aset yang dikelola diinvestasikan secara pasif untuk melacak indeks. Dana yang dikelola secara pasif biasanya tidak membeli opsi, sehingga indikator rasio put/call lebih akurat dalam melacak sentimen dana yang dikelola secara aktif.
Pengajuan 13F dan NPORT
Detail pada pengajuan 13F tersedia gratis. Detail pada pengajuan NP memerlukan keanggotaan premium. Baris berwarna hijau menunjukkan posisi baru. Baris berwarna merah menunjukkan posisi yang sudah ditutup. Klik tautan ini ikon untuk melihat riwayat transaksi selengkapnya.
Tingkatkan
untuk membuka data premium dan mengekspor ke Excel ![]() .
.
| Tanggal File | Sumber | Investor | Ketik | Presyo ng Avg (Silangan) |
Saham | Δ Saham (%) |
Dilaporkan Nilai ($1000) |
Nilai Δ (%) |
Alokasi Port (%) |
|
|---|---|---|---|---|---|---|---|---|---|---|
| 2025-08-07 | 13F | Allworth Financial LP | 44,342 | -34.47 | 1,124 | -31.75 | ||||
| 2025-08-14 | 13F | Hancock Whitney Corp | 109,141 | 320.68 | 2,767 | 346.85 | ||||
| 2025-07-24 | 13F | Comprehensive Money Management Services LLC | 27,670 | 0.02 | 701 | 6.21 | ||||
| 2025-08-04 | 13F | Center for Financial Planning, Inc. | 0 | -100.00 | 0 | |||||
| 2025-07-29 | NP | WAVLX - Wavelength Interest Rate Neutral Fund | 193,041 | 36.97 | 4,764 | 42.89 | ||||
| 2025-07-14 | 13F | AdvisorNet Financial, Inc | 5,513 | 0.00 | 140 | 6.11 | ||||
| 2025-08-14 | 13F | Betterment LLC | 58,285 | 54.49 | 1 | |||||
| 2025-05-02 | 13F | United Community Bank | 0 | -100.00 | 0 | |||||
| 2025-08-13 | 13F | Jones Financial Companies Lllp | 13,777 | 6.20 | 347 | 12.34 | ||||
| 2025-08-14 | 13F | Wellington Management Group Llp | 307,250 | 0.00 | 7,789 | 6.25 | ||||
| 2025-08-26 | NP | BlackRock Strategic Global Bond Fund, Inc. - BlackRock Strategic Global Bond Fund, Inc. Investor A This fund is a listed as child fund of BlackRock, Inc. and if that institution has disclosed ownership in this security, then these positions will not be double counted when calculating total shares and total value | 21,689 | -50.00 | 550 | -46.91 | ||||
| 2025-08-15 | 13F | Binnacle Investments Inc | 51,778 | 4.24 | 1,313 | 10.72 | ||||
| 2025-08-04 | 13F | Migdal Insurance & Financial Holdings Ltd. | 1,600 | 0 | ||||||
| 2025-08-14 | 13F | Goldman Sachs Group Inc | 178,980 | -43.26 | 4,537 | -39.72 | ||||
| 2025-07-29 | 13F | Angeles Wealth Management, Llc | 535 | 14 | ||||||
| 2025-07-28 | 13F | Harbour Investments, Inc. | 768 | 70.67 | 19 | 90.00 | ||||
| 2025-07-22 | 13F | Checchi Capital Advisers, LLC | 750,070 | -9.35 | 19,014 | -3.68 | ||||
| 2025-07-18 | 13F | Tanager Wealth Management LLP | 19,386 | -36.56 | 491 | -32.65 | ||||
| 2025-08-07 | 13F | Howard Bailey Securities, Llc | 11,984 | -7.52 | 304 | -1.94 | ||||
| 2025-07-25 | 13F | Sequoia Financial Advisors, LLC | 0 | -100.00 | 0 | |||||
| 2025-08-11 | 13F | Covestor Ltd | 376 | 0 | ||||||
| 2025-07-16 | 13F | ORG Partners LLC | 1,259 | 300.96 | 32 | 342.86 | ||||
| 2025-08-14 | 13F | Raymond James Financial Inc | 65,299 | -8.68 | 1,655 | -2.99 | ||||
| 2025-08-14 | 13F | Evergreen Capital Management Llc | 1,036,274 | 2.67 | 26,270 | 9.08 | ||||
| 2025-08-11 | 13F | Brown Wealth Management, Llc | 0 | -100.00 | 0 | |||||
| 2025-08-07 | 13F | Garda Capital Partners Lp | Call | 191,300 | 5.52 | 42,689 | 11.35 | |||
| 2025-08-08 | 13F | Collaborative Wealth Managment Inc. | 186,000 | 1.31 | 4,715 | 7.65 | ||||
| 2025-07-15 | 13F | Main Street Group, LTD | 289 | 0.00 | 7 | 16.67 | ||||
| 2025-08-14 | 13F | Capitolis Liquid Global Markets LLC | 298,800 | -68.80 | 7,575 | -66.85 | ||||
| 2025-08-15 | 13F | Fidelity D & D Bancorp Inc | 92,724 | 2.00 | 2,351 | 8.39 | ||||
| 2025-08-14 | 13F | Maven Securities LTD | Call | 69,700 | -60.01 | 17,170 | -48.72 | |||
| 2025-06-26 | NP | BLACKROCK GLOBAL ALLOCATION FUND, INC. - BLACKROCK GLOBAL ALLOCATION FUND, INC. Investor A This fund is a listed as child fund of BlackRock, Inc. and if that institution has disclosed ownership in this security, then these positions will not be double counted when calculating total shares and total value | 531,633 | -50.00 | 13,009 | -48.07 | ||||
| 2025-08-14 | 13F | Ubs Asset Management Americas Inc | 167,207 | 4,239 | ||||||
| 2025-07-24 | NP | AIHAX - Horizon Active Income Fund Advisor Class | 1,639 | 0.00 | 40 | 5.26 | ||||
| 2025-08-12 | 13F | CIBC Private Wealth Group, LLC | 543 | 81.00 | 14 | 116.67 | ||||
| 2025-08-11 | 13F | Rothschild Investment Llc | 2 | 0 | ||||||
| 2025-07-31 | 13F | Brinker Capital Investments, LLC | 0 | -100.00 | 0 | -100.00 | ||||
| 2025-08-27 | NP | Jnl Series Trust - Jnl/blackrock Global Allocation Fund (a) | 84,652 | -50.00 | 2,146 | -46.89 | ||||
| 2025-08-05 | 13F | Key FInancial Inc | 4 | 0 | ||||||
| 2025-08-08 | 13F | Fortis Group Advisors, LLC | 0 | -100.00 | 0 | |||||
| 2025-08-13 | 13F | Crabel Capital Management, LLC | 148,221 | 33.01 | 3,757 | 41.35 | ||||
| 2025-08-14 | 13F | Horizon Investments, LLC | 1,639 | 0.00 | 41 | 7.89 | ||||
| 2025-07-28 | 13F | Cutler Investment Counsel Llc | 319,389 | -1.24 | 8,097 | 4.92 | ||||
| 2025-08-14 | 13F | Optiver Holding B.V. | Call | 1,079,900 | 2.04 | 301,163 | 34.57 | |||
| 2025-08-14 | 13F | CoreCap Advisors, LLC | 2,630 | 0.11 | 67 | 6.45 | ||||
| 2025-08-13 | 13F | Congress Wealth Management LLC / DE / | 183,992 | 163.45 | 4,664 | 179.95 | ||||
| 2025-06-26 | NP | HFIGX - Hartford Schroders Diversified Growth Fund Class I | 260,984 | 6,386 | ||||||
| 2025-04-23 | 13F | GHP Investment Advisors, Inc. | 0 | -100.00 | 0 | |||||
| 2025-08-12 | 13F | Western Asset Management Company, LLC | 16,200 | 0.00 | 411 | 6.22 | ||||
| 2025-07-08 | 13F | Nbc Securities, Inc. | 488 | 0.41 | 0 | |||||
| 2025-04-23 | 13F | Spire Wealth Management | 0 | -100.00 | 0 | |||||
| 2025-08-08 | 13F | Hartland & Co., LLC | 136 | 0.00 | 3 | 0.00 | ||||
| 2025-08-28 | NP | SSIZX - Sierra Tactical Core Income Fund Class A Shares | 2,173,500 | 98.19 | 55,098 | 110.56 | ||||
| 2025-08-28 | NP | GHMS - Goose Hollow Multi-Strategy Income ETF | 41,432 | 71.86 | 1,050 | 82.61 | ||||
| 2025-06-27 | NP | TRTY - Cambria Trinity ETF | 133,836 | 0.27 | 3,275 | 4.13 | ||||
| 2025-07-11 | 13F | Pinnacle Bancorp, Inc. | 312 | 0.00 | 8 | 0.00 | ||||
| 2025-07-22 | 13F | Net Worth Advisory Group | 16,548 | 1.63 | 419 | 7.99 | ||||
| 2025-05-15 | 13F | Barclays Plc | 0 | -100.00 | 0 | |||||
| 2025-07-28 | 13F | Kiker Wealth Management, LLC | 157,673 | 0.34 | 3,997 | 6.62 | ||||
| 2025-08-13 | 13F | Bank Of Nova Scotia | 435,000 | 11,027 | ||||||
| 2025-08-13 | 13F | Avos Capital Management, LLC | 182,610 | 15.02 | 4,629 | 22.20 | ||||
| 2025-07-10 | 13F | Exchange Traded Concepts, Llc | 60,371 | 18.72 | 1,530 | 26.13 | ||||
| 2025-07-16 | 13F | Signature Resources Capital Management, LLC | 616 | -13.85 | 16 | -11.76 | ||||
| 2025-08-11 | 13F | United Advisor Group, LLC | 17,546 | 445 | ||||||
| 2025-07-14 | 13F | Park Avenue Securities Llc | 935,204 | -2.24 | 24 | 4.55 | ||||
| 2025-08-11 | 13F | Annis Gardner Whiting Capital Advisors, LLC | 500 | 13 | ||||||
| 2025-08-14 | 13F | Ameriprise Financial Inc | 568,320 | 545.56 | 14,407 | 586.00 | ||||
| 2025-08-05 | 13F | Dravo Bay Llc | 9,842 | 3.50 | 249 | 10.18 | ||||
| 2025-05-08 | 13F | Jefferies Financial Group Inc. | 0 | -100.00 | 0 | |||||
| 2025-07-28 | 13F | Td Asset Management Inc | 432,300 | -12.04 | 10,959 | -6.56 | ||||
| 2025-05-08 | 13F | NorthRock Partners, LLC | 0 | -100.00 | 0 | |||||
| 2025-07-17 | 13F | Janney Montgomery Scott LLC | 142,516 | -18.22 | 4 | -25.00 | ||||
| 2025-07-23 | 13F | Matisse Capital | 24,900 | 0.00 | 631 | 6.23 | ||||
| 2025-07-25 | 13F | Envestnet Portfolio Solutions, Inc. | 46,688 | -11.03 | 1,184 | -5.51 | ||||
| 2025-08-25 | 13F/A | Neuberger Berman Group LLC | 4,147,381 | 7,395.18 | 105,136 | 7,864.85 | ||||
| 2025-04-25 | 13F | EnRich Financial Partners LLC | 0 | -100.00 | 0 | |||||
| 2025-07-16 | 13F | Evergreen Private Wealth LLC | 66,402 | 6.13 | 1,683 | 12.80 | ||||
| 2025-08-14 | 13F | Engineers Gate Manager LP | 68,023 | 84.68 | 1,724 | 96.36 | ||||
| 2025-08-19 | 13F | Delos Wealth Advisors, LLC | 66,224 | -6.54 | 1,679 | -0.71 | ||||
| 2025-07-30 | 13F | Bogart Wealth, LLC | 49 | 0.00 | 1 | 0.00 | ||||
| 2025-08-13 | 13F | Hsbc Holdings Plc | 2,091,976 | -2.86 | 26,921 | 3.25 | ||||
| 2025-08-14 | 13F | Mml Investors Services, Llc | 127,204 | 12.17 | 3 | 50.00 | ||||
| 2025-08-14 | 13F | Bnp Paribas Arbitrage, Sa | 223,898 | -90.80 | 5,676 | -90.23 | ||||
| 2025-08-06 | NP | LINCOLN VARIABLE INSURANCE PRODUCTS TRUST - LVIP BlackRock Global Allocation Fund Standard Class | 60,974 | -50.00 | 1,546 | -46.89 | ||||
| 2025-08-18 | 13F/A | National Bank Of Canada /fi/ | 557,401 | 23.40 | 14,125 | 31.13 | ||||
| 2025-08-12 | 13F | XTX Topco Ltd | 16,696 | 423 | ||||||
| 2025-08-05 | 13F | Dunhill Financial, LLC | 265 | 7 | ||||||
| 2025-08-12 | 13F | Advisors Asset Management, Inc. | 33,574 | 5.14 | 851 | 11.83 | ||||
| 2025-08-13 | 13F | Leuthold Group, Llc | 0 | -100.00 | 0 | |||||
| 2025-08-12 | 13F | Deutsche Bank Ag\ | 43,087 | 1,092 | ||||||
| 2025-08-12 | 13F | Adventist Health System Sunbelt Healthcare Corp | 1,366,800 | 34,648 | ||||||
| 2025-08-14 | 13F | Fiduciary Trust Co | 16,458 | 417 | ||||||
| 2025-08-27 | NP | Jnl Series Trust - Jnl/neuberger Berman Strategic Income Fund (a) | 422,681 | 10,715 | ||||||
| 2025-08-13 | 13F | 1832 Asset Management L.P. | 1,534,886 | 1.51 | 38,909 | 7.85 | ||||
| 2025-07-03 | 13F | Whitcomb & Hess, Inc. | 359,976 | 1.28 | 9,125 | 7.61 | ||||
| 2025-08-13 | 13F | Kilter Group LLC | 22 | 1 | ||||||
| 2025-04-24 | 13F | Allspring Global Investments Holdings, LLC | 0 | -100.00 | 0 | |||||
| 2025-08-11 | 13F | Aptus Capital Advisors, LLC | 1,015 | 0.10 | 26 | 4.17 | ||||
| 2025-08-11 | 13F | Absolute Gestao de Investimentos Ltda. | 10,000 | 254 | ||||||
| 2025-07-16 | 13F | Perigon Wealth Management, LLC | 37,772 | 1.12 | 958 | 7.41 | ||||
| 2025-08-19 | 13F | Wealth Group, Ltd. | 0 | -100.00 | 0 | |||||
| 2025-08-14 | 13F | Royal Bank Of Canada | 720,703 | 3.15 | 18,270 | 9.59 | ||||
| 2025-07-17 | 13F/A | Capital Investment Advisors, LLC | 214,700 | -17.62 | 5,443 | -12.48 | ||||
| 2025-08-06 | 13F | Csenge Advisory Group | 31,554 | 7.74 | 779 | 10.20 | ||||
| 2025-05-15 | 13F | Qube Research & Technologies Ltd | 0 | -100.00 | 0 | |||||
| 2025-05-01 | 13F | Fifth Third Securities, Inc. | 0 | -100.00 | 0 | |||||
| 2025-07-21 | 13F | Mirae Asset Global Investments Co., Ltd. | 78,000 | 0.00 | 1,977 | 6.23 | ||||
| 2025-08-12 | 13F | MAI Capital Management | 141 | -93.70 | 4 | -94.34 | ||||
| 2025-08-14 | 13F | Stifel Financial Corp | 79,104 | -46.35 | 2,005 | -43.01 | ||||
| 2025-07-07 | 13F | Bangor Savings Bank | 0 | -100.00 | 0 | |||||
| 2025-07-16 | 13F | Highline Wealth Partners Llc | 13 | 0 | ||||||
| 2025-08-06 | 13F | AE Wealth Management LLC | 17,625 | -4.66 | 447 | 1.13 | ||||
| 2025-08-11 | 13F | Pineridge Advisors LLC | 347 | -3.34 | 9 | 0.00 | ||||
| 2025-08-14 | 13F | Penn Mutual Asset Management, LLC | 18,000 | 0.00 | 456 | 6.29 | ||||
| 2025-08-14 | 13F | Colony Group, LLC | 10,034 | -0.02 | 254 | 6.28 | ||||
| 2025-08-08 | 13F | Avantax Advisory Services, Inc. | 10,838 | 14.58 | 275 | 21.78 | ||||
| 2025-08-14 | 13F | Headlands Technologies LLC | 304 | -60.52 | 8 | -61.11 | ||||
| 2025-08-12 | 13F | Coldstream Capital Management Inc | 0 | -100.00 | 0 | |||||
| 2025-05-02 | 13F | Signaturefd, Llc | 0 | 0 | ||||||
| 2025-05-29 | NP | SIRAX - Sierra Tactical All Asset Fund Class A | 199,700 | 4,765 | ||||||
| 2025-07-14 | 13F | Armstrong Advisory Group, Inc | 0 | -100.00 | 0 | |||||
| 2025-08-04 | 13F | IFG Advisory, LLC | 12,532 | -17.53 | 318 | -12.43 | ||||
| 2025-05-14 | 13F | Huntington National Bank | 0 | -100.00 | ||||||
| 2025-08-13 | 13F | Guggenheim Capital Llc | 372,950 | 1.76 | 9,454 | 8.12 | ||||
| 2025-07-22 | 13F | Olistico Wealth, LLC | 502 | 33.87 | 13 | 50.00 | ||||
| 2025-07-31 | 13F | Wright Fund Managment, LLC | 1,566,251 | 0.00 | 37,371 | 0.00 | ||||
| 2025-08-13 | 13F | Cambria Investment Management, L.P. | 236,017 | 1.89 | 5,958 | 8.80 | ||||
| 2025-07-30 | 13F | First Citizens Bank & Trust Co | 35,402 | 3.85 | 897 | 10.33 | ||||
| 2025-05-29 | NP | Northern Lights Fund Trust - Sierra Tactical Risk Spectrum 70 Fund Investor Class | 40,300 | 962 | ||||||
| 2025-08-11 | 13F | Principal Securities, Inc. | 27,208 | -68.47 | 690 | -65.45 | ||||
| 2025-08-14 | 13F | Millennium Management Llc | 41,691 | 84.68 | 1,057 | 96.28 | ||||
| 2025-07-15 | 13F | Ballentine Partners, LLC | 21,835 | 0.00 | 554 | 6.35 | ||||
| 2025-08-12 | 13F | AlphaCore Capital LLC | 34,183 | 56,871.67 | 867 | 86,500.00 | ||||
| 2025-07-07 | 13F | Upper Left Wealth Management, LLC | 159,258 | -0.27 | 4,037 | 5.96 | ||||
| 2025-07-14 | 13F | Clear Harbor Asset Management, LLC | 16,500 | -21.71 | 418 | -16.73 | ||||
| 2025-08-14 | 13F | VPR Management LLC | 316,200 | 0.00 | 8,016 | 6.24 | ||||
| 2025-08-05 | 13F | Bank Of Montreal /can/ | 0 | -100.00 | 0 | |||||
| 2025-08-12 | 13F | BlackRock, Inc. | 1,716,570 | -50.00 | 43,515 | -46.88 | ||||
| 2025-08-14 | 13F | Cibc World Markets Corp | Call | 50,000 | 2,603 | |||||
| 2025-08-13 | 13F | Invesco Ltd. | 11,105 | -6.18 | 282 | -0.35 | ||||
| 2025-07-10 | 13F | Focus Financial Network, Inc. | 43,051 | 1,091 | ||||||
| 2025-08-06 | 13F | Pekin Hardy Strauss, Inc. | 314,448 | 6.75 | 7,971 | 13.42 | ||||
| 2025-07-22 | 13F | Marks Group Wealth Management, Inc | 0 | -100.00 | 0 | |||||
| 2025-07-24 | 13F | Us Bancorp \de\ | 200 | 5 | ||||||
| 2025-07-08 | 13F | Parallel Advisors, LLC | 337 | 0.90 | 9 | 14.29 | ||||
| 2025-08-01 | 13F | Rossby Financial, LCC | 23,012 | -15.43 | 583 | -12.07 | ||||
| 2025-08-15 | 13F | Morgan Stanley | 1,745,804 | 7.49 | 44,256 | 14.21 | ||||
| 2025-08-08 | 13F | SG Americas Securities, LLC | Call | 30,000 | 0.00 | 1 | ||||
| 2025-08-12 | 13F | Calton & Associates, Inc. | 8,597 | -45.46 | 218 | -42.29 | ||||
| 2025-08-14 | 13F | Financial Network Wealth Advisors LLC | 124 | 0.00 | 3 | 50.00 | ||||
| 2025-08-14 | 13F | Principia Wealth Advisory, LLC | Call | 3,000 | -40.00 | 156 | -30.36 | |||
| 2025-08-14 | 13F | Citadel Advisors Llc | Put | 0 | -100.00 | 0 | ||||
| 2025-08-12 | 13F | LPL Financial LLC | 219,299 | 107.35 | 5,559 | 120.33 | ||||
| 2025-07-30 | 13F | Cullen/frost Bankers, Inc. | 92 | 0.00 | 2 | 0.00 | ||||
| 2025-08-04 | 13F | Quaker Wealth Management, LLC | Put | 0 | -100.00 | 0 | ||||
| 2025-08-11 | 13F | Elequin Capital Lp | 1,202 | 30 | ||||||
| 2025-08-13 | 13F | Quadrature Capital Ltd | 73,285 | 1,857 | ||||||
| 2025-07-25 | 13F | Almanack Investment Partners, LLC. | 185,637 | 4,706 | ||||||
| 2025-08-18 | 13F | Geneos Wealth Management Inc. | 80,271 | -3.77 | 2,035 | 2.21 | ||||
| 2025-08-11 | 13F | Private Advisor Group, LLC | 62,522 | -4.50 | 1,585 | 1.41 | ||||
| 2025-08-14 | 13F | Keebeck Wealth Management, LLC | 87,630 | 0.00 | 2,221 | 6.27 | ||||
| 2025-08-14 | 13F | Sunbelt Securities, Inc. | 2 | -98.78 | 0 | -100.00 | ||||
| 2025-07-23 | NP | WAARX - Western Asset Total Return Unconstrained Fund Class I | 16,200 | 0.00 | 400 | 4.18 | ||||
| 2025-08-13 | 13F | Schroder Investment Management Group | 378,621 | 35.99 | 9,598 | 44.79 | ||||
| 2025-05-14 | 13F | Family Wealth Group, LLC | 0 | -100.00 | 0 | -100.00 | ||||
| 2025-08-26 | NP | Northern Lights Variable Trust - TOPS Managed Risk Balanced ETF Portfolio Class 2 shares | 61,288 | -6.67 | 1,554 | -0.83 | ||||
| 2025-07-23 | 13F | Vontobel Holding Ltd. | 28,200 | -34.72 | 715 | -30.68 | ||||
| 2025-08-08 | 13F | Creative Planning | 17,319 | -35.53 | 439 | -31.41 | ||||
| 2025-08-26 | NP | Northern Lights Variable Trust - TOPS Moderate Growth ETF Portfolio Class 1 shares | 161,954 | 1.10 | 4,106 | 7.40 | ||||
| 2025-07-28 | 13F | Axxcess Wealth Management, Llc | 7,957 | 202 | ||||||
| 2025-07-15 | 13F | Clarus Group, Inc. | 7,920 | 201 | ||||||
| 2025-08-15 | 13F | Kestra Advisory Services, LLC | 12,780 | -4.17 | 324 | 1.57 | ||||
| 2025-08-14 | 13F | Hilltop Holdings Inc. | 41,446 | -1.14 | 1,051 | 5.00 | ||||
| 2025-08-11 | 13F | Empowered Funds, LLC | 250,746 | -61.00 | 6,326 | -58.57 | ||||
| 2025-07-30 | 13F | Mid-American Wealth Advisory Group, Inc. | 4 | 0 | ||||||
| 2025-07-07 | 13F | Avenue 1 Advisors, LLC | 82,335 | -0.57 | 2,087 | 5.67 | ||||
| 2025-08-14 | 13F | Fmr Llc | 181,291 | 0.41 | 4,596 | 6.66 | ||||
| 2025-08-08 | 13F | Kingsview Wealth Management, LLC | 8,574 | 217 | ||||||
| 2025-08-26 | NP | Northern Lights Variable Trust - TOPS Conservative ETF Portfolio Class 1 shares | 33,182 | -1.24 | 841 | 4.99 | ||||
| 2025-05-02 | 13F | Capital A Wealth Management, LLC | 11 | -84.93 | 0 | -100.00 | ||||
| 2025-08-11 | 13F | FSA Wealth Management LLC | 500 | 13 | ||||||
| 2025-08-26 | NP | Northern Lights Variable Trust - TOPS Managed Risk Moderate Growth ETF Portfolio Class 1 shares | 71,279 | -7.91 | 1,807 | -2.17 | ||||
| 2025-08-14 | 13F | Federation des caisses Desjardins du Quebec | 1,136,179 | 1.33 | 28,802 | 7.65 | ||||
| 2025-05-06 | 13F | Kathleen S. Wright Associates Inc. | 0 | -100.00 | 0 | |||||
| 2025-07-24 | 13F | rebel Financial LLC | 181,204 | 4,594 | ||||||
| 2025-08-14 | 13F | Smartleaf Asset Management LLC | 1 | -50.00 | 0 | |||||
| 2025-08-11 | 13F | Hexagon Capital Partners LLC | 0 | -100.00 | 0 | |||||
| 2025-08-12 | 13F | Main Management LLC | 0 | -100.00 | 0 | |||||
| 2025-08-14 | 13F | Kovitz Investment Group Partners, LLC | 51,140 | 1,296 | ||||||
| 2025-07-22 | 13F | IMC-Chicago, LLC | Call | 2,547,200 | 1.30 | 403,793 | 17.42 | |||
| 2025-08-12 | 13F | SRS Capital Advisors, Inc. | 1,962 | -12.88 | 50 | -7.55 | ||||
| 2025-08-07 | 13F | Proficio Capital Partners LLC | 4,792,297 | 5,097 | ||||||
| 2025-08-28 | NP | BlackRock Series Fund, Inc. - BlackRock Global Allocation Portfolio This fund is a listed as child fund of BlackRock, Inc. and if that institution has disclosed ownership in this security, then these positions will not be double counted when calculating total shares and total value | 4,113 | -50.01 | 104 | -46.94 | ||||
| 2025-07-18 | 13F | Martel Wealth Advisors Inc | 87,230 | -2.10 | 2,211 | 4.05 | ||||
| 2025-05-07 | 13F | Spectrum Wealth Counsel, LLC | 8 | 0 | ||||||
| 2025-05-22 | 13F | Mattson Financial Services, LLC | 0 | -100.00 | 0 | |||||
| 2025-07-31 | 13F/A | Avion Wealth | 709 | 0.00 | 0 | |||||
| 2025-08-13 | 13F | Mount Yale Investment Advisors, LLC | 177 | 4 | ||||||
| 2025-08-08 | 13F | Financial Gravity Companies, Inc. | 512 | 15.58 | 13 | 20.00 | ||||
| 2025-07-14 | 13F | Ridgewood Investments LLC | 8 | 0.00 | 0 | |||||
| 2025-07-21 | 13F | Ping Capital Management, Inc. | Call | 1,400 | 390 | |||||
| 2025-08-07 | 13F | Cahill Financial Advisors Inc | 17,950 | -9.51 | 455 | -3.81 | ||||
| 2025-07-30 | 13F | Bleakley Financial Group, LLC | 43,807 | 29.53 | 1,111 | 37.72 | ||||
| 2025-08-12 | 13F | Charles Schwab Investment Management Inc | 11,661,146 | 13.52 | 295,610 | 20.61 | ||||
| 2025-08-12 | 13F | Global Retirement Partners, LLC | 443 | -45.11 | 11 | -38.89 | ||||
| 2025-08-07 | 13F | Apeiron RIA LLC | 19,477 | -1.64 | 494 | 4.45 | ||||
| 2025-08-14 | 13F | McIlrath & Eck, LLC | 433 | -49.94 | 11 | -50.00 | ||||
| 2025-07-31 | 13F | Wealthfront Advisers Llc | 14,757 | 34.61 | 374 | 43.30 | ||||
| 2025-08-13 | 13F | Capital Analysts, Inc. | 1,809 | 0.00 | 0 | |||||
| 2025-08-13 | 13F | Renaissance Technologies Llc | 613,300 | 15,547 | ||||||
| 2025-07-30 | 13F | Exencial Wealth Advisors, Llc | 33,351 | 3.10 | 845 | 9.60 | ||||
| 2025-08-05 | 13F | ALM First Financial Advisors, LLC | 527,748 | 0.00 | 13,378 | 6.24 | ||||
| 2025-08-08 | 13F | Smithfield Trust Co | 0 | -100.00 | 0 | |||||
| 2025-08-14 | 13F | D. E. Shaw & Co., Inc. | 3,150,932 | 190.27 | 79,876 | 208.40 | ||||
| 2025-07-07 | 13F | Global Wealth Strategies & Associates | 0 | -100.00 | 0 | |||||
| 2025-07-08 | 13F | Arlington Trust Co LLC | 1,000 | 0.00 | 25 | 8.70 | ||||
| 2025-08-14 | 13F | Wells Fargo & Company/mn | 1,783,095 | 20.25 | 45,201 | 27.76 | ||||
| 2025-08-14 | 13F | Wiley Bros.-aintree Capital, Llc | 38,149 | 247.00 | 963 | 268.58 | ||||
| 2025-08-26 | NP | Northern Lights Variable Trust - TOPS Growth ETF Portfolio Class 2 shares | 203,588 | 6.06 | 5,161 | 12.66 | ||||
| 2025-07-11 | 13F | Farther Finance Advisors, LLC | 511 | -60.96 | 13 | -61.29 | ||||
| 2025-08-07 | 13F | Payden & Rygel | 0 | -100.00 | 0 | |||||
| 2025-08-13 | 13F | Transce3nd, LLC | 1,356 | -8.69 | 34 | -2.86 | ||||
| 2025-08-12 | 13F | O'shaughnessy Asset Management, Llc | 667 | -8.25 | 17 | -5.88 | ||||
| 2025-08-07 | 13F | Readystate Asset Management Lp | 21,999 | 558 | ||||||
| 2025-08-28 | NP | Northern Lights Fund Trust - Ocean Park High Income ETF | 21,867 | -12.50 | 554 | -7.05 | ||||
| 2025-05-08 | 13F | Plante Moran Financial Advisors, LLC | 0 | -100.00 | 0 | |||||
| 2025-07-17 | 13F | Raleigh Capital Management Inc. | 2,184 | -9.71 | 55 | -3.51 | ||||
| 2025-05-30 | NP | ERNZ - TrueShares Active Yield ETF | 5,215 | 124 | ||||||
| 2025-07-11 | 13F | International Private Wealth Advisors LLC | 10,345 | 13.48 | 262 | 20.74 | ||||
| 2025-07-22 | 13F | Iron Horse Wealth Management, LLC | 15 | 0.00 | 0 | |||||
| 2025-08-11 | 13F | Citigroup Inc | 11,343 | 32.93 | 288 | 41.38 | ||||
| 2025-08-13 | 13F | EverSource Wealth Advisors, LLC | 238 | 27.96 | 6 | 50.00 | ||||
| 2025-08-26 | NP | Northern Lights Variable Trust - TOPS Managed Risk Growth ETF Portfolio Class 1 shares | 113,145 | -6.34 | 2,868 | -0.49 | ||||
| 2025-04-21 | 13F | Ronald Blue Trust, Inc. | 0 | -100.00 | 0 | |||||
| 2025-07-31 | 13F | Oppenheimer & Co Inc | 144,899 | 14.66 | 3,673 | 21.82 | ||||
| 2025-08-14 | 13F | GWM Advisors LLC | 465,542 | 53.42 | 11,801 | 63.00 | ||||
| 2025-08-12 | 13F | Proequities, Inc. | Call | 0 | 0 | |||||
| 2025-07-10 | 13F | Stewardship Advisors, LLC | 21,365 | 0.42 | 542 | 6.71 | ||||
| 2025-08-14 | 13F | Alliancebernstein L.p. | 373,600 | 9,471 | ||||||
| 2025-05-12 | 13F | SOUTH STATE Corp | 0 | -100.00 | 0 | |||||
| 2025-08-12 | 13F | Steward Partners Investment Advisory, Llc | 186,536 | 5.68 | 4,729 | 12.28 | ||||
| 2025-04-09 | 13F | Sanders Morris Harris Llc | 0 | -100.00 | 0 | -100.00 | ||||
| 2025-07-28 | 13F | Allianz Asset Management GmbH | 0 | -100.00 | 0 | |||||
| 2025-08-12 | 13F | Warberg Asset Management LLC | Call | 10,000 | -52.38 | 521 | -46.11 | |||
| 2025-07-14 | 13F | Painted Porch Advisors LLC | 327 | 1.55 | 8 | 14.29 | ||||
| 2025-08-04 | 13F | Assetmark, Inc | 189,122 | 3,066.28 | 4,794 | 3,276.06 | ||||
| 2025-08-05 | 13F | GPS Wealth Strategies Group, LLC | 48 | 1,100.00 | 1 | |||||
| 2025-08-15 | 13F | Provenance Wealth Advisors, LLC | 0 | -100.00 | 0 | |||||
| 2025-08-01 | 13F | Envestnet Asset Management Inc | 1,515,123 | -2.45 | 38,408 | 3.65 | ||||
| 2025-08-14 | 13F | Verition Fund Management LLC | 790,000 | -25.35 | 20,026 | -20.69 | ||||
| 2025-08-26 | NP | FFALX - Franklin Founding Funds Allocation Fund Class A | 773,281 | 0.00 | 19,603 | 6.24 | ||||
| 2025-08-14 | 13F | Modern Wealth Management, LLC | 23,500 | 596 | ||||||
| 2025-08-26 | NP | BlackRock Capital Allocation Trust This fund is a listed as child fund of BlackRock, Inc. and if that institution has disclosed ownership in this security, then these positions will not be double counted when calculating total shares and total value | 43,791 | -50.00 | 1,110 | -46.86 | ||||
| 2025-08-12 | 13F | Founders Financial Alliance, LLC | 0 | -100.00 | 0 | |||||
| 2025-08-06 | 13F | Commonwealth Equity Services, Llc | 55,207 | -14.20 | 1 | 0.00 | ||||
| 2025-05-15 | 13F | Two Sigma Securities, Llc | 0 | -100.00 | 0 | -100.00 | ||||
| 2025-08-12 | 13F | Proequities, Inc. | 0 | 0 | ||||||
| 2025-07-10 | 13F | Wealth Enhancement Advisory Services, Llc | 114,017 | 4.84 | 2,885 | 11.18 | ||||
| 2025-08-14 | 13F | Hurley Capital, LLC | 0 | -100.00 | 0 | |||||
| 2025-07-23 | 13F | Friedenthal Financial | 0 | -100.00 | 0 | |||||
| 2025-08-06 | 13F | Spurstone Advisory Services, LLC | 11 | 0.00 | 0 | |||||
| 2025-08-06 | 13F | Vantage Financial Partners, LLC | 9,921 | 1.56 | 251 | 7.73 | ||||
| 2025-08-11 | 13F | WPG Advisers, LLC | 6,533 | -16.44 | 166 | -11.29 | ||||
| 2025-08-15 | 13F | Captrust Financial Advisors | 246,675 | -0.19 | 6,253 | 6.05 | ||||
| 2025-08-06 | 13F | Sage Advisory Services, Ltd.Co. | 51,551 | -0.01 | 1,307 | 6.26 | ||||
| 2025-08-05 | 13F | Tiaa Trust, National Association | 868,662 | 171.92 | 22,021 | 188.90 | ||||
| 2025-07-22 | 13F | Wealthcare Advisory Partners LLC | 0 | -100.00 | 0 | |||||
| 2025-07-24 | 13F | IFP Advisors, Inc | 2,091 | 146.58 | 53 | 165.00 | ||||
| 2025-08-13 | 13F | Continuum Advisory, LLC | 0 | -100.00 | 0 | |||||
| 2025-08-05 | 13F | Bank of New York Mellon Corp | 1,050,195 | -9.58 | 26,622 | -3.94 | ||||
| 2025-07-09 | 13F | Lake Hills Wealth Management, LLC | 80,038 | 2,029 | ||||||
| 2025-08-14 | 13F | Susquehanna International Group, Llp | Put | 14,200 | 360 | |||||
| 2025-08-14 | 13F | Susquehanna International Group, Llp | 181,305 | 521.06 | 4,596 | 560.34 | ||||
| 2025-04-15 | 13F | Transform Wealth, LLC | 51,422 | -1.45 | 1,227 | 1.74 | ||||
| 2025-08-19 | 13F | Asset Dedication, LLC | 308 | 8 | ||||||
| 2025-08-07 | 13F | CENTRAL TRUST Co | 334,677 | 25.74 | 8,484 | 33.61 | ||||
| 2025-08-13 | 13F | Northwestern Mutual Wealth Management Co | 20,512 | 1.13 | 520 | 7.45 | ||||
| 2025-05-14 | 13F | ExodusPoint Capital Management, LP | 0 | -100.00 | 0 | |||||
| 2025-08-15 | 13F | Tower Research Capital LLC (TRC) | 43 | -98.59 | 1 | -98.61 | ||||
| 2025-08-13 | 13F | Summit Financial, LLC | 62,606 | 7.28 | 1,587 | 14.01 | ||||
| 2025-08-18 | 13F | Front Row Advisors LLC | 62 | 0.00 | 2 | 0.00 | ||||
| 2025-05-27 | NP | GGBFX - Global Bond Fund Investor | 54,000 | 0.00 | 1,288 | 3.29 | ||||
| 2025-08-11 | 13F | HighTower Advisors, LLC | 9,371 | 1.51 | 238 | 7.73 | ||||
| 2025-07-25 | 13F | Atria Wealth Solutions, Inc. | 13,553 | -8.65 | 344 | -2.83 | ||||
| 2025-08-05 | 13F | Ellevest, Inc. | 43,496 | -10.89 | 1,103 | -5.33 | ||||
| 2025-08-08 | 13F | Capital Investment Advisory Services, LLC | 3,423 | 0.44 | 87 | 6.17 | ||||
| 2025-05-12 | 13F | Advisor Group Holdings, Inc. | Call | 0 | -100.00 | 0 | -100.00 | |||
| 2025-05-09 | 13F | GeoWealth Management, LLC | 0 | -100.00 | 0 | |||||
| 2025-08-12 | 13F | Jpmorgan Chase & Co | Call | 907,500 | -26.48 | 60,854 | 7.25 | |||
| 2025-06-27 | NP | GAA - Cambria Global Asset Allocation ETF | 63,028 | 0.00 | 1,542 | 3.91 | ||||
| 2025-08-07 | 13F | Varma Mutual Pension Insurance Co | 3,100,000 | -24.39 | 78,585 | -19.67 | ||||
| 2025-08-04 | 13F | Hantz Financial Services, Inc. | 174 | 0 | ||||||
| 2025-08-14 | 13F | UBS Group AG | 2,812,232 | 19.99 | 71,290 | 27.49 | ||||
| 2025-05-09 | 13F | Truffle Hound Capital, LLC | Call | 0 | -100.00 | 0 | ||||
| 2025-08-19 | 13F | Cape Investment Advisory, Inc. | 1,785 | 63.76 | 45 | 73.08 | ||||
| 2025-07-31 | 13F | Whipplewood Advisors, LLC | 745 | -97.74 | 19 | 0.00 | ||||
| 2025-07-24 | 13F | Acima Private Wealth, Llc | 277,066 | -3.28 | 7,024 | 2.77 | ||||
| 2025-08-13 | 13F | BCJ Capital Management, LLC | 8,326 | 211 | ||||||
| 2025-07-30 | 13F | Evermay Wealth Management Llc | 0 | -100.00 | 0 | |||||
| 2025-08-14 | 13F | Old Mission Capital Llc | 0 | -100.00 | 0 | |||||
| 2025-08-08 | 13F | Cetera Investment Advisers | 84,190 | 13.66 | 2,134 | 20.77 | ||||
| 2025-08-07 | 13F | Marathon Trading Investment Management LLC | Call | 8,000 | -88.15 | 2,231 | -36.55 | |||
| 2025-07-25 | 13F | Concurrent Investment Advisors, LLC | 9,320 | 236 | ||||||
| 2025-05-02 | 13F | Leo Wealth, LLC | 0 | -100.00 | 0 | |||||
| 2025-08-13 | 13F | Townsquare Capital Llc | 0 | -100.00 | 0 | |||||
| 2025-08-26 | NP | Northern Lights Variable Trust - TOPS Balanced ETF Portfolio Class 1 shares | 159,027 | -1.77 | 4,031 | 4.38 | ||||
| 2025-08-26 | NP | LCORX - Leuthold Core Investment Fund Retail Class | 0 | -100.00 | 0 | -100.00 | ||||
| 2025-08-28 | NP | Northern Lights Fund Trust - Sierra Tactical Risk Spectrum 30 Fund Instl Class | 0 | -100.00 | 0 | -100.00 | ||||
| 2025-07-29 | 13F | Balboa Wealth Partners | 16,172 | 77.77 | 410 | 88.48 | ||||
| 2025-08-28 | NP | Northern Lights Fund Trust - Sierra Tactical Risk Spectrum 50 Fund Investor Class | 0 | -100.00 | 0 | -100.00 | ||||
| 2025-07-24 | NP | PLUSX - DWS Multi-Asset Moderate Allocation Fund Class A | 6,363 | 157 | ||||||
| 2025-08-26 | NP | LCR - Leuthold Core ETF | 0 | -100.00 | 0 | -100.00 | ||||
| 2025-08-26 | NP | GLBIX - Leuthold Global Fund Institutional Class | 0 | -100.00 | 0 | -100.00 | ||||
| 2025-08-14 | 13F | Manufacturers Life Insurance Company, The | 60,856 | -74.98 | 1,543 | -73.43 | ||||
| 2025-08-28 | NP | BlackRock Funds V - BlackRock Strategic Income Opportunities Portfolio Investor A Shares | 890,283 | -50.00 | 22,569 | -46.88 | ||||
| 2025-05-14 | 13F | Jane Street Group, Llc | 102,401 | 263.65 | 2,443 | 275.85 | ||||
| 2025-08-01 | 13F | Solstein Capital, LLC | 5,907 | 182.09 | 150 | 204.08 | ||||
| 2025-07-21 | 13F | Ameritas Advisory Services, LLC | 1,372 | -87.52 | 35 | -86.97 | ||||
| 2025-08-13 | 13F | New Harbor Financial Group, LLC | 515,493 | 2.84 | 13,068 | 9.26 | ||||
| 2025-08-14 | 13F | Bank Of America Corp /de/ | 1,243,089 | 4.76 | 31,512 | 11.30 | ||||
| 2025-05-12 | 13F | Simplex Trading, Llc | 0 | -100.00 | 0 | |||||
| 2025-07-17 | 13F | Beacon Capital Management, LLC | 45 | 0.00 | 1 | 0.00 | ||||
| 2025-08-01 | 13F | Gwn Securities Inc. | 0 | -100.00 | 0 | |||||
| 2025-07-29 | 13F | Stratos Wealth Partners, LTD. | 0 | -100.00 | 0 | |||||
| 2025-08-14 | 13F | Moore Capital Management, Lp | 900,000 | 42.95 | 22,815 | 51.88 | ||||
| 2025-07-15 | 13F | FLP Wealth Management, LLC | 0 | -100.00 | 0 | |||||
| 2025-07-25 | 13F | Integrated Capital Management, Inc. | 250,962 | -0.59 | 6,362 | 5.61 | ||||
| 2025-08-14 | 13F | Boston Private Wealth Llc | 0 | -100.00 | 0 | |||||
| 2025-07-23 | 13F | Valmark Advisers, Inc. | 4,105,985 | 2.15 | 104,087 | 8.53 | ||||
| 2025-09-04 | 13F/A | Advisor Group Holdings, Inc. | 48,855 | -0.77 | 1,239 | 5.36 | ||||
| 2025-05-28 | NP | BlackRock ESG Capital Allocation Trust This fund is a listed as child fund of BlackRock, Inc. and if that institution has disclosed ownership in this security, then these positions will not be double counted when calculating total shares and total value | 84,550 | 0.00 | 2,017 | 3.28 | ||||
| 2025-08-28 | NP | Northern Lights Fund Trust - Ocean Park Diversified Income ETF | 38,375 | 48.40 | 973 | 57.54 | ||||
| 2025-08-12 | 13F | Jpmorgan Chase & Co | 679,019 | 37,249.78 | 17,213 | 39,930.23 | ||||
| 2025-04-07 | 13F | GAMMA Investing LLC | 0 | -100.00 | 0 | |||||
| 2025-08-08 | 13F | Larson Financial Group LLC | 384 | 2.13 | 10 | 12.50 | ||||
| 2025-03-21 | 13F | Prostatis Group LLC | 0 | -100.00 | 0 | |||||
| 2025-08-08 | 13F | Police & Firemen's Retirement System of New Jersey | 0 | -100.00 | 0 | |||||
| 2025-07-31 | 13F | Cambridge Investment Research Advisors, Inc. | 74,099 | -8.86 | 2 | 0.00 | ||||
| 2025-08-14 | 13F | Toronto Dominion Bank | 600,000 | 15,210 | ||||||
| 2025-08-12 | 13F | Franklin Resources Inc | 773,281 | 0.00 | 19,603 | 6.24 | ||||
| 2025-08-13 | 13F | Capital Markets Trading UK LLP | Call | 800,100 | 6.89 | 42 | 20.59 | |||
| 2025-08-06 | 13F | First Horizon Advisors, Inc. | 352 | -3.56 | 9 | 0.00 | ||||
| 2025-07-24 | NP | SPDAX - DWS Multi-Asset Conservative Allocation Fund Class A | 36,724 | 906 | ||||||
| 2025-07-18 | 13F | Truist Financial Corp | 211,515 | 1.20 | 5,362 | 7.50 | ||||
| 2025-07-18 | 13F | Bartlett & Co. Wealth Management Llc | 5,284 | -9.30 | 134 | -4.32 | ||||
| 2025-08-14 | 13F | Hrt Financial Lp | 0 | -100.00 | 0 | |||||
| 2025-07-25 | NP | ABWAX - AB All Market Total Return Portfolio Class A | 220,470 | 2,279.34 | 5,441 | 1,960.98 | ||||
| 2025-08-14 | 13F | Navigoe, LLC | 61 | 0 | ||||||
| 2025-07-08 | 13F | Webster Bank, N. A. | 3,393 | 0.00 | 86 | 7.50 | ||||
| 2025-07-22 | 13F | Merit Financial Group, LLC | 134,469 | 71.65 | 3,409 | 82.34 | ||||
| 2025-08-14 | 13F | Sei Investments Co | 8,566,916 | 2.66 | 217,174 | 9.07 | ||||
| 2025-07-30 | 13F | Fairway Wealth LLC | 0 | -100.00 | 0 | |||||
| 2025-08-13 | 13F | Manning & Napier Advisors Llc | 0 | -100.00 | 0 | |||||
| 2025-08-11 | 13F | Compass Capital Corp /ma/ /adv | 8,787 | 0.08 | 221 | 4.25 | ||||
| 2025-08-14 | 13F | Mariner, LLC | 10,978 | 278 | ||||||
| 2025-08-08 | 13F | NAN FUNG TRINITY (HK) Ltd | 0 | -100.00 | 0 | |||||
| 2025-07-31 | 13F | Asset Management One Co., Ltd. | 3,475,495 | 1.84 | 88,104 | 8.20 | ||||
| 2025-08-12 | 13F | Coston, McIsaac & Partners | 0 | -100.00 | 0 | |||||
| 2025-04-30 | 13F | Sofos Investments, Inc. | 512 | 12 | ||||||
| 2025-08-14 | 13F | EP Wealth Advisors, Inc. | 9,509 | -3.93 | 241 | 2.12 | ||||
| 2025-07-16 | 13F | Diversified Enterprises, LLC | 16,122 | -4.89 | 409 | 0.99 | ||||
| 2025-08-08 | 13F | SBI Securities Co., Ltd. | 7,813 | 4.47 | 198 | 11.24 | ||||
| 2025-07-18 | 13F | Viewpoint Investment Partners Corp | 1,407,300 | -17.00 | 35,675 | -11.82 | ||||
| 2025-08-08 | 13F | Pnc Financial Services Group, Inc. | 955 | -14.27 | 24 | -7.69 | ||||
| 2025-08-14 | 13F | Integrated Wealth Concepts LLC | 28,247 | -4.98 | 716 | 0.99 | ||||
| 2025-08-14 | 13F | Group One Trading, L.p. | Call | 1,979,300 | -12.95 | 131,032 | 11.99 | |||
| 2025-07-21 | 13F | Consilium Wealth Advisory, LLC | 9,750 | 247 | ||||||
| 2025-05-23 | 13F | SWAN Capital LLC | 0 | -100.00 | 0 | |||||
| 2025-07-23 | 13F | Columbus Macro, LLC | 20,449 | 518 | ||||||
| 2025-08-11 | 13F | Greykasell Wealth Strategies, Inc. | 689 | 0.00 | 17 | 6.25 | ||||
| 2025-04-21 | 13F | Nelson, Van Denburg & Campbell Wealth Management Group, LLC | 0 | -100.00 | 0 | |||||
| 2025-07-25 | 13F | Cwm, Llc | 3,667 | -21.58 | 0 | |||||
| 2025-08-29 | NP | GDMA - Gadsden Dynamic Multi-Asset ETF | 250,067 | -61.11 | 6,339 | -58.68 | ||||
| 2025-06-25 | NP | AVGAX - BNY Mellon Dynamic Total Return Fund Class A | 152,047 | -7.79 | 3,721 | -4.22 | ||||
| 2025-08-14 | 13F/A | Rockefeller Capital Management L.P. | 46,765 | 6.20 | 1,185 | 12.86 | ||||
| 2025-08-14 | 13F | Comerica Bank | 109,063 | 54.72 | 2,765 | 64.43 | ||||
| 2025-08-26 | NP | Northern Lights Variable Trust - TOPS Managed Risk Flex ETF Portfolio | 135,091 | -8.10 | 3,425 | -2.37 | ||||
| 2025-05-22 | NP | EXCPX - Unconstrained Bond Series Class S | 950,390 | 0.00 | 22,676 | 3.25 | ||||
| 2025-08-12 | 13F | TCTC Holdings, LLC | 2,214 | 56 | ||||||
| 2025-07-21 | 13F | Barrett & Company, Inc. | 15 | 0.00 | 0 | |||||
| 2025-08-14 | 13F | Citadel Advisors Llc | Call | 15,700 | 26.61 | 398 | 34.58 | |||
| 2025-08-07 | 13F | Kestra Private Wealth Services, Llc | 10,842 | 0.36 | 275 | 6.61 | ||||
| 2025-08-13 | 13F | CMT Capital Markets Trading GmbH | Call | 1,792,000 | -14.36 | 93 | -3.12 | |||
| 2025-07-17 | 13F | K2 Financial Inc. | 62,078 | 2.16 | 1,555 | 5.64 | ||||
| 2025-07-25 | 13F | RHS Financial, LLC | 101,021 | -7.87 | 2,561 | -2.14 | ||||
| 2025-07-21 | 13F | CenterStar Asset Management, LLC | Call | 41,200 | 140.94 | 11,490 | 217.73 | |||
| 2025-08-11 | 13F | Nomura Asset Management Co Ltd | 91,525 | 179.47 | 2,320 | 197.06 | ||||
| 2025-08-14 | 13F | Citadel Advisors Llc | 68,796 | 1,744 |