Mga Batayang Estadistika
| Pemilik Institusional | 259 total, 258 long only, 0 short only, 1 long/short - change of -41.70% MRQ |
| Alokasi Portofolio Rata-rata | 0.2670 % - change of -50.33% MRQ |
| Saham Institusional (Jangka Panjang) | 13,004,519 (ex 13D/G) - change of -170.33MM shares -92.91% MRQ |
| Nilai Institusional (Jangka Panjang) | $ 894,292 USD ($1000) |
Kepemilikan Institusional dan Pemegang Saham
Fidelity Covington Trust - Fidelity MSCI Financials Index ETF (US:FNCL) memiliki 259 pemilik institusional dan pemegang saham yang telah mengajukan formulir 13D/G atau 13F kepada Komisi Bursa Efek (Securities Exchange Commission/SEC). Lembaga-lembaga ini memegang total 13,004,519 saham. Pemegang saham terbesar meliputi Lido Advisors, LLC, Charles Schwab Investment Management Inc, Northern Lights Fund Trust - PFG Fidelity Institutional AM® Equity Sector Strategy Fund Class R Shares, Commonwealth Equity Services, Llc, Agf Management Ltd, Morgan Stanley, Congress Wealth Management LLC / DE /, Vicus Capital, LPL Financial LLC, and Full Sail Capital, LLC .
Struktur kepemilikan institusional Fidelity Covington Trust - Fidelity MSCI Financials Index ETF (ARCA:FNCL) menunjukkan posisi terkini di perusahaan oleh institusi dan dana, serta perubahan terbaru dalam ukuran posisi. Pemegang saham utama dapat mencakup investor individu, reksa dana, dana lindung nilai, atau institusi. Jadwal 13D menunjukkan bahwa investor memegang (atau pernah memegang) lebih dari 5% saham perusahaan dan bermaksud (atau pernah bermaksud) untuk secara aktif mengejar perubahan strategi bisnis. Jadwal 13G menunjukkan investasi pasif lebih dari 5%.
The share price as of September 5, 2025 is 75.63 / share. Previously, on September 6, 2024, the share price was 62.08 / share. This represents an increase of 21.83% over that period.

Skor Sentimen Dana
Skor Sentimen Dana (sebelumnya dikenal sebagai Skor Akumulasi Kepemilikan) menemukan saham-saham yang paling banyak dibeli oleh dana. Ini adalah hasil dari model kuantitatif multi-faktor yang canggih yang mengidentifikasi perusahaan dengan tingkat akumulasi institusional tertinggi. Model penilaian menggunakan kombinasi dari total peningkatan pemilik yang diungkapkan, perubahan dalam alokasi portofolio pada pemilik tersebut, dan metrik lainnya. Angka berkisar dari 0 hingga 100, dengan angka yang lebih tinggi menunjukkan tingkat akumulasi yang lebih tinggi dibandingkan dengan perusahaan sejenisnya, dan 50 adalah rata-ratanya.
Frekuensi Pembaruan: Setiap Hari
Lihat Ownership Explorer, yang menyediakan daftar perusahaan dengan peringkat tertinggi.
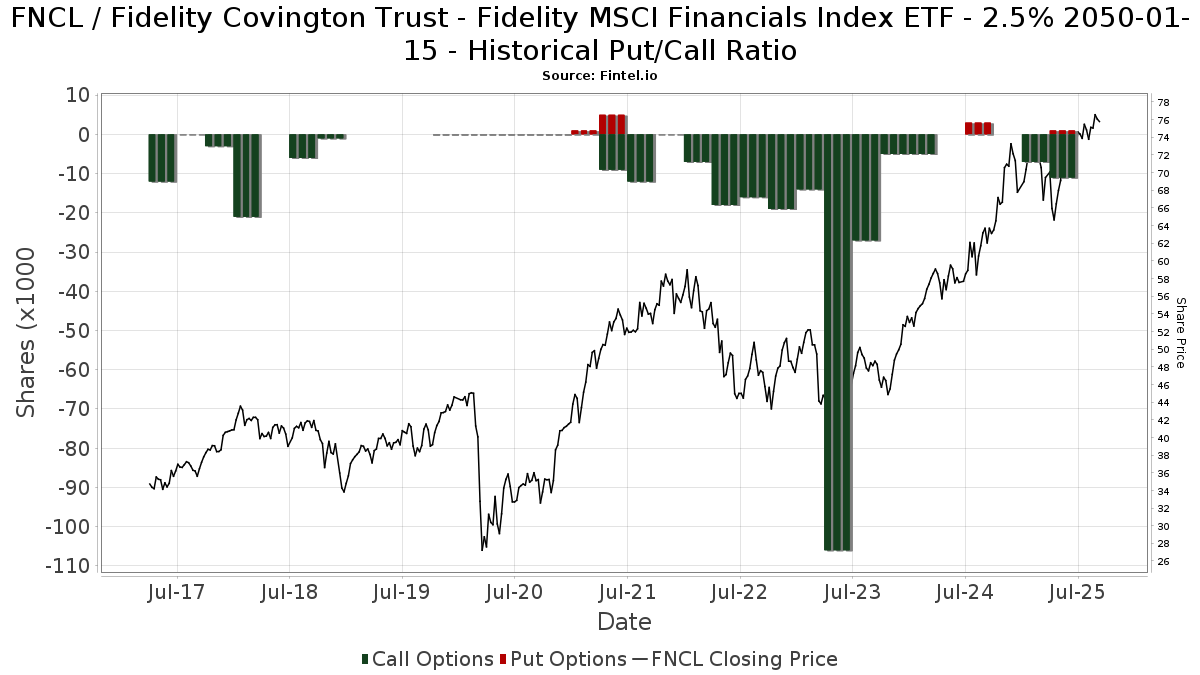
Rasio Put/Call Institusional
Selain melaporkan isu ekuitas dan utang standar, institusi dengan aset di bawah manajemen lebih dari 100 juta dolar AS juga harus mengungkapkan kepemilikan opsi put dan call mereka. Karena opsi put umumnya menunjukkan sentimen negatif, dan opsi call menunjukkan sentimen positif, kita dapat mengetahui sentimen institusional secara keseluruhan dengan memplot rasio put terhadap call. Grafik di sebelah kanan memplot rasio put/call historis untuk instrumen ini.
Menggunakan Rasio Put/Call sebagai indikator sentimen investor mengatasi salah satu kekurangan utama dari penggunaan total kepemilikan institusional, yaitu sejumlah besar aset yang dikelola diinvestasikan secara pasif untuk melacak indeks. Dana yang dikelola secara pasif biasanya tidak membeli opsi, sehingga indikator rasio put/call lebih akurat dalam melacak sentimen dana yang dikelola secara aktif.
Pengajuan 13F dan NPORT
Detail pada pengajuan 13F tersedia gratis. Detail pada pengajuan NP memerlukan keanggotaan premium. Baris berwarna hijau menunjukkan posisi baru. Baris berwarna merah menunjukkan posisi yang sudah ditutup. Klik tautan ini ikon untuk melihat riwayat transaksi selengkapnya.
Tingkatkan
untuk membuka data premium dan mengekspor ke Excel ![]() .
.
| Tanggal File | Sumber | Investor | Ketik | Presyo ng Avg (Silangan) |
Saham | Δ Saham (%) |
Dilaporkan Nilai ($1000) |
Nilai Δ (%) |
Alokasi Port (%) |
|
|---|---|---|---|---|---|---|---|---|---|---|
| 2025-08-14 | 13F | Paragon Private Wealth Management, LLC | 6,955 | 12.63 | 515 | 19.81 | ||||
| 2025-07-17 | 13F | Janney Montgomery Scott LLC | 6,432 | 2.57 | 0 | |||||
| 2025-08-14 | 13F | Full Sail Capital, LLC | 244,575 | -1.36 | 18,108 | 5.06 | ||||
| 2025-07-21 | 13F | Ameritas Advisory Services, LLC | 23,511 | -22.36 | 1,741 | -16.51 | ||||
| 2025-07-23 | 13F | Prasad Wealth Partners, LLC | 3,475 | 0.00 | 257 | 6.64 | ||||
| 2025-08-01 | 13F | Purkiss Capital Advisors LLC | 2,860 | -2.56 | 212 | 3.43 | ||||
| 2025-08-29 | 13F | Centaurus Financial, Inc. | 8,082 | -4.98 | 1 | |||||
| 2025-05-16 | 13F | Arete Wealth Advisors, LLC | 0 | -100.00 | 0 | |||||
| 2025-08-12 | 13F | Personal Cfo Solutions, Llc | 119,296 | 7.37 | 8,833 | 14.36 | ||||
| 2025-08-12 | 13F | Mcdonald Partners Llc | 6,500 | -16.67 | 481 | -11.25 | ||||
| 2025-04-22 | 13F | Rappaport Reiches Capital Management, LLC | 14,190 | 0.42 | 987 | 1.65 | ||||
| 2025-08-13 | 13F | Rsm Us Wealth Management Llc | 3,006 | 0.33 | 223 | 6.73 | ||||
| 2025-08-07 | 13F | Nwam Llc | 2,967 | -23.09 | 222 | -17.16 | ||||
| 2025-08-01 | 13F | Bessemer Group Inc | 0 | -100.00 | 0 | |||||
| 2025-08-04 | 13F | Creative Financial Designs Inc /adv | 460 | 0.00 | 34 | 9.68 | ||||
| 2025-08-08 | 13F | Capital Investment Advisory Services, LLC | 400 | 0.00 | 30 | 7.41 | ||||
| 2025-04-28 | 13F | Mainstream Capital Management LLC | 0 | -100.00 | 0 | |||||
| 2025-08-11 | 13F | Rothschild Investment Llc | 29 | 0.00 | 2 | 0.00 | ||||
| 2025-08-12 | 13F | SRS Capital Advisors, Inc. | 56 | 0.00 | 43 | 1,300.00 | ||||
| 2025-08-14 | 13F | Stifel Financial Corp | 118,899 | -4.04 | 8,803 | 2.21 | ||||
| 2025-04-24 | 13F | CNB Bank | 0 | -100.00 | 0 | |||||
| 2025-08-07 | 13F | Kestra Private Wealth Services, Llc | 37,129 | 6.17 | 2,749 | 13.08 | ||||
| 2025-07-17 | 13F | Montis Financial, LLC | 9,708 | -18.77 | 719 | -13.49 | ||||
| 2025-08-14 | 13F | Snowden Capital Advisors LLC | 28,063 | -0.94 | 2,078 | 5.49 | ||||
| 2025-05-22 | NP | MXFDX - Great-West Core Bond Fund Investor Class | 0 | -100.00 | 0 | -100.00 | ||||
| 2025-04-23 | 13F | Mascagni Wealth Management, Inc. | 0 | -100.00 | 0 | -100.00 | ||||
| 2025-08-01 | 13F | Envestnet Asset Management Inc | 94,086 | 44.27 | 6,966 | 53.67 | ||||
| 2025-08-06 | 13F | Wedbush Securities Inc | 6,782 | 46.48 | 1 | |||||
| 2025-07-15 | 13F | Fifth Third Bancorp | 474 | 0.00 | 35 | 9.38 | ||||
| 2025-05-22 | NP | MXGBX - Great-West Global Bond Fund Investor Class | 0 | -100.00 | 0 | -100.00 | ||||
| 2025-08-12 | 13F | Charles Schwab Investment Management Inc | 1,820,635 | -1.85 | 134,800 | 4.53 | ||||
| 2025-05-14 | 13F | PKS Advisory Services, LLC | 0 | -100.00 | 0 | |||||
| 2025-05-09 | 13F | Pathway Financial Advisers, LLC | 0 | -100.00 | 0 | |||||
| 2025-07-16 | 13F | Dakota Wealth Management | 3,000 | 0.00 | 222 | 6.73 | ||||
| 2025-08-14 | 13F | Susquehanna International Group, Llp | Call | 9,500 | 35.71 | 703 | 44.65 | |||
| 2025-05-12 | 13F | Founders Financial Securities Llc | 0 | -100.00 | 0 | |||||
| 2025-07-16 | 13F | West Branch Capital LLC | 1,425 | -6.56 | 106 | -0.94 | ||||
| 2025-08-15 | 13F | Captrust Financial Advisors | 2,866 | 212 | ||||||
| 2025-08-13 | 13F | Cresset Asset Management, LLC | 3,890 | -4.98 | 288 | 1.41 | ||||
| 2025-08-14 | 13F | Fmr Llc | 71,164 | -1.59 | 5,269 | 4.81 | ||||
| 2025-08-05 | 13F | Smith Shellnut Wilson Llc /adv | 30,894 | -5.12 | 2,287 | 1.06 | ||||
| 2025-08-12 | 13F | Atlas Capital Advisors Llc | 15,731 | 0.00 | 1,165 | 6.50 | ||||
| 2025-08-14 | 13F | Quantinno Capital Management LP | 18,459 | 14.95 | 1,367 | 22.40 | ||||
| 2025-07-14 | 13F | AdvisorNet Financial, Inc | 44 | -88.83 | 3 | -88.89 | ||||
| 2025-07-17 | 13F | Wolff Wiese Magana Llc | 39 | 0.00 | 3 | 0.00 | ||||
| 2025-08-12 | 13F | Franklin Resources Inc | 1,000 | -69.75 | 74 | -67.69 | ||||
| 2025-07-29 | 13F | Signature Estate & Investment Advisors Llc | 2,716 | -11.73 | 201 | -5.63 | ||||
| 2025-07-16 | 13F | Fischer Financial Services, Inc. | 148,236 | -2.07 | 10,974 | 4.29 | ||||
| 2025-07-29 | 13F | Koshinski Asset Management, Inc. | 3,462 | -9.18 | 256 | -3.03 | ||||
| 2025-08-07 | 13F | Allworth Financial LP | 47 | -67.36 | 3 | -66.67 | ||||
| 2025-08-12 | 13F | Tableaux Llc | 17,756 | 1,002 | ||||||
| 2025-04-28 | 13F | Strategic Financial Concepts, LLC | 0 | -100.00 | 0 | -100.00 | ||||
| 2025-08-12 | 13F | Proequities, Inc. | 0 | 0 | ||||||
| 2025-07-22 | 13F | Valley National Advisers Inc | 2,267 | 0.00 | 0 | |||||
| 2025-07-18 | 13F | Founders Capital Management | 7 | 0.00 | 0 | |||||
| 2025-08-05 | 13F | Sigma Planning Corp | 20,767 | -9.86 | 1,538 | -4.00 | ||||
| 2025-07-24 | 13F | Galvin, Gaustad & Stein, LLC | 8,801 | -14.14 | 652 | -8.57 | ||||
| 2025-07-23 | 13F | Pillar Financial Advisors, LLC | 51 | 0.00 | 4 | 0.00 | ||||
| 2025-07-16 | 13F | Brown, Lisle/cummings, Inc. | 41 | 0.00 | 3 | 50.00 | ||||
| 2025-07-29 | 13F | Stratos Wealth Advisors, LLC | 3,868 | 0.03 | 286 | 6.72 | ||||
| 2025-08-06 | 13F | Aspetuck Financial Management LLC | 21,482 | -1.81 | 1,591 | 4.61 | ||||
| 2025-07-02 | 13F | Central Pacific Bank - Trust Division | 29 | 0.00 | 2 | 0.00 | ||||
| 2025-05-15 | 13F/A | Orion Portfolio Solutions, LLC | 41,943 | 6.45 | 2,916 | 7.72 | ||||
| 2025-08-01 | 13F | Belvedere Trading LLC | Call | 1,800 | 133 | |||||
| 2025-08-01 | 13F | Belvedere Trading LLC | Put | 1,100 | 81 | |||||
| 2025-07-30 | 13F | Financial Perspectives, Inc | 501 | 0.20 | 37 | 8.82 | ||||
| 2025-08-08 | 13F | Pnc Financial Services Group, Inc. | 1,223 | 0.00 | 91 | 5.88 | ||||
| 2025-07-24 | 13F | Robertson Stephens Wealth Management, LLC | 24,640 | -5.36 | 1,824 | 0.83 | ||||
| 2025-08-13 | 13F | Financial Freedom, LLC | 7,261 | 0.28 | 538 | 6.76 | ||||
| 2025-08-14 | 13F | Sunbelt Securities, Inc. | 10,803 | -1.62 | 742 | -2.88 | ||||
| 2025-08-06 | 13F | First Horizon Advisors, Inc. | 618 | 0.00 | 46 | 7.14 | ||||
| 2025-05-05 | 13F | Lindbrook Capital, Llc | 3 | 0.00 | 0 | |||||
| 2025-08-15 | 13F | Kestra Advisory Services, LLC | 137,110 | 7.49 | 10,152 | 14.48 | ||||
| 2025-08-14 | 13F | GWM Advisors LLC | 12,793 | -19.57 | 947 | -14.30 | ||||
| 2025-08-07 | 13F | Panoramic Investment Advisors, Llc | 3,900 | -4.29 | 289 | 1.77 | ||||
| 2025-05-15 | 13F | Minot DeBlois Advisors LLC | 0 | -100.00 | 0 | |||||
| 2025-07-29 | 13F | AssuredPartners Investment Advisors, LLC | 9,519 | -6.52 | 705 | -0.42 | ||||
| 2025-07-17 | 13F | CWA Asset Management Group, LLC | 3,405 | 0.00 | 252 | 6.78 | ||||
| 2025-08-12 | 13F | Steward Partners Investment Advisory, Llc | 56,819 | 3,394.40 | 4,207 | 3,622.12 | ||||
| 2025-08-04 | 13F | Pensionmark Financial Group, Llc | 9,636 | 5.46 | 713 | 12.28 | ||||
| 2025-08-12 | 13F | Jpmorgan Chase & Co | 146,906 | -0.06 | 10,877 | 6.43 | ||||
| 2025-07-22 | 13F | Yoder Wealth Management, Inc. | 63,159 | 1.48 | 4,676 | 8.09 | ||||
| 2025-08-01 | 13F | Belvedere Trading LLC | 459 | 34 | ||||||
| 2025-08-14 | 13F | EP Wealth Advisors, Inc. | 32,802 | -1.57 | 2,429 | 4.84 | ||||
| 2025-07-31 | 13F | Moser Wealth Advisors, LLC | 75 | 6 | ||||||
| 2025-08-13 | 13F | KDK Private Wealth Management, LLC | 26,103 | -2.27 | 1,933 | 4.21 | ||||
| 2025-07-16 | 13F | PFS Partners, LLC | 39 | 0.00 | 3 | 0.00 | ||||
| 2025-08-14 | 13F | Transamerica Financial Advisors, Inc. | 26 | -38.10 | 2 | |||||
| 2025-07-16 | 13F | Signature Resources Capital Management, LLC | 889 | 66 | ||||||
| 2025-07-18 | 13F | Bartlett & Co. Wealth Management Llc | 17 | 0.00 | 1 | 0.00 | ||||
| 2025-08-13 | 13F | Fisher Asset Management, LLC | 14,705 | 52.51 | 1,089 | 62.39 | ||||
| 2025-08-18 | 13F | Geneos Wealth Management Inc. | 626 | -4.43 | 46 | 2.22 | ||||
| 2025-07-30 | 13F | Gables Capital Management Inc. | 283 | 0.00 | 21 | 5.26 | ||||
| 2025-08-11 | 13F | FSA Wealth Management LLC | 543 | 0.37 | 40 | 8.11 | ||||
| 2025-08-13 | 13F | River Wealth Advisors LLC | 4,546 | -1.11 | 337 | 5.33 | ||||
| 2025-07-28 | 13F | Variant Private Wealth, LLC | 7,751 | 0.35 | 574 | 6.90 | ||||
| 2025-08-15 | 13F | Tower Research Capital LLC (TRC) | 2,855 | -59.21 | 211 | -56.58 | ||||
| 2025-08-07 | 13F | PFG Advisors | 0 | -100.00 | 0 | |||||
| 2025-08-06 | 13F | Agf Management Ltd | 579,183 | -30.13 | 42,883 | -25.59 | ||||
| 2025-08-08 | 13F | Cetera Investment Advisers | 23,901 | 2.50 | 1,770 | 9.13 | ||||
| 2025-08-04 | 13F | Bay Colony Advisory Group, Inc d/b/a Bay Colony Advisors | 9,694 | -11.73 | 718 | -4.91 | ||||
| 2025-08-05 | 13F | Advisors Preferred, LLC | 0 | -100.00 | 0 | |||||
| 2025-08-08 | 13F | Meridian Wealth Management, LLC | 16,554 | 0.59 | 1,226 | 7.08 | ||||
| 2025-07-28 | 13F | Mutual Advisors, LLC | 5,588 | -1.88 | 424 | 11.02 | ||||
| 2025-08-11 | 13F | Western Wealth Management, LLC | 12,362 | 0.02 | 915 | 6.52 | ||||
| 2025-08-13 | 13F | Jones Financial Companies Lllp | 12,843 | 47.86 | 942 | 58.05 | ||||
| 2025-08-12 | 13F | O'shaughnessy Asset Management, Llc | 37,160 | 12.87 | 2,751 | 20.24 | ||||
| 2025-08-11 | 13F | Brown Brothers Harriman & Co | 2,467 | 406.57 | 183 | 451.52 | ||||
| 2025-08-12 | 13F | Howe & Rusling Inc | 797 | 59 | ||||||
| 2025-08-14 | 13F | Glenmede Investment Management, LP | 49 | 4 | ||||||
| 2025-07-31 | 13F | Cambridge Investment Research Advisors, Inc. | 50,949 | 3.62 | 4 | 0.00 | ||||
| 2025-08-14 | 13F | Blue Capital, Inc. | 14,392 | 70.32 | 1,066 | 83.62 | ||||
| 2025-08-08 | 13F | Crossmark Global Holdings, Inc. | 13,125 | -4.95 | 972 | 1.25 | ||||
| 2025-08-08 | 13F | Larson Financial Group LLC | 40 | 0.00 | 3 | 0.00 | ||||
| 2025-08-18 | 13F | Wolverine Trading, Llc | 0 | -100.00 | 0 | |||||
| 2025-07-30 | 13F | Wbh Advisory Inc | 6,760 | 28.40 | 501 | 36.61 | ||||
| 2025-04-22 | 13F | Center for Financial Planning, Inc. | 0 | -100.00 | 0 | |||||
| 2025-07-16 | 13F/A | CX Institutional | 1,478 | 283.90 | 0 | |||||
| 2025-07-02 | 13F | HBW Advisory Services LLC | 3,996 | -46.09 | 296 | -42.72 | ||||
| 2025-07-30 | 13F | Retirement Planning Group | 18,033 | 12.14 | 1,335 | 19.52 | ||||
| 2025-07-17 | 13F | Keystone Global Partners, LLC | 0 | -100.00 | 0 | |||||
| 2025-07-31 | 13F | BIP Wealth, LLC | 3,112 | 0.39 | 230 | 6.98 | ||||
| 2025-08-12 | 13F | Global Retirement Partners, LLC | 4,052 | 1.22 | 300 | 9.49 | ||||
| 2025-04-29 | 13F | Element Wealth, LLC | 0 | -100.00 | 0 | |||||
| 2025-08-14 | 13F | UBS Group AG | 29,468 | 4.97 | 2,182 | 11.79 | ||||
| 2025-05-29 | NP | Six Circles Trust - Six Circles Multi-Strategy Fund | 0 | -100.00 | 0 | -100.00 | ||||
| 2025-08-04 | 13F | Spire Wealth Management | 100 | -75.00 | 7 | -74.07 | ||||
| 2025-08-12 | 13F | AlphaCore Capital LLC | 48 | 4 | ||||||
| 2025-05-13 | 13F | Measured Risk Portfolios, Inc. | 0 | -100.00 | 0 | |||||
| 2025-05-29 | NP | Six Circles Trust - Six Circles Global Bond Fund | 0 | -100.00 | 0 | -100.00 | ||||
| 2025-07-21 | 13F | Patriot Financial Group Insurance Agency, LLC | 33,181 | 2.07 | 2,457 | 8.67 | ||||
| 2025-07-30 | 13F | Bogart Wealth, LLC | 1,544 | 0.00 | 114 | 6.54 | ||||
| 2025-08-19 | 13F | Cape Investment Advisory, Inc. | 28 | 3.70 | 2 | 100.00 | ||||
| 2025-07-30 | 13F | Pacific Sun Financial Corp | 8,287 | 3.93 | 614 | 10.65 | ||||
| 2025-07-21 | 13F | Pflug Koory, LLC | 25 | 0.00 | 2 | 0.00 | ||||
| 2025-08-06 | 13F | Legacy Wealth Managment, LLC/ID | 0 | -100.00 | 0 | |||||
| 2025-08-14 | 13F | CoreCap Advisors, LLC | 35 | -48.53 | 3 | -50.00 | ||||
| 2025-07-28 | 13F | Harbour Investments, Inc. | 1,804 | 3.32 | 134 | 9.92 | ||||
| 2025-08-14 | 13F | Mpwm Advisory Solutions, Llc | 1,212 | 203.00 | 90 | 229.63 | ||||
| 2025-08-05 | 13F | Beckerman Institutional, LLC | 5,673 | -0.35 | 0 | |||||
| 2025-08-14 | 13F | Kovitz Investment Group Partners, LLC | 215,753 | 141.10 | 15,974 | 156.78 | ||||
| 2025-08-14 | 13F | Great Valley Advisor Group, Inc. | 17,752 | -10.35 | 1,314 | -4.51 | ||||
| 2025-08-12 | 13F | CIBC Private Wealth Group, LLC | 85 | 0.00 | 6 | 20.00 | ||||
| 2025-04-29 | 13F | Lee Danner & Bass Inc | 0 | -100.00 | 0 | |||||
| 2025-08-19 | 13F | Advisory Services Network, LLC | 8,061 | -88.29 | 599 | -87.51 | ||||
| 2025-08-14 | 13F | Citadel Advisors Llc | 3,962 | -80.11 | 293 | -78.84 | ||||
| 2025-08-11 | 13F | TD Waterhouse Canada Inc. | 1,000 | 0.00 | 75 | 7.25 | ||||
| 2025-08-14 | 13F | Wells Fargo & Company/mn | 161,219 | -11.28 | 11,937 | -5.51 | ||||
| 2025-07-29 | 13F | TFC Financial Management | 1,004 | 0.00 | 74 | 7.25 | ||||
| 2025-08-14 | 13F | Raymond James Financial Inc | 18,810 | -2.34 | 1,393 | 4.04 | ||||
| 2025-07-17 | 13F | Smith Chas P & Associates Pa Cpas | 3,994 | 0.00 | 296 | 6.50 | ||||
| 2025-07-24 | 13F | IFP Advisors, Inc | 6,071 | -20.52 | 450 | -15.44 | ||||
| 2025-08-11 | 13F | Beaumont Capital Management, LLC | 83,159 | 6,157 | ||||||
| 2025-07-15 | 13F | Mather Group, Llc. | 0 | -100.00 | 0 | |||||
| 2025-08-04 | 13F | Amplius Wealth Advisors, LLC | 3,002 | 0.87 | 222 | 7.77 | ||||
| 2025-08-14 | 13F | Boston Private Wealth Llc | 3,762 | 279 | ||||||
| 2025-07-31 | 13F | Briaud Financial Planning, Inc | 346 | 0 | ||||||
| 2025-08-06 | 13F | Prospera Financial Services Inc | 3,137 | -8.70 | 233 | -2.93 | ||||
| 2025-07-15 | 13F | Aspire Capital Advisors LLC | 27,216 | -44.14 | 2,015 | -40.49 | ||||
| 2025-07-18 | 13F | Truist Financial Corp | 10,592 | 5.06 | 784 | 12.00 | ||||
| 2025-09-04 | 13F/A | Advisor Group Holdings, Inc. | 115,966 | 0.09 | 8,605 | 6.60 | ||||
| 2025-08-05 | 13F | Lifeworks Advisors, LLC | 3,913 | 2.81 | 290 | 9.47 | ||||
| 2025-08-26 | 13F/A | Thrivent Financial For Lutherans | 78,514 | 6.22 | 6 | 0.00 | ||||
| 2025-07-22 | 13F | D.B. Root & Company, LLC | 4,850 | -5.25 | 359 | 1.13 | ||||
| 2025-07-28 | 13F | Rosenberg Matthew Hamilton | 2,928 | 0.00 | 217 | 6.40 | ||||
| 2025-07-09 | 13F | Procyon Private Wealth Partners, LLC | 114,516 | 52.56 | 8,479 | 62.48 | ||||
| 2025-07-25 | 13F | Atria Wealth Solutions, Inc. | 25,514 | -40.71 | 1,924 | -35.67 | ||||
| 2025-05-08 | NP | QALTX - Quantified Alternative Investment Fund Investor Class Shares | 2,423 | 498.27 | 168 | 700.00 | ||||
| 2025-07-15 | 13F | Main Street Group, LTD | 100 | 0.00 | 7 | 16.67 | ||||
| 2025-07-23 | 13F | Monte Financial Group, LLC | 4,241 | 6.16 | 314 | 21.24 | ||||
| 2025-07-24 | 13F | Blair William & Co/il | 752 | 0.00 | 56 | 5.77 | ||||
| 2025-06-30 | NP | Northern Lights Fund Trust - PFG Fidelity Institutional AM® Equity Sector Strategy Fund Class R Shares | 1,369,787 | 21.73 | 93,091 | 13.10 | ||||
| 2025-07-14 | 13F | Buska Wealth Management, LLC | 68,815 | 114.74 | 5,095 | 128.78 | ||||
| 2025-08-05 | 13F | Mission Wealth Management, Lp | 5,496 | 0.27 | 407 | 6.56 | ||||
| 2025-07-24 | 13F | Court Place Advisors, LLC | 8,340 | -2.19 | 617 | 4.22 | ||||
| 2025-08-05 | 13F | Bank of New York Mellon Corp | 8,001 | -4.64 | 592 | 1.54 | ||||
| 2025-08-11 | 13F | Aptus Capital Advisors, LLC | 417 | 0.24 | 31 | 7.14 | ||||
| 2025-07-29 | 13F | Harbor Asset Planning, Inc. | 28,348 | 2,099 | ||||||
| 2025-07-07 | 13F | Nova Wealth Management, Inc. | 13,362 | 20.55 | 989 | 28.44 | ||||
| 2025-07-25 | 13F | Strategic Point Investment Advisors, LLC | 205,883 | 0.77 | 15,244 | 7.32 | ||||
| 2025-07-22 | 13F | Merit Financial Group, LLC | 10,494 | -6.87 | 777 | -0.77 | ||||
| 2025-07-25 | 13F | Valley Brook Capital Group, Inc. | 4,470 | 1.15 | 331 | 7.49 | ||||
| 2025-07-30 | NP | QVOY - Q3 All-Season Active Rotation ETF | 0 | -100.00 | 0 | -100.00 | ||||
| 2025-07-11 | 13F | Farther Finance Advisors, LLC | 848 | -70.69 | 63 | -69.00 | ||||
| 2025-08-13 | 13F | Summit Financial, LLC | 12,816 | -7.99 | 949 | -2.07 | ||||
| 2025-08-08 | 13F | Avantax Advisory Services, Inc. | 3,237 | -13.33 | 240 | -7.72 | ||||
| 2025-08-14 | 13F | Mml Investors Services, Llc | 13,111 | -74.17 | 1 | -100.00 | ||||
| 2025-07-15 | 13F | Lynch & Associates/in | 34,820 | 3.58 | 2,578 | 10.31 | ||||
| 2025-08-14 | 13F | Atomi Financial Group, Inc. | 3,224 | 10.90 | 239 | 17.82 | ||||
| 2025-07-31 | 13F | CVA Family Office, LLC | 325 | 0.00 | 24 | 9.09 | ||||
| 2025-08-27 | 13F/A | Brinker Capital Investments, LLC | 39,904 | -4.86 | 2,954 | 1.34 | ||||
| 2025-07-31 | 13F | Sage Mountain Advisors LLC | 1,686 | 0.00 | 125 | 5.98 | ||||
| 2025-05-16 | 13F | Empowered Funds, LLC | 0 | -100.00 | 0 | |||||
| 2025-08-14 | 13F | Old Mission Capital Llc | 4,693 | 347 | ||||||
| 2025-07-09 | 13F | Bank of New Hampshire | 169 | 0.00 | 13 | 9.09 | ||||
| 2025-08-14 | 13F | Qube Research & Technologies Ltd | 1,801 | 14.13 | 133 | 22.02 | ||||
| 2025-04-23 | 13F | PMV Capital Advisers, LLC | 0 | -100.00 | 0 | |||||
| 2025-07-24 | 13F | Us Bancorp \de\ | 1,225 | -63.33 | 91 | -61.21 | ||||
| 2025-07-15 | 13F | Am Investment Strategies Llc | 3,575 | 0.22 | 0 | |||||
| 2025-08-06 | 13F | AE Wealth Management LLC | 92,730 | 6.50 | 6,866 | 13.41 | ||||
| 2025-04-30 | 13F | Round Rock Advisors, LLC | 0 | -100.00 | 0 | |||||
| 2025-07-31 | 13F | United Community Bank | 582 | 0.00 | 43 | 7.50 | ||||
| 2025-07-28 | 13F | Axxcess Wealth Management, Llc | 12,180 | 127.71 | 902 | 142.86 | ||||
| 2025-08-05 | 13F | EPG Wealth Management LLC | 733 | 0.14 | 54 | 8.00 | ||||
| 2025-08-12 | 13F | MAI Capital Management | 1,675 | 0.00 | 124 | 6.90 | ||||
| 2025-08-14 | 13F | Bank Of America Corp /de/ | 102,212 | 17.38 | 7,568 | 25.01 | ||||
| 2025-08-01 | 13F | SYM FINANCIAL Corp | 700 | 52 | ||||||
| 2025-08-06 | 13F | Golden State Wealth Management, LLC | 0 | -100.00 | 0 | |||||
| 2025-08-11 | 13F | HighTower Advisors, LLC | 85,592 | -3.77 | 6,337 | 2.49 | ||||
| 2025-07-08 | 13F | Webster Bank, N. A. | 0 | -100.00 | 0 | |||||
| 2025-07-10 | 13F | Wealth Enhancement Advisory Services, Llc | 10,662 | 5.23 | 804 | 14.20 | ||||
| 2025-07-24 | 13F | Williams & Novak, LLC | 3,325 | -18.20 | 246 | -12.46 | ||||
| 2025-08-04 | 13F | Savvy Advisors, Inc. | 3,098 | -2.94 | 229 | 3.62 | ||||
| 2025-08-12 | 13F | J.w. Cole Advisors, Inc. | 6,404 | 474 | ||||||
| 2025-08-07 | 13F | Traynor Capital Management, Inc. | 13,646 | 0.69 | 1,017 | 7.86 | ||||
| 2025-08-14 | 13F | Florida Financial Advisors, Llc | 0 | -100.00 | 0 | |||||
| 2025-08-14 | 13F | Modern Wealth Management, LLC | 137,539 | 139.89 | 10,183 | 155.53 | ||||
| 2025-07-16 | 13F | Essex Financial Services, Inc. | 7,218 | -5.67 | 534 | 0.56 | ||||
| 2025-08-11 | 13F | Private Advisor Group, LLC | 15,133 | -49.24 | 1,120 | -45.95 | ||||
| 2025-08-25 | 13F/A | Promus Capital, LLC | 210 | 0.00 | 16 | 7.14 | ||||
| 2025-08-05 | 13F | Benchmark Financial Wealth Advisors, LLC | 8,756 | 648 | ||||||
| 2025-07-15 | 13F | Cranbrook Wealth Management, LLC | 0 | -100.00 | 0 | |||||
| 2025-08-04 | 13F | Assetmark, Inc | 448 | -23.42 | 33 | -17.50 | ||||
| 2025-08-06 | 13F | Rialto Wealth Management, LLC | 4,377 | 0.00 | 324 | 6.58 | ||||
| 2025-07-25 | 13F | G2 Capital Management, Llc / Oh | 12,479 | 0.00 | 924 | 6.46 | ||||
| 2025-07-29 | 13F | Spirit Of America Management Corp/ny | 2,433 | -11.59 | 181 | -5.24 | ||||
| 2025-08-06 | 13F | Decker Retirement Planning Inc. | 423 | 0.00 | 31 | 6.90 | ||||
| 2025-08-08 | 13F | Creative Planning | 13,595 | 6.17 | 1,007 | 13.03 | ||||
| 2025-07-16 | 13F | Beaumont Financial Advisors, LLC | 0 | -100.00 | 0 | |||||
| 2025-08-13 | 13F | Renaissance Technologies Llc | 0 | -100.00 | 0 | |||||
| 2025-08-14 | 13F | Glen Eagle Advisors, LLC | 510 | 0.00 | 38 | 5.71 | ||||
| 2025-08-07 | 13F | BOK Financial Private Wealth, Inc. | 87 | 0.00 | 6 | 0.00 | ||||
| 2025-08-08 | 13F | Independence Financial Advisors, LLC | 144,405 | 3.39 | 10,692 | 10.11 | ||||
| 2025-08-14 | 13F | Ancora Advisors, LLC | 0 | 0 | ||||||
| 2025-08-14 | 13F | Wiley Bros.-aintree Capital, Llc | 9,219 | 23.83 | 683 | 33.46 | ||||
| 2025-08-04 | 13F | Arkadios Wealth Advisors | 3,695 | 0.08 | 274 | 6.64 | ||||
| 2025-08-13 | 13F | Quadrant Capital Group Llc | 0 | -100.00 | 0 | |||||
| 2025-08-15 | 13F | CI Private Wealth, LLC | 2,967 | 0.00 | 220 | 6.31 | ||||
| 2025-07-11 | 13F | LongView Wealth Management | 7,562 | 8.14 | 560 | 15.02 | ||||
| 2025-08-13 | 13F | Whalerock Point Partners, Llc | 3,479 | 0.00 | 258 | 6.64 | ||||
| 2025-07-25 | 13F | Envestnet Portfolio Solutions, Inc. | 0 | -100.00 | 0 | |||||
| 2025-07-07 | 13F | Roxbury Financial LLC | 7,944 | 3.84 | 588 | 4.81 | ||||
| 2025-08-13 | 13F | Colonial Trust Co / SC | 362 | 27 | ||||||
| 2025-08-14 | 13F | Bnp Paribas Arbitrage, Sa | 0 | -100.00 | 0 | |||||
| 2025-08-07 | 13F | Addison Advisors LLC | 743 | 0.00 | 55 | 7.84 | ||||
| 2025-08-14 | 13F | Jane Street Group, Llc | 0 | -100.00 | 0 | |||||
| 2025-04-21 | 13F | Nelson, Van Denburg & Campbell Wealth Management Group, LLC | 0 | -100.00 | 0 | |||||
| 2025-07-08 | 13F | Atlas Brown,Inc. | 3,693 | 1.29 | 273 | 7.91 | ||||
| 2025-07-16 | 13F | American National Bank | 9,711 | 11.28 | 719 | 18.65 | ||||
| 2025-07-08 | 13F | Parallel Advisors, LLC | 1,130 | 0.00 | 84 | 6.41 | ||||
| 2025-07-10 | 13F | Oliver Lagore Vanvalin Investment Group | 289 | 0.00 | 20 | 5.26 | ||||
| 2025-05-28 | NP | BBTBX - Bridge Builder Core Bond Fund | 0 | -100.00 | 0 | -100.00 | ||||
| 2025-05-28 | NP | BBCPX - Bridge Builder Core Plus Bond Fund | 0 | -100.00 | 0 | -100.00 | ||||
| 2025-08-13 | 13F | Northwestern Mutual Wealth Management Co | 93,931 | -53.30 | 6,955 | -50.26 | ||||
| 2025-08-14 | 13F | Comerica Bank | 4,053 | 0.15 | 300 | 6.76 | ||||
| 2025-05-13 | 13F | Heck Capital Advisors, LLC | 0 | -100.00 | 0 | -100.00 | ||||
| 2025-07-29 | 13F | Primoris Wealth Advisors, Llc | 4,225 | 313 | ||||||
| 2025-07-21 | 13F | HighMark Wealth Management LLC | 550 | 0.00 | 41 | 5.26 | ||||
| 2025-08-14 | 13F | Mariner, LLC | 47,625 | -3.88 | 3,526 | 2.38 | ||||
| 2025-08-06 | 13F | Atlantic Union Bankshares Corp | 43 | 3 | ||||||
| 2025-08-12 | 13F | Pathstone Holdings, LLC | 8,016 | -44.83 | 594 | -41.69 | ||||
| 2025-08-15 | 13F | Morgan Stanley | 331,555 | 2.76 | 24,548 | 9.44 | ||||
| 2025-07-18 | 13F | Vicus Capital | 299,652 | 2.51 | 22,186 | 9.17 | ||||
| 2025-08-07 | 13F | Birchcreek Wealth Management, LLC | 19,576 | 5.43 | 1,449 | 12.33 | ||||
| 2025-07-17 | 13F | Smith, Salley & Associates | 53,785 | 1.34 | 3,982 | 7.94 | ||||
| 2025-08-06 | 13F | Kcm Investment Advisors Llc | 3,859 | 0.00 | 286 | 6.34 | ||||
| 2025-07-16 | 13F | Signaturefd, Llc | 35 | 0.00 | 3 | 0.00 | ||||
| 2025-08-14 | 13F | Susquehanna International Group, Llp | 0 | -100.00 | 0 | |||||
| 2025-08-07 | 13F | Hughes Financial Services, LLC | 14 | 0.00 | 1 | |||||
| 2025-08-13 | 13F | Lido Advisors, LLC | 2,508,013 | -0.78 | 185,693 | 5.67 | ||||
| 2025-08-14 | 13F | Integrated Wealth Concepts LLC | 3,578 | 265 | ||||||
| 2025-08-13 | 13F | Flow Traders U.s. Llc | 0 | -100.00 | 0 | |||||
| 2025-05-12 | 13F | Sandy Spring Bank | 43 | 0.00 | 3 | 0.00 | ||||
| 2025-08-14 | 13F | Goldman Sachs Group Inc | 22,700 | 168.70 | 1,681 | 186.20 | ||||
| 2025-08-08 | 13F | Capital Investment Counsel, Inc | 5,433 | -3.53 | 402 | 2.81 | ||||
| 2025-07-01 | 13F | Harbor Investment Advisory, Llc | 0 | -100.00 | 0 | |||||
| 2025-07-28 | 13F | Acorn Financial Advisory Services Inc /adv | 9,471 | 34.23 | 701 | 43.06 | ||||
| 2025-08-04 | 13F | Prairie Wealth Advisors, Inc. | 7,045 | 2.85 | 522 | 9.45 | ||||
| 2025-07-09 | 13F | Breakwater Capital Group | 5,966 | -0.07 | 442 | 6.27 | ||||
| 2025-08-12 | 13F | Coldstream Capital Management Inc | 0 | -100.00 | 0 | |||||
| 2025-08-13 | 13F | Congress Wealth Management LLC / DE / | 312,278 | -2.01 | 23,121 | 4.36 | ||||
| 2025-09-03 | 13F | Q3 Asset Management | 0 | -100.00 | 0 | |||||
| 2025-07-15 | 13F | Elevated Capital Advisors, LLC | 4,167 | 0.00 | 290 | 0.00 | ||||
| 2025-08-14 | 13F | Visionary Wealth Advisors | 3,036 | 0.00 | 225 | 6.16 | ||||
| 2025-08-06 | 13F | Valued Wealth Advisors LLC | 73 | 0.00 | 5 | 0.00 | ||||
| 2025-07-28 | 13F | RFG Advisory, LLC | 5,870 | 72.65 | 435 | 83.90 | ||||
| 2025-07-14 | 13F | UMA Financial Services, Inc. | 208 | -22.10 | 15 | -16.67 | ||||
| 2025-08-14 | 13F | Two Sigma Investments, Lp | 94,900 | 7,026 | ||||||
| 2025-08-13 | 13F | Russell Investments Group, Ltd. | 49 | 345.45 | 4 | |||||
| 2025-05-06 | 13F | Venturi Wealth Management, LLC | 0 | -100.00 | 0 | |||||
| 2025-04-21 | 13F | SILVER OAK SECURITIES, Inc | 0 | -100.00 | 0 | |||||
| 2025-07-17 | 13F | Sound Income Strategies, LLC | 138 | 0.00 | 10 | 11.11 | ||||
| 2025-07-18 | 13F | Tanager Wealth Management LLP | 0 | -100.00 | 0 | |||||
| 2025-07-21 | 13F | Exchange Capital Management, Inc. | 31,955 | -2.79 | 2,366 | 3.50 | ||||
| 2025-08-06 | 13F | Mcrae Capital Management Inc | 6,110 | 452 | ||||||
| 2025-05-12 | 13F | Richard W. Paul & Associates, LLC | 0 | -100.00 | 0 | -100.00 | ||||
| 2025-07-30 | 13F | VCI Wealth Management LLC | 32,989 | 8.22 | 2,443 | 15.24 | ||||
| 2025-07-21 | 13F | Quent Capital, LLC | 0 | -100.00 | 0 | |||||
| 2025-05-01 | 13F | High Note Wealth, LLC | 0 | -100.00 | 0 | |||||
| 2025-08-14 | 13F | Colony Group, LLC | 2,881 | 0.03 | 213 | 6.50 | ||||
| 2025-08-11 | 13F | Tidemark, LLC | 150 | 0.00 | 11 | 10.00 | ||||
| 2025-08-14 | 13F | Ameriprise Financial Inc | 103,983 | 120.41 | 7,702 | 134.89 | ||||
| 2025-07-25 | 13F | Cwm, Llc | 32,406 | 347.47 | 2 | |||||
| 2025-08-06 | 13F | Maltin Wealth Management, Inc. | 55,546 | 1.63 | 4,113 | 8.24 | ||||
| 2025-08-12 | 13F | LPL Financial LLC | 245,399 | -13.87 | 18,169 | -8.27 | ||||
| 2025-08-14 | 13F | Royal Bank Of Canada | 20,594 | -32.72 | 1,524 | -28.38 | ||||
| 2025-08-11 | 13F | Citigroup Inc | 27,101 | -6.62 | 2,007 | -0.55 | ||||
| 2025-08-14 | 13F | Mercer Global Advisors Inc /adv | 7,739 | -15.57 | 573 | -10.20 | ||||
| 2025-07-09 | 13F | Pallas Capital Advisors LLC | 7,430 | -0.50 | 550 | 5.97 | ||||
| 2025-07-31 | 13F | Cornerstone Management, Inc. | 7,110 | 15.27 | 526 | 22.90 | ||||
| 2025-07-31 | 13F | Glass Jacobson Investment Advisors llc | 12,202 | -2.22 | 903 | 5.37 | ||||
| 2025-07-29 | 13F | Tradewinds Capital Management, LLC | 312 | 0.32 | 23 | 9.52 | ||||
| 2025-08-06 | 13F | Commonwealth Equity Services, Llc | 595,860 | 1.09 | 44 | 10.00 | ||||
| 2025-08-11 | 13F | Principal Securities, Inc. | 3,272 | -17.48 | 242 | -11.03 | ||||
| 2025-08-01 | 13F | Rossby Financial, LCC | 301 | 0.00 | 22 | 10.00 | ||||
| 2025-08-04 | 13F | Keybank National Association/oh | 5,347 | 0.00 | 396 | 6.47 | ||||
| 2025-07-10 | 13F | Secure Asset Management, LLC | 0 | -100.00 | 0 |