Mga Batayang Estadistika
| Pemilik Institusional | 284 total, 284 long only, 0 short only, 0 long/short - change of 6.34% MRQ |
| Alokasi Portofolio Rata-rata | 0.4056 % - change of -10.63% MRQ |
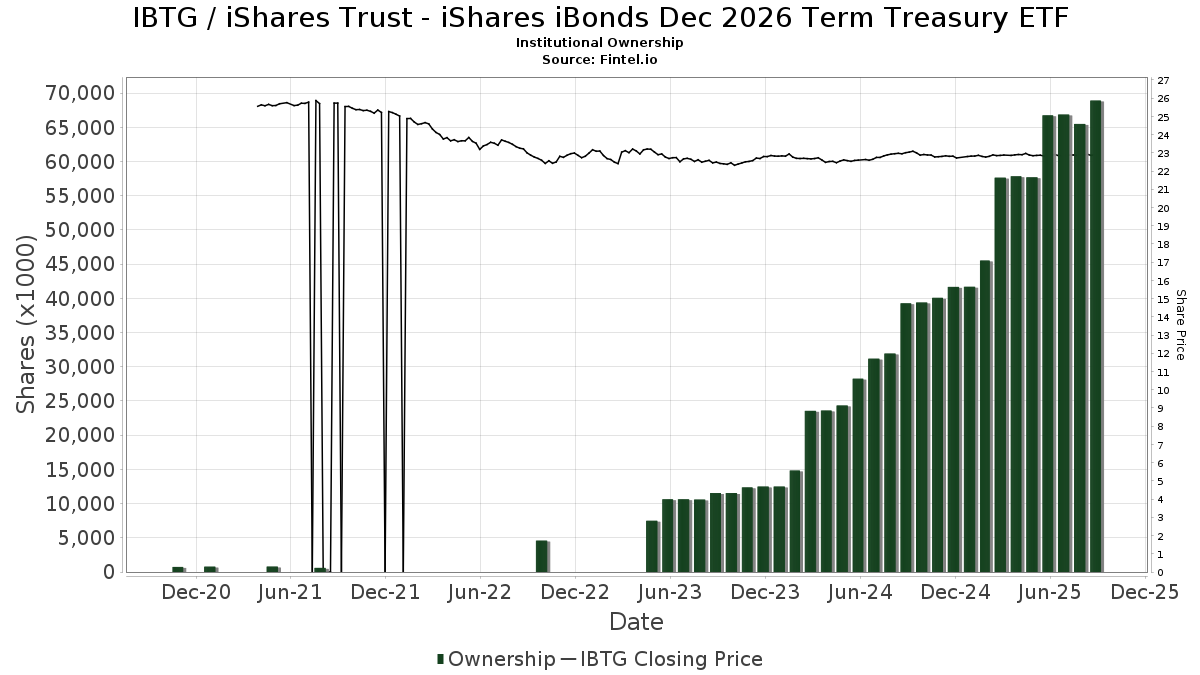
| Saham Institusional (Jangka Panjang) | 68,907,019 (ex 13D/G) - change of 2.16MM shares 3.23% MRQ |
| Nilai Institusional (Jangka Panjang) | $ 1,528,402 USD ($1000) |
Kepemilikan Institusional dan Pemegang Saham
iShares Trust - iShares iBonds Dec 2026 Term Treasury ETF (US:IBTG) memiliki 284 pemilik institusional dan pemegang saham yang telah mengajukan formulir 13D/G atau 13F kepada Komisi Bursa Efek (Securities Exchange Commission/SEC). Lembaga-lembaga ini memegang total 68,907,019 saham. Pemegang saham terbesar meliputi Kovitz Investment Group Partners, LLC, Hm Payson & Co, Morgan Stanley, Bank Of America Corp /de/, Colony Group, LLC, Wells Fargo & Company/mn, Capital Investment Advisors, LLC, GWM Advisors LLC, Raymond James Financial Inc, and UBS Group AG .
Struktur kepemilikan institusional iShares Trust - iShares iBonds Dec 2026 Term Treasury ETF (NasdaqGM:IBTG) menunjukkan posisi terkini di perusahaan oleh institusi dan dana, serta perubahan terbaru dalam ukuran posisi. Pemegang saham utama dapat mencakup investor individu, reksa dana, dana lindung nilai, atau institusi. Jadwal 13D menunjukkan bahwa investor memegang (atau pernah memegang) lebih dari 5% saham perusahaan dan bermaksud (atau pernah bermaksud) untuk secara aktif mengejar perubahan strategi bisnis. Jadwal 13G menunjukkan investasi pasif lebih dari 5%.
The share price as of September 12, 2025 is 22.92 / share. Previously, on September 16, 2024, the share price was 23.06 / share. This represents a decline of 0.63% over that period.
Skor Sentimen Dana
Skor Sentimen Dana (sebelumnya dikenal sebagai Skor Akumulasi Kepemilikan) menemukan saham-saham yang paling banyak dibeli oleh dana. Ini adalah hasil dari model kuantitatif multi-faktor yang canggih yang mengidentifikasi perusahaan dengan tingkat akumulasi institusional tertinggi. Model penilaian menggunakan kombinasi dari total peningkatan pemilik yang diungkapkan, perubahan dalam alokasi portofolio pada pemilik tersebut, dan metrik lainnya. Angka berkisar dari 0 hingga 100, dengan angka yang lebih tinggi menunjukkan tingkat akumulasi yang lebih tinggi dibandingkan dengan perusahaan sejenisnya, dan 50 adalah rata-ratanya.
Frekuensi Pembaruan: Setiap Hari
Lihat Ownership Explorer, yang menyediakan daftar perusahaan dengan peringkat tertinggi.
Rasio Put/Call Institusional
Selain melaporkan isu ekuitas dan utang standar, institusi dengan aset di bawah manajemen lebih dari 100 juta dolar AS juga harus mengungkapkan kepemilikan opsi put dan call mereka. Karena opsi put umumnya menunjukkan sentimen negatif, dan opsi call menunjukkan sentimen positif, kita dapat mengetahui sentimen institusional secara keseluruhan dengan memplot rasio put terhadap call. Grafik di sebelah kanan memplot rasio put/call historis untuk instrumen ini.
Menggunakan Rasio Put/Call sebagai indikator sentimen investor mengatasi salah satu kekurangan utama dari penggunaan total kepemilikan institusional, yaitu sejumlah besar aset yang dikelola diinvestasikan secara pasif untuk melacak indeks. Dana yang dikelola secara pasif biasanya tidak membeli opsi, sehingga indikator rasio put/call lebih akurat dalam melacak sentimen dana yang dikelola secara aktif.
Pengajuan 13F dan NPORT
Detail pada pengajuan 13F tersedia gratis. Detail pada pengajuan NP memerlukan keanggotaan premium. Baris berwarna hijau menunjukkan posisi baru. Baris berwarna merah menunjukkan posisi yang sudah ditutup. Klik tautan ini ikon untuk melihat riwayat transaksi selengkapnya.
Tingkatkan
untuk membuka data premium dan mengekspor ke Excel ![]() .
.
| Tanggal File | Sumber | Investor | Ketik | Presyo ng Avg (Silangan) |
Saham | Δ Saham (%) |
Dilaporkan Nilai ($1000) |
Nilai Δ (%) |
Alokasi Port (%) |
|
|---|---|---|---|---|---|---|---|---|---|---|
| 2025-07-11 | 13F | Compass Ion Advisors, LLC | 44,938 | 20.50 | 1,030 | 20.47 | ||||
| 2025-07-17 | 13F | Robbins Farley Llc | 1,368 | -3.25 | 31 | -3.12 | ||||
| 2025-07-29 | 13F | Stratos Wealth Partners, LTD. | 640,463 | -8.11 | 14,686 | -8.16 | ||||
| 2025-08-14 | 13F | Money Concepts Capital Corp | 25,471 | 100.05 | 584 | 100.00 | ||||
| 2025-07-14 | 13F | UMA Financial Services, Inc. | 16,715 | 0.00 | 383 | 0.00 | ||||
| 2025-08-11 | 13F | United Capital Financial Advisers, Llc | 674,775 | 89.25 | 15,473 | 89.17 | ||||
| 2025-08-14 | 13F | Mml Investors Services, Llc | 176,257 | 5.23 | 4 | 33.33 | ||||
| 2025-08-12 | 13F | PSI Advisors, LLC | 0 | -100.00 | 0 | |||||
| 2025-04-22 | 13F | Mendota Financial Group, LLC | 0 | -100.00 | 0 | |||||
| 2025-07-30 | 13F | Strategic Blueprint, LLC | 349,880 | 24.46 | 8,023 | 24.41 | ||||
| 2025-07-11 | 13F | Wolfstich Capital, LLC | 0 | -100.00 | 0 | -100.00 | ||||
| 2025-08-04 | 13F | 4J Wealth Management LLC | 12,185 | -8.11 | 279 | -8.22 | ||||
| 2025-08-07 | 13F | Hughes Financial Services, LLC | 98,370 | 3.37 | 2,249 | 3.31 | ||||
| 2025-08-06 | 13F | Commonwealth Equity Services, Llc | 497,407 | 4.48 | 11 | 10.00 | ||||
| 2025-08-14 | 13F | Wells Fargo & Company/mn | 2,889,591 | 4.72 | 66,258 | 4.67 | ||||
| 2025-07-16 | 13F | Old Port Advisors | 97,730 | -12.33 | 2,241 | -12.40 | ||||
| 2025-08-11 | 13F | HHM Wealth Advisors, LLC | 589 | 0.00 | 14 | 0.00 | ||||
| 2025-04-29 | 13F | Hm Payson & Co | 4,713,829 | 17.49 | 108,135 | 18.16 | ||||
| 2025-07-23 | 13F | Sunbeam Capital Management, LLC | 85,359 | 0.90 | 1,957 | 0.88 | ||||
| 2025-07-24 | 13F | True Link Financial Advisors, LLC | 91,181 | 2,091 | ||||||
| 2025-08-04 | 13F | Balentine LLC | 1,098 | 0.00 | 25 | 0.00 | ||||
| 2025-08-11 | 13F | Principal Securities, Inc. | 20,083 | 4.62 | 461 | 5.26 | ||||
| 2025-07-30 | 13F | Princeton Global Asset Management LLC | 3,500 | 0.00 | 80 | 0.00 | ||||
| 2025-07-17 | 13F | Stockman Wealth Management, Inc. | 149,045 | 5.55 | 3,418 | 5.50 | ||||
| 2025-07-23 | 13F | Spectrum Asset Management, Inc. (NB/CA) | 18,648 | 28.22 | 428 | 28.23 | ||||
| 2025-07-15 | 13F | BCS Wealth Management | 0 | -100.00 | 0 | |||||
| 2025-08-13 | 13F | SCS Capital Management LLC | 101,026 | 0.19 | 2,317 | 0.13 | ||||
| 2025-07-07 | 13F | Greenfield Savings Bank | 19,595 | -1.04 | 449 | -1.10 | ||||
| 2025-08-15 | 13F | Howland Capital Management Llc | 157,661 | 8.46 | 3,615 | 8.43 | ||||
| 2025-07-23 | 13F | Country Club Bank /gfn | 130,793 | -4.57 | 2,998 | -4.58 | ||||
| 2025-05-07 | 13F | Spectrum Wealth Counsel, LLC | 5,007 | 0.00 | 115 | 0.00 | ||||
| 2025-07-14 | 13F | Park Avenue Securities Llc | 98,676 | 5.41 | 2 | 0.00 | ||||
| 2025-08-14 | 13F | Essential Planning, LLC. | 61,646 | -14.86 | 1,414 | -14.93 | ||||
| 2025-08-14 | 13F | Susquehanna International Group, Llp | 16,922 | 388 | ||||||
| 2025-07-09 | 13F | Chesley Taft & Associates LLC | 18,600 | 0.00 | 426 | 0.00 | ||||
| 2025-08-14 | 13F | GWM Advisors LLC | 1,780,749 | -3.77 | 40,833 | -3.82 | ||||
| 2025-08-06 | 13F | AE Wealth Management LLC | 2,956 | 0.00 | 68 | 0.00 | ||||
| 2025-08-19 | 13F | Advisory Services Network, LLC | 9,160 | 210 | ||||||
| 2025-07-15 | 13F | Fifth Third Bancorp | 2,185 | 0.00 | 50 | 0.00 | ||||
| 2025-07-08 | 13F | Richard P Slaughter Associates Inc | 35,425 | 23.05 | 812 | 23.03 | ||||
| 2025-04-22 | 13F | Synergy Financial Management, LLC | 0 | -100.00 | 0 | |||||
| 2025-08-01 | 13F | Liberty Wealth Management Llc | 13,494 | 309 | ||||||
| 2025-08-15 | 13F | Captrust Financial Advisors | 174,584 | 5.06 | 4,003 | 5.01 | ||||
| 2025-04-11 | 13F | Safeguard Financial, LLC | 47,532 | 16.57 | 1,090 | 17.20 | ||||
| 2025-07-29 | 13F | Flavin Financial Services, Inc. | 173,485 | -2.19 | 3,978 | -2.21 | ||||
| 2025-05-14 | 13F | Vertex Planning Partners, LLC | 0 | -100.00 | 0 | |||||
| 2025-07-07 | 13F | Trust Co | 66,734 | -10.49 | 1,530 | -10.53 | ||||
| 2025-08-14 | 13F | Hara Capital LLC | 3,346 | 0.00 | 77 | 0.00 | ||||
| 2025-08-14 | 13F | CIBC World Markets Inc. | 28,655 | 0.00 | 657 | 0.00 | ||||
| 2025-08-11 | 13F | Atlantic Private Wealth, LLC | 194,920 | 50.60 | 4,470 | 50.52 | ||||
| 2025-05-15 | 13F | Wealth Management Strategies, Inc. | 392,562 | 11.56 | 9,005 | 11,156.25 | ||||
| 2025-07-23 | 13F | Valmark Advisers, Inc. | 138,197 | 8.10 | 3,169 | 8.05 | ||||
| 2025-08-13 | 13F | Hamel Associates, Inc. | 10,210 | 234 | ||||||
| 2025-08-14 | 13F | UBS Group AG | 1,513,861 | -4.13 | 34,713 | -4.17 | ||||
| 2025-07-16 | 13F | Littlejohn Financial Services, Inc. | 123,820 | 3.65 | 2,839 | 3.61 | ||||
| 2025-08-13 | 13F | Raab & Moskowitz Asset Management LLC | 9,488 | 218 | ||||||
| 2025-08-08 | 13F | Woodley Farra Manion Portfolio Management Inc | 11,175 | 256 | ||||||
| 2025-08-04 | 13F | Grant Street Asset Management, Inc. | 22,804 | 1.03 | 523 | 0.97 | ||||
| 2025-08-11 | 13F | TD Waterhouse Canada Inc. | 62,388 | 0.00 | 1,424 | -0.14 | ||||
| 2025-08-11 | 13F | Brown Brothers Harriman & Co | 800 | 0.00 | 18 | 0.00 | ||||
| 2025-08-12 | 13F | OneAscent Financial Services LLC | 490,666 | 113.04 | 11 | 120.00 | ||||
| 2025-08-13 | 13F | Flow Traders U.s. Llc | 15,664 | 0.51 | 0 | |||||
| 2025-08-13 | 13F | RFP Financial Group LLC | 28,632 | 11.28 | 657 | 11.19 | ||||
| 2025-07-30 | 13F | Granite Harbor Advisors, Inc. | 35,339 | 2.66 | 810 | 2.66 | ||||
| 2025-08-12 | 13F | BlackRock, Inc. | 185,129 | 20.68 | 4,245 | 20.63 | ||||
| 2025-08-11 | 13F | Summit Wealth Partners, LLC | 63,898 | 7.44 | 1,465 | 7.40 | ||||
| 2025-08-13 | 13F | Beacon Pointe Advisors, LLC | 26,849 | -2.90 | 616 | -3.00 | ||||
| 2025-07-30 | 13F | Bogart Wealth, LLC | 3,241 | 0.12 | 74 | 0.00 | ||||
| 2025-08-07 | 13F | Allworth Financial LP | 134,975 | 40.61 | 3,095 | 40.64 | ||||
| 2025-08-11 | 13F | Annis Gardner Whiting Capital Advisors, LLC | 890 | 20 | ||||||
| 2025-07-11 | 13F | Financial Advisory Corp | 1,420,533 | 0.86 | 32,573 | 0.82 | ||||
| 2025-08-12 | 13F | Reliant Wealth Planning | 57,728 | 4.36 | 1,324 | 4.34 | ||||
| 2025-07-16 | 13F | Kerntke Otto McGlone Wealth Management Group | 242,524 | -5.10 | 5,561 | -5.13 | ||||
| 2025-07-22 | 13F | Merit Financial Group, LLC | 44,010 | 1,009 | ||||||
| 2025-08-13 | 13F | Northwestern Mutual Wealth Management Co | 784,753 | 5.01 | 17,994 | 4.96 | ||||
| 2025-08-14 | 13F | Fmr Llc | 848 | 12.32 | 19 | 11.76 | ||||
| 2025-08-14 | 13F | Mariner, LLC | 204,722 | 12.31 | 4,694 | 12.27 | ||||
| 2025-05-08 | 13F | Shufro Rose & Co Llc | 0 | -100.00 | 0 | |||||
| 2025-08-14 | 13F | Raymond James Financial Inc | 1,778,324 | 48.11 | 40,777 | 48.05 | ||||
| 2025-08-14 | 13F | Mercer Global Advisors Inc /adv | 651,224 | 41.92 | 14,933 | 41.86 | ||||
| 2025-07-11 | 13F | SILVER OAK SECURITIES, Inc | 12,404 | 0.67 | 284 | 0.71 | ||||
| 2025-08-14 | 13F | Colony Group, LLC | 3,160,744 | 3.65 | 72,476 | 3.61 | ||||
| 2025-07-18 | 13F | Cooper Financial Group | 12,508 | 0.85 | 287 | 0.70 | ||||
| 2025-07-24 | 13F | Leo Wealth, LLC | 33,458 | -26.54 | 767 | -26.53 | ||||
| 2025-06-23 | NP | LDRT - iShares iBonds 1-5 Year Treasury Ladder ETF | 170,935 | 200.01 | 3,926 | 201.30 | ||||
| 2025-07-22 | 13F | Yoder Wealth Management, Inc. | 18,431 | 0.00 | 423 | 0.00 | ||||
| 2025-08-18 | 13F/A | Kestra Investment Management, LLC | 15,180 | -49.71 | 348 | -49.71 | ||||
| 2025-08-13 | 13F | Capital Analysts, Inc. | 2,004 | 0.00 | 0 | |||||
| 2025-08-12 | 13F | Change Path, LLC | 53,680 | 33.60 | 1,231 | 33.55 | ||||
| 2025-08-14 | 13F | Integrated Wealth Concepts LLC | 1,344,636 | 7.73 | 30,832 | 7.68 | ||||
| 2025-08-01 | 13F | Envestnet Asset Management Inc | 1,128,586 | 28.49 | 25,878 | 28.43 | ||||
| 2025-07-31 | 13F | Keeler THomas Management LLC | 81,332 | -27.58 | 1,865 | -27.64 | ||||
| 2025-07-18 | 13F | Foundry Financial Group, Inc. | 54,175 | -12.29 | 1,242 | -12.29 | ||||
| 2025-08-12 | 13F | Titleist Asset Management, Llc | 300,277 | 6.58 | 6,885 | 6.55 | ||||
| 2025-08-11 | 13F | Pineridge Advisors LLC | 9,210 | 1.03 | 211 | 0.96 | ||||
| 2025-07-15 | 13F | Focused Wealth Management, Inc | 19,047 | 3.79 | 437 | 3.81 | ||||
| 2025-08-12 | 13F | MAI Capital Management | 165,330 | 0.53 | 3,791 | 0.50 | ||||
| 2025-07-16 | 13F | Novem Group | 34,838 | 6.40 | 799 | 6.26 | ||||
| 2025-08-15 | 13F | CI Private Wealth, LLC | 8,871 | -44.02 | 203 | -44.08 | ||||
| 2025-08-05 | 13F | Hills Bank & Trust Co | 12,633 | 3.58 | 290 | 3.58 | ||||
| 2025-09-04 | 13F/A | Advisor Group Holdings, Inc. | 672,561 | -5.57 | 15,426 | -5.61 | ||||
| 2025-05-14 | 13F | Van Hulzen Asset Management, LLC | 0 | -100.00 | 0 | |||||
| 2025-05-15 | 13F/A | Orion Portfolio Solutions, LLC | 67,172 | -53.11 | 1,541 | -53.22 | ||||
| 2025-08-13 | 13F | Cerity Partners LLC | 20,278 | -0.36 | 465 | -0.43 | ||||
| 2025-08-13 | 13F | Boston Family Office Llc | 226,379 | 12.69 | 5 | 25.00 | ||||
| 2025-08-06 | 13F | Prospera Financial Services Inc | 196,416 | 72.11 | 4,504 | 72.07 | ||||
| 2025-07-07 | 13F | Horizons Wealth Management | 46,552 | -0.10 | 1,067 | -0.09 | ||||
| 2025-08-12 | 13F | Steward Partners Investment Advisory, Llc | 278,439 | -29.88 | 6,385 | -29.92 | ||||
| 2025-08-14 | 13F | Stifel Financial Corp | 443,443 | -5.88 | 10,168 | -5.91 | ||||
| 2025-08-26 | 13F/A | Thrivent Financial For Lutherans | 17,901 | -87.01 | 0 | -100.00 | ||||
| 2025-07-30 | 13F/A | Old Point Trust & Financial Services N A | 15,000 | 0.00 | 344 | -0.29 | ||||
| 2025-07-23 | 13F | Prime Capital Investment Advisors, LLC | 10,100 | 232 | ||||||
| 2025-08-19 | 13F | Asset Dedication, LLC | 30,938 | 11.00 | 709 | 10.95 | ||||
| 2025-08-05 | 13F | Fullcircle Wealth Llc | 58,474 | -1.13 | 1,337 | -1.55 | ||||
| 2025-07-10 | 13F | Oliver Lagore Vanvalin Investment Group | 1,973 | 0.15 | 45 | 2.27 | ||||
| 2025-07-01 | 13F | Harbor Investment Advisory, Llc | 1,200 | 0.00 | 28 | 0.00 | ||||
| 2025-08-12 | 13F | Eldridge Investment Advisors, Inc. | 194,779 | 1.32 | 4,451 | 0.93 | ||||
| 2025-08-14 | 13F | Vista Private Wealth Partners. LLC | 780,842 | 15.04 | 17,905 | 14.99 | ||||
| 2025-07-16 | 13F | MKT Advisors LLC | 550,370 | 3.15 | 12,570 | 2.92 | ||||
| 2025-08-08 | 13F | Cetera Investment Advisers | 135,115 | 1.57 | 3,098 | 1.54 | ||||
| 2025-08-12 | 13F | LPL Financial LLC | 1,205,892 | 11.20 | 27,651 | 11.16 | ||||
| 2025-07-24 | 13F/A | TFR Capital, LLC. | 84,346 | 24.22 | 1,934 | 24.21 | ||||
| 2025-07-25 | 13F | Heartland Bank & Trust Co | 18,650 | 8.22 | 428 | 8.10 | ||||
| 2025-08-13 | 13F | Baird Financial Group, Inc. | 367,389 | 18.60 | 8,424 | 18.56 | ||||
| 2025-04-28 | 13F | Strategic Financial Concepts, LLC | 0 | -100.00 | 0 | -100.00 | ||||
| 2025-07-25 | 13F | Atria Wealth Solutions, Inc. | 179,051 | -6.50 | 4,106 | -6.53 | ||||
| 2025-08-08 | 13F | Creative Planning | 88,250 | 1.47 | 2,024 | 1.40 | ||||
| 2025-08-06 | 13F | Black Swift Group, LLC | 103,300 | -1.10 | 2,369 | -1.17 | ||||
| 2025-07-29 | 13F | Koshinski Asset Management, Inc. | 16,432 | 377 | ||||||
| 2025-07-14 | 13F | Conrad Siegel Investment Advisors, Inc. | 21,160 | -40.42 | 485 | -40.42 | ||||
| 2025-07-25 | 13F | Hemington Wealth Management | 1,214 | 0.00 | 0 | |||||
| 2025-08-05 | 13F | Gould Asset Management Llc /ca/ | 90,433 | 5.19 | 2,074 | 5.12 | ||||
| 2025-08-01 | 13F | Koss-Olinger Consulting, LLC | 24,382 | 1.39 | 559 | 1.27 | ||||
| 2025-08-11 | 13F | HighTower Advisors, LLC | 372,840 | -0.37 | 8,549 | -0.42 | ||||
| 2025-04-17 | 13F | Montecito Bank & Trust | 49,748 | 6.42 | 1,141 | 7.04 | ||||
| 2025-08-13 | 13F | Jones Financial Companies Lllp | 0 | -100.00 | 0 | |||||
| 2025-07-23 | 13F | Element Wealth, LLC | 38,488 | 12.48 | 883 | 12.50 | ||||
| 2025-08-15 | 13F | Morgan Stanley | 3,805,089 | -3.33 | 87,251 | -3.38 | ||||
| 2025-08-05 | 13F | Bank Of Montreal /can/ | 3,548 | 78.92 | 81 | 80.00 | ||||
| 2025-07-17 | 13F | Janney Montgomery Scott LLC | 302,181 | 16.00 | 7 | 20.00 | ||||
| 2025-07-25 | 13F | NorthRock Partners, LLC | 1,500 | -64.29 | 34 | -64.58 | ||||
| 2025-08-04 | 13F | Savvy Advisors, Inc. | 27,057 | 3.42 | 620 | 3.33 | ||||
| 2025-07-24 | 13F | Eastern Bank | 1,990 | -53.96 | 46 | -54.55 | ||||
| 2025-07-31 | 13F | Cambridge Investment Research Advisors, Inc. | 100,762 | -0.70 | 2 | 0.00 | ||||
| 2025-08-11 | 13F | Wealthspire Advisors, LLC | 135,573 | -0.93 | 3,109 | -0.99 | ||||
| 2025-07-21 | 13F | Mattern Capital Management, Llc | 12,606 | 0.00 | 289 | 0.00 | ||||
| 2025-08-04 | 13F | Mesirow Financial Investment Management, Inc. | 299,583 | -0.22 | 6,869 | -0.26 | ||||
| 2025-08-18 | 13F/A | National Bank Of Canada /fi/ | 7,759 | 1.96 | 178 | 1.72 | ||||
| 2025-08-05 | 13F | Huntington National Bank | 384 | 0.00 | ||||||
| 2025-07-18 | 13F | McGuire Investment Group, LLC | 318,186 | 7,296 | ||||||
| 2025-08-14 | 13F | IHT Wealth Management, LLC | 8,816 | 202 | ||||||
| 2025-08-14 | 13F | Citadel Advisors Llc | 10,683 | -81.42 | 245 | -81.50 | ||||
| 2025-05-15 | 13F | Wick Capital Partners, LLC | 0 | -100.00 | 0 | |||||
| 2025-07-08 | 13F | Apella Capital, LLC | 424,481 | 15.34 | 9,695 | 15.09 | ||||
| 2025-08-08 | 13F | Summitry Llc | 1,455,550 | 4.01 | 33,376 | 3.97 | ||||
| 2025-08-12 | 13F | Laurel Wealth Advisors LLC | 142,166 | 2,193.00 | 6 | -95.77 | ||||
| 2025-08-14 | 13F | Financial Engines Advisors L.L.C. | 340,662 | -11.00 | 7,811 | -11.04 | ||||
| 2025-08-13 | 13F | Lido Advisors, LLC | 241,829 | -4.30 | 5,545 | -4.35 | ||||
| 2025-08-06 | 13F | Savant Capital, LLC | 15,021 | 344 | ||||||
| 2025-08-08 | 13F | Bailard, Inc. | 125,079 | -81.04 | 2,868 | -81.05 | ||||
| 2025-08-06 | 13F | Modera Wealth Management, LLC | 28,447 | 0.00 | 652 | 0.00 | ||||
| 2025-07-24 | 13F | Moseley Investment Management Inc | 211,555 | 370.12 | 4,851 | 369.96 | ||||
| 2025-08-04 | 13F | Jim Saulnier & Associates, Llc | 45,039 | 7.39 | 1,033 | 7.28 | ||||
| 2025-08-14 | 13F | Visionary Wealth Advisors | 12,069 | 277 | ||||||
| 2025-07-15 | 13F | Unified Investment Management | 8,763 | 0.00 | 201 | -0.50 | ||||
| 2025-08-12 | 13F | Nemes Rush Group LLC | 58 | 1.75 | 1 | 0.00 | ||||
| 2025-08-14 | 13F | Eight 31 Financial Llc | 267,196 | 2.47 | 6,127 | 2.41 | ||||
| 2025-07-24 | 13F | Us Bancorp \de\ | 500 | 0.00 | 11 | 0.00 | ||||
| 2025-07-25 | 13F | Apollon Wealth Management, LLC | 987,956 | 1.76 | 22,654 | 1.72 | ||||
| 2025-07-15 | 13F | Highland Financial Advisors, LLC | 11,027 | 0.00 | 253 | 0.00 | ||||
| 2025-08-11 | 13F | Regal Investment Advisors LLC | 26,385 | -12.38 | 605 | -12.32 | ||||
| 2025-08-11 | 13F | Aptus Capital Advisors, LLC | 7,133 | 5,144.85 | 164 | 5,333.33 | ||||
| 2025-07-11 | 13F | Farther Finance Advisors, LLC | 1,150 | -89.55 | 26 | -89.64 | ||||
| 2025-07-08 | 13F | Gradient Investments LLC | 200,526 | 3.76 | 4,598 | 3.72 | ||||
| 2025-07-31 | 13F | Carnegie Capital Asset Management, LLC | 734,491 | 9.13 | 16,842 | 9.32 | ||||
| 2025-04-01 | 13F | Cornerstone Planning, LLC | 125,821 | 2,870 | ||||||
| 2025-07-11 | 13F | Pinnacle Bancorp, Inc. | 25,396 | 0.00 | 582 | 0.00 | ||||
| 2025-07-14 | 13F | AdvisorNet Financial, Inc | 794 | -83.19 | 18 | -83.33 | ||||
| 2025-07-11 | 13F | First PREMIER Bank | 729 | -3.95 | 0 | |||||
| 2025-08-08 | 13F | Thoroughbred Financial Services, Llc | 73,042 | -10.03 | 2 | 0.00 | ||||
| 2025-08-11 | 13F | FSA Wealth Management LLC | 89 | 2 | ||||||
| 2025-07-29 | 13F | Stratos Wealth Advisors, LLC | 507,700 | 853.75 | 11,642 | 853.40 | ||||
| 2025-08-05 | 13F | Fourth Dimension Wealth, LLC | 41,276 | 340.42 | 946 | 342.06 | ||||
| 2025-07-09 | 13F | Byrne Asset Management LLC | 0 | -100.00 | 0 | |||||
| 2025-07-18 | 13F | Precision Wealth Strategies, LLC | 10,063 | 231 | ||||||
| 2025-07-08 | 13F | Lowe Wealth Advisors, LLC | 1,200 | 0.00 | 28 | 0.00 | ||||
| 2025-07-30 | 13F | Drive Wealth Management, Llc | 79,505 | -1.43 | 1,823 | -1.46 | ||||
| 2025-08-12 | 13F | Associated Banc-corp | 82,291 | 8.47 | 1,887 | 8.39 | ||||
| 2025-07-22 | 13F | Mascoma Wealth Management LLC | 9,988 | 0.00 | 229 | 0.00 | ||||
| 2025-07-22 | 13F | Berger Financial Group, Inc | 16,292 | -4.62 | 374 | -4.60 | ||||
| 2025-08-06 | 13F | Cannon Financial Strategists, Inc. | 61,519 | 0.99 | 1,411 | 0.93 | ||||
| 2025-08-07 | 13F | Sound View Wealth Advisors Group, LLC | 241,272 | 5,532 | ||||||
| 2025-08-14 | 13F | Comerica Bank | 12,202 | -40.30 | 280 | -40.38 | ||||
| 2025-08-27 | 13F/A | Brinker Capital Investments, LLC | 65,467 | -2.54 | 1,501 | -2.53 | ||||
| 2025-08-04 | 13F | Pensionmark Financial Group, Llc | 15,606 | 0.13 | 358 | 0.00 | ||||
| 2025-08-12 | 13F | Proequities, Inc. | 0 | 0 | ||||||
| 2025-08-14 | 13F | Ameriprise Financial Inc | 210,134 | -24.64 | 4,818 | -24.70 | ||||
| 2025-08-13 | 13F | MONECO Advisors, LLC | 12,588 | 0.00 | 289 | 0.00 | ||||
| 2025-07-15 | 13F | Beacon Financial Planning, Inc | 16,075 | 0.65 | 369 | 0.55 | ||||
| 2025-07-17 | 13F/A | Capital Investment Advisors, LLC | 2,336,393 | -0.62 | 53,573 | -0.66 | ||||
| 2025-08-07 | 13F | Kestra Private Wealth Services, Llc | 41,676 | -7.75 | 956 | -7.82 | ||||
| 2025-07-23 | 13F | Madden Advisory Services, Inc. | 24,392 | 4.93 | 559 | 4.88 | ||||
| 2025-08-14 | 13F | Connecticut Wealth Management, LLC | 835,276 | 104.64 | 19,153 | 104.55 | ||||
| 2025-07-18 | 13F | Centricity Wealth Management, LLC | 2,800 | 0.00 | 64 | 0.00 | ||||
| 2025-07-28 | 13F | Harbour Investments, Inc. | 18,809 | 8.94 | 431 | 8.84 | ||||
| 2025-08-08 | 13F | WASHINGTON TRUST Co | 0 | -100.00 | 0 | |||||
| 2025-07-11 | 13F | Trinity Wealth Management, LLC | 31,880 | 8.77 | 731 | 8.78 | ||||
| 2025-08-05 | 13F | Cherry Tree Wealth Management, LLC | 7,062 | 8.05 | 162 | 8.05 | ||||
| 2025-08-13 | 13F | Baltimore-Washington Financial Advisors, Inc. | 435,120 | -9.84 | 9,977 | -9.88 | ||||
| 2025-08-11 | 13F | Avantax Planning Partners, Inc. | 57,909 | -3.37 | 1,328 | -3.42 | ||||
| 2025-07-28 | 13F | BRYN MAWR TRUST Co | 2,500 | -50.00 | 57 | -50.00 | ||||
| 2025-08-14 | 13F | STAR Financial Bank | 90,746 | 9.70 | 2,081 | 9.65 | ||||
| 2025-07-08 | 13F | Legacy Private Trust Co. | 9,778 | 224 | ||||||
| 2025-08-07 | 13F | CENTRAL TRUST Co | 297,191 | 7.91 | 6,815 | 7.87 | ||||
| 2025-08-14 | 13F | Hrt Financial Lp | 0 | -100.00 | 0 | |||||
| 2025-07-18 | 13F | Northstar Group, Inc. | 83,796 | 21.39 | 1,921 | 21.35 | ||||
| 2025-07-31 | 13F | Blake Schutter Theil Wealth Advisors, LLC | 13,915 | 0.00 | 319 | 0.00 | ||||
| 2025-07-29 | 13F | International Assets Investment Management, Llc | 63,280 | 0.00 | 1,451 | 0.00 | ||||
| 2025-08-07 | 13F | Parkside Financial Bank & Trust | 1,354 | 21.76 | 31 | 24.00 | ||||
| 2025-08-11 | 13F | Dorsey & Whitney Trust CO LLC | 14,255 | -14.28 | 327 | -14.44 | ||||
| 2025-07-18 | 13F | Pure Financial Advisors, Inc. | 24,669 | 566 | ||||||
| 2025-07-21 | 13F | Barrett & Company, Inc. | 42,625 | 0.01 | 977 | 0.00 | ||||
| 2025-07-22 | 13F | Belpointe Asset Management LLC | 144,397 | 430.25 | 3,311 | 430.61 | ||||
| 2025-07-24 | 13F | IFP Advisors, Inc | 142,224 | -1.25 | 3,261 | -1.30 | ||||
| 2025-08-01 | 13F | Schmidt P J Investment Management Inc | 10,877 | 0.22 | 249 | 0.40 | ||||
| 2025-08-11 | 13F | CFS Investment Advisory Services, LLC | 17,536 | -0.14 | 0 | |||||
| 2025-08-13 | 13F | Portland Global Advisors LLC | 110,055 | 8.66 | 2,524 | 8.61 | ||||
| 2025-07-23 | 13F | High Note Wealth, LLC | 24,334 | 558 | ||||||
| 2025-07-15 | 13F | RVW Wealth, LLC | 22,257 | 0.76 | 510 | 0.79 | ||||
| 2025-07-09 | 13F | Krilogy Financial LLC | 667,853 | 2.98 | 15,314 | 2.93 | ||||
| 2025-07-29 | 13F | Straight Path Wealth Management | 24,674 | 1.94 | 566 | 1.80 | ||||
| 2025-08-13 | 13F | Cary Street Partners Financial Llc | 28,712 | 6.49 | 658 | 6.47 | ||||
| 2025-07-28 | 13F | Duncker Streett & Co Inc | 25,786 | 0.00 | 591 | 0.00 | ||||
| 2025-08-04 | 13F | Atria Investments Llc | 102,247 | 3.52 | 2,345 | 3.49 | ||||
| 2025-08-15 | 13F | Equitable Holdings, Inc. | 50,853 | -12.11 | 1,166 | -12.13 | ||||
| 2025-08-11 | 13F | Private Advisor Group, LLC | 168,532 | 503.49 | 3,864 | 503.75 | ||||
| 2025-07-22 | 13F | Penobscot Investment Management Company, Inc. | 16,000 | 367 | ||||||
| 2025-07-24 | 13F | Stonebridge Financial Group, LLC | 389,673 | 2.88 | 8,935 | 2.83 | ||||
| 2025-07-30 | 13F | Phillips Financial Management, Llc | 48,994 | -12.17 | 1,123 | -12.20 | ||||
| 2025-08-01 | 13F | Austin Private Wealth, LLC | 65,507 | 13.50 | 1,502 | 13.53 | ||||
| 2025-08-13 | 13F | Black Cypress Capital Management, LLC | 3,018 | 175.87 | 69 | 176.00 | ||||
| 2025-07-21 | 13F | Cliftonlarsonallen Wealth Advisors, Llc | 747,142 | 11.49 | 17,132 | 11.44 | ||||
| 2025-07-29 | 13F | Private Trust Co Na | 3,293 | 0.00 | 76 | 0.00 | ||||
| 2025-07-31 | 13F | Washington Trust Advisors, Inc. | 22,377 | 0.30 | 513 | 0.39 | ||||
| 2025-08-08 | 13F | TD Capital Management LLC | 2,034 | 0.99 | 47 | 0.00 | ||||
| 2025-05-09 | 13F | CoreCap Advisors, LLC | 0 | -100.00 | 0 | |||||
| 2025-07-23 | 13F | Evexia Wealth Llc | 14,431 | -43.96 | 330 | -44.14 | ||||
| 2025-07-14 | 13F | Kfg Wealth Management, Llc | 24,756 | 5.23 | 568 | 5.19 | ||||
| 2025-07-29 | 13F | Accretive Wealth Partners, LLC | 140,504 | 7.00 | 3,222 | 7.22 | ||||
| 2025-08-14 | 13F | Jane Street Group, Llc | 0 | -100.00 | 0 | |||||
| 2025-04-08 | 13F | Parallel Advisors, LLC | 0 | -100.00 | 0 | |||||
| 2025-08-08 | 13F | Pnc Financial Services Group, Inc. | 21,193 | 0.00 | 486 | -0.21 | ||||
| 2025-07-22 | 13F | Autumn Glory Partners, LLC | 12,109 | -2.20 | 278 | -2.46 | ||||
| 2025-08-14 | 13F | Kovitz Investment Group Partners, LLC | 5,260,457 | 14.82 | 120,622 | 14.77 | ||||
| 2025-07-21 | 13F | Crews Bank & Trust | 20,050 | 8.82 | 460 | 8.77 | ||||
| 2025-07-31 | 13F | Leavell Investment Management, Inc. | 224,028 | -7.47 | 5,137 | -7.51 | ||||
| 2025-08-12 | 13F | CIBC Private Wealth Group, LLC | 14,700 | 0.00 | 337 | 0.30 | ||||
| 2025-08-14 | 13F | Goldman Sachs Group Inc | 12,597 | -10.24 | 289 | -10.28 | ||||
| 2025-08-11 | 13F | Midwest Professional Planners, LTD. | 262,423 | 20.03 | 6,017 | 19.98 | ||||
| 2025-08-12 | 13F | Global Retirement Partners, LLC | 310,291 | 85.43 | 7,115 | 86.43 | ||||
| 2025-08-14 | 13F | Royal Bank Of Canada | 482,832 | 0.80 | 11,072 | 0.77 | ||||
| 2025-08-07 | 13F | Montag A & Associates Inc | 68,965 | -15.43 | 1,581 | -15.45 | ||||
| 2025-08-14 | 13F | Bank Of America Corp /de/ | 3,643,624 | 12.28 | 83,548 | 12.23 | ||||
| 2025-07-16 | 13F | Rebalance, Llc | 168,144 | 141.36 | 3,856 | 141.24 | ||||
| 2025-07-21 | 13F | Asset Advisors Investment Management, LLC | 346,169 | 16.42 | 7,938 | 16.36 | ||||
| 2025-08-07 | 13F | Rossmore Private Capital | 8,772 | 0.00 | 201 | 0.00 | ||||
| 2025-08-05 | 13F | Sigma Planning Corp | 48,542 | -1.59 | 1,113 | -1.59 | ||||
| 2025-07-24 | 13F | Riverchase Wealth Management, Llc | 47,261 | 3.54 | 1,084 | 3.44 | ||||
| 2025-07-30 | 13F | Brookstone Capital Management | 67,021 | 6.77 | 1,537 | 6.74 | ||||
| 2025-07-25 | 13F | Stephens Consulting, LLC | 406,623 | 1.11 | 9,324 | 1.06 | ||||
| 2025-08-01 | 13F | James Investment Research Inc | 12,500 | 0.00 | 287 | 0.00 | ||||
| 2025-07-29 | 13F | Regions Financial Corp | 56,664 | 3.49 | 1,299 | 3.42 | ||||
| 2025-08-12 | 13F | Tableaux Llc | 0 | -100.00 | 0 | |||||
| 2025-07-10 | 13F | Klaas Financial Asset Advisors, LLC | 68,621 | -7.18 | 1,573 | -7.20 | ||||
| 2025-07-30 | 13F | DecisionMap Wealth Management, LLC | 8,890 | 204 | ||||||
| 2025-07-11 | 13F | Lantz Financial LLC | 123,672 | 8.37 | 2,836 | 8.33 | ||||
| 2025-07-30 | 13F | Avidian Wealth Solutions, LLC | 10,708 | 246 | ||||||
| 2025-08-12 | 13F | Jpmorgan Chase & Co | 1,292 | -22.12 | 30 | -23.68 | ||||
| 2025-07-24 | 13F | Lokken Investment Group LLC | 9,109 | 209 | ||||||
| 2025-08-01 | 13F | Bank of Jackson Hole Trust | 3,201 | 0.00 | 73 | 0.00 | ||||
| 2025-07-30 | 13F | D.a. Davidson & Co. | 202,673 | -20.05 | 4,647 | -20.09 | ||||
| 2025-07-10 | 13F | Wealth Enhancement Advisory Services, Llc | 176,754 | 13.38 | 4,037 | 12.89 | ||||
| 2025-07-16 | 13F | Signaturefd, Llc | 150,437 | 66.04 | 3,450 | 65.98 | ||||
| 2025-08-08 | 13F | Mv Capital Management, Inc. | 590,467 | -1.35 | 13,539 | -1.39 | ||||
| 2025-07-30 | 13F | Probity Advisors, Inc. | 160,455 | 4.66 | 3,679 | 4.64 | ||||
| 2025-08-15 | 13F | Kestra Advisory Services, LLC | 77,739 | -21.57 | 1,783 | -21.60 | ||||
| 2025-07-24 | 13F | Costello Asset Management, INC | 8,097 | 586.77 | 186 | 585.19 | ||||
| 2025-08-15 | 13F | Scissortail Wealth Management, LLC | 493,150 | 1.89 | 11,308 | 1.85 | ||||
| 2025-08-13 | 13F | Willis Johnson & Associates, Inc. | 10,374 | 13.01 | 238 | 12.86 | ||||
| 2025-08-01 | 13F | Signature Wealth Management Group | 26,797 | -1.29 | 614 | -1.29 | ||||
| 2025-08-11 | 13F | Mill Creek Capital Advisors, LLC | 45,880 | 0.00 | 1,052 | 0.00 | ||||
| 2025-07-25 | 13F | Cwm, Llc | 81,885 | 11.68 | 2 | 0.00 | ||||
| 2025-08-12 | 13F | Coldstream Capital Management Inc | 24,994 | 0.00 | 573 | 0.00 | ||||
| 2025-08-01 | 13F | Transcend Wealth Collective, Llc | 16,501 | 0.00 | 378 | 0.00 | ||||
| 2025-07-09 | 13F | Lbmc Investment Advisors, Llc | 9,070 | 208 | ||||||
| 2025-08-04 | 13F | IFG Advisory, LLC | 11,213 | 0.61 | 257 | 0.78 | ||||
| 2025-08-14 | 13F | AllSquare Wealth Management LLC | 6,904 | 0.00 | 158 | 0.00 | ||||
| 2025-08-11 | 13F | Independent Advisor Alliance | 12,289 | 16.40 | 282 | 16.12 | ||||
| 2025-08-14 | 13F | Modern Wealth Management, LLC | 14,638 | 336 | ||||||
| 2025-07-29 | 13F | Mattson Financial Services, LLC | 0 | -100.00 | 0 | -100.00 | ||||
| 2025-07-31 | 13F | United Community Bank | 11,170 | 0.00 | 256 | 0.00 | ||||
| 2025-08-14 | 13F | Snowden Capital Advisors LLC | 26,686 | 0.00 | 612 | -0.16 | ||||
| 2025-07-31 | 13F | Oppenheimer & Co Inc | 45,174 | 0.35 | 1,036 | 0.29 | ||||
| 2025-05-12 | 13F | Kohmann Bosshard Financial Services, LLC | 0 | -100.00 | 0 | |||||
| 2025-07-11 | 13F | Shelton Wealth Management, Llc | 329,329 | 5.22 | 7,552 | 5.17 | ||||
| 2025-08-14 | 13F | Mairs & Power Inc | 14,255 | 327 |