Mga Batayang Estadistika
| Pemilik Institusional | 305 total, 305 long only, 0 short only, 0 long/short - change of -2.86% MRQ |
| Alokasi Portofolio Rata-rata | 0.3104 % - change of -11.93% MRQ |
| Saham Institusional (Jangka Panjang) | 67,042,069 (ex 13D/G) - change of -8.86MM shares -11.67% MRQ |
| Nilai Institusional (Jangka Panjang) | $ 711,177 USD ($1000) |
Kepemilikan Institusional dan Pemegang Saham
Nuveen Quality Municipal Income Fund (US:NAD) memiliki 305 pemilik institusional dan pemegang saham yang telah mengajukan formulir 13D/G atau 13F kepada Komisi Bursa Efek (Securities Exchange Commission/SEC). Lembaga-lembaga ini memegang total 67,042,069 saham. Pemegang saham terbesar meliputi Morgan Stanley, Rivernorth Capital Management, Llc, UBS Group AG, Bramshill Investments, LLC, Bank Of America Corp /de/, Wells Fargo & Company/mn, Mackay Shields Llc, Raymond James Financial Inc, RiverNorth Flexible Municipal Income Fund II, Inc., and Guggenheim Capital Llc .
Struktur kepemilikan institusional Nuveen Quality Municipal Income Fund (NYSE:NAD) menunjukkan posisi terkini di perusahaan oleh institusi dan dana, serta perubahan terbaru dalam ukuran posisi. Pemegang saham utama dapat mencakup investor individu, reksa dana, dana lindung nilai, atau institusi. Jadwal 13D menunjukkan bahwa investor memegang (atau pernah memegang) lebih dari 5% saham perusahaan dan bermaksud (atau pernah bermaksud) untuk secara aktif mengejar perubahan strategi bisnis. Jadwal 13G menunjukkan investasi pasif lebih dari 5%.
The share price as of September 5, 2025 is 11.49 / share. Previously, on September 6, 2024, the share price was 12.11 / share. This represents a decline of 5.12% over that period.

Skor Sentimen Dana
Skor Sentimen Dana (sebelumnya dikenal sebagai Skor Akumulasi Kepemilikan) menemukan saham-saham yang paling banyak dibeli oleh dana. Ini adalah hasil dari model kuantitatif multi-faktor yang canggih yang mengidentifikasi perusahaan dengan tingkat akumulasi institusional tertinggi. Model penilaian menggunakan kombinasi dari total peningkatan pemilik yang diungkapkan, perubahan dalam alokasi portofolio pada pemilik tersebut, dan metrik lainnya. Angka berkisar dari 0 hingga 100, dengan angka yang lebih tinggi menunjukkan tingkat akumulasi yang lebih tinggi dibandingkan dengan perusahaan sejenisnya, dan 50 adalah rata-ratanya.
Frekuensi Pembaruan: Setiap Hari
Lihat Ownership Explorer, yang menyediakan daftar perusahaan dengan peringkat tertinggi.
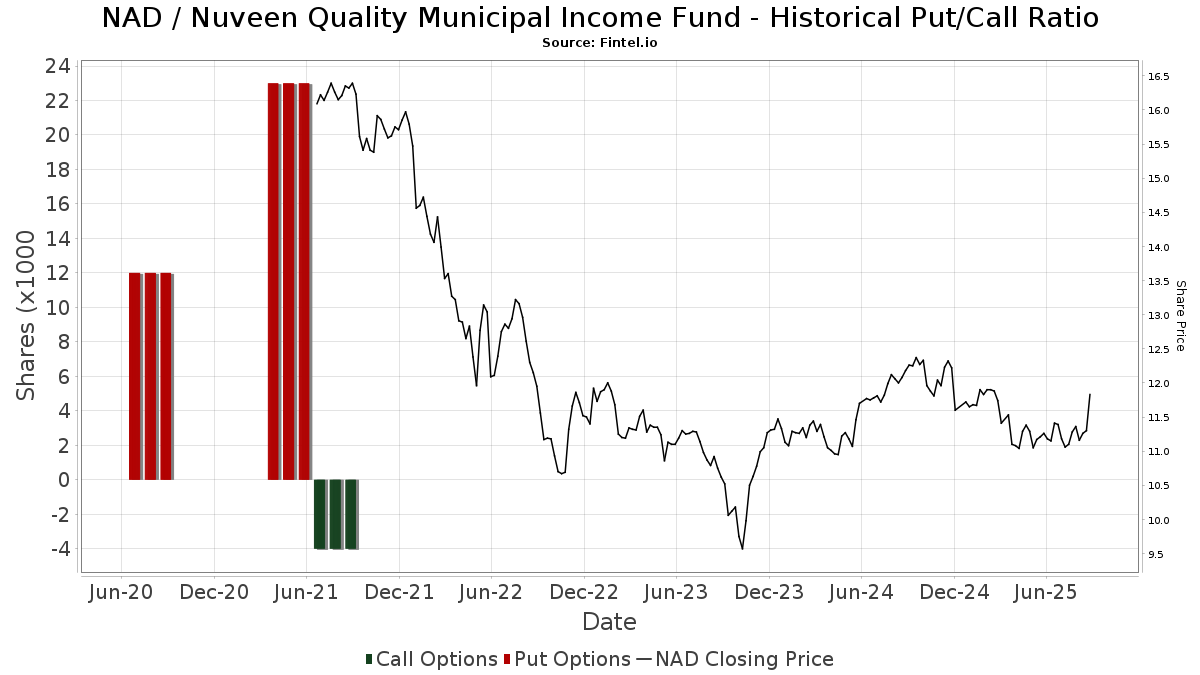
Rasio Put/Call Institusional
Selain melaporkan isu ekuitas dan utang standar, institusi dengan aset di bawah manajemen lebih dari 100 juta dolar AS juga harus mengungkapkan kepemilikan opsi put dan call mereka. Karena opsi put umumnya menunjukkan sentimen negatif, dan opsi call menunjukkan sentimen positif, kita dapat mengetahui sentimen institusional secara keseluruhan dengan memplot rasio put terhadap call. Grafik di sebelah kanan memplot rasio put/call historis untuk instrumen ini.
Menggunakan Rasio Put/Call sebagai indikator sentimen investor mengatasi salah satu kekurangan utama dari penggunaan total kepemilikan institusional, yaitu sejumlah besar aset yang dikelola diinvestasikan secara pasif untuk melacak indeks. Dana yang dikelola secara pasif biasanya tidak membeli opsi, sehingga indikator rasio put/call lebih akurat dalam melacak sentimen dana yang dikelola secara aktif.
Pengajuan 13D/G
Kami menyajikan pengajuan 13D/G secara terpisah dari pengajuan 13F karena perlakuan yang berbeda oleh SEC. Pengajuan 13D/G dapat diajukan oleh kelompok investor (dengan satu pemimpin), sedangkan pengajuan 13F tidak bisa. Hal ini mengakibatkan situasi di mana seorang investor dapat mengajukan 13D/G yang melaporkan satu nilai untuk total saham (mewakili semua saham yang dimiliki oleh kelompok investor), tetapi kemudian mengajukan 13F yang melaporkan nilai yang berbeda untuk total saham (mewakili kepemilikan mereka sendiri). Ini berarti bahwa kepemilikan saham dari pengajuan 13D/G dan pengajuan 13F seringkali tidak dapat dibandingkan secara langsung, sehingga kami menyajikannya secara terpisah.
Catatan: Mulai 16 Mei 2021, kami tidak lagi menampilkan pemilik yang belum mengajukan 13D/G dalam setahun terakhir. Sebelumnya, kami menampilkan riwayat lengkap pengajuan 13D/G. Secara umum, entitas yang diwajibkan untuk mengajukan pengajuan 13D/G harus mengajukan setidaknya setiap tahun sebelum mengirimkan pengajuan penutupan. Namun, terkadang dana keluar dari posisi tanpa mengirimkan pengajuan penutupan (misalnya, mereka menghentikan operasi), sehingga menampilkan riwayat lengkap terkadang menyebabkan kebingungan tentang kepemilikan saat ini. Untuk mencegah kebingungan, kami sekarang hanya menampilkan pemilik 'saat ini' - yaitu - pemilik yang telah mengajukan dalam setahun terakhir.
Upgrade to unlock premium data.
| Tanggal File | Formulir | Investor | Sebelumnya Saham |
Terbaru Saham |
Δ Saham (Persen) |
Kepemilikan (Persen) |
Δ Pagmamay-ari (Persen) |
|
|---|---|---|---|---|---|---|---|---|
| 2024-12-13 | BANK OF AMERICA CORP /DE/ | 7,995 | 7,995 | 0.00 | 47.40 | 0.00 | ||
| 2024-12-11 | WELLS FARGO & COMPANY/MN | 3,838 | 3,488 | -9.12 | 21.11 | -7.17 | ||
| 2024-09-09 | Karpus Management, Inc. | 11,763,244 | 11,202,578 | -4.77 | 4.80 | -4.76 |
Pengajuan 13F dan NPORT
Detail pada pengajuan 13F tersedia gratis. Detail pada pengajuan NP memerlukan keanggotaan premium. Baris berwarna hijau menunjukkan posisi baru. Baris berwarna merah menunjukkan posisi yang sudah ditutup. Klik tautan ini ikon untuk melihat riwayat transaksi selengkapnya.
Tingkatkan
untuk membuka data premium dan mengekspor ke Excel ![]() .
.
| Tanggal File | Sumber | Investor | Ketik | Presyo ng Avg (Silangan) |
Saham | Δ Saham (%) |
Dilaporkan Nilai ($1000) |
Nilai Δ (%) |
Alokasi Port (%) |
|
|---|---|---|---|---|---|---|---|---|---|---|
| 2025-07-31 | 13F | Gill Capital Partners, Llc | 591,195 | -14.58 | 6,675 | -16.28 | ||||
| 2025-06-25 | NP | XMPT - VanEck Vectors CEF Municipal Income ETF | 1,161,011 | -5.90 | 13,108 | -9.59 | ||||
| 2025-08-13 | 13F | Colonial Trust Co / SC | 0 | -100.00 | 0 | |||||
| 2025-08-13 | 13F | Millstone Evans Group, LLC | 218 | 0.00 | 2 | 0.00 | ||||
| 2025-08-14 | 13F | Modern Wealth Management, LLC | 231,929 | -4.76 | 2,618 | -6.67 | ||||
| 2025-08-14 | 13F | Hilltop Holdings Inc. | 18,555 | 0.00 | 209 | -1.88 | ||||
| 2025-08-25 | NP | SNTIX - Sit Tax-Free Income Fund | 61,295 | 0.00 | 692 | -1.98 | ||||
| 2025-08-28 | NP | RTAI - RAREVIEW TAX ADVANTAGED INCOME ETF | 158,483 | -25.12 | 1,789 | -26.62 | ||||
| 2025-08-14 | 13F | Coppell Advisory Solutions LLC | 0 | -100.00 | 0 | |||||
| 2025-08-11 | 13F | Kim, Llc | 100,000 | 0.00 | 1,129 | -2.00 | ||||
| 2025-08-12 | 13F | Virtu Financial LLC | 0 | -100.00 | 0 | |||||
| 2025-08-14 | 13F | Bramshill Investments, LLC | 3,211,857 | -20.39 | 36,262 | -21.98 | ||||
| 2025-08-13 | 13F | Cerity Partners LLC | 174,116 | 66.45 | 1,966 | 63.07 | ||||
| 2025-08-14 | 13F | Gould Capital, LLC | 30,263 | -1.35 | 342 | -3.40 | ||||
| 2025-07-24 | 13F | IFP Advisors, Inc | 56,551 | 5,655,000.00 | 638 | |||||
| 2025-04-11 | 13F | Permanent Capital Management, LP | 12,013 | -9.05 | 139 | -9.74 | ||||
| 2025-07-15 | 13F | Bnc Wealth Management, Llc | 48,365 | -9.82 | 546 | -11.51 | ||||
| 2025-07-17 | 13F/A | Capital Investment Advisors, LLC | 360,054 | -3.96 | 4,065 | -5.86 | ||||
| 2025-08-05 | 13F | Claro Advisors LLC | 47,197 | -9.75 | 533 | -11.63 | ||||
| 2025-08-14 | 13F | GWM Advisors LLC | 158,715 | 8.60 | 1,792 | 6.42 | ||||
| 2025-05-12 | 13F | Fmr Llc | 0 | -100.00 | 0 | |||||
| 2025-08-12 | 13F | Advisors Asset Management, Inc. | 550,035 | -0.17 | 6,210 | -2.17 | ||||
| 2025-07-07 | 13F | Wesbanco Bank Inc | 12,799 | 0.00 | 144 | -2.04 | ||||
| 2025-07-24 | 13F | Accredited Investor Services, Llc | 11,952 | -0.21 | 135 | -2.19 | ||||
| 2025-04-24 | 13F | CNB Bank | 0 | -100.00 | 0 | |||||
| 2025-08-05 | 13F | Carolinas Wealth Consulting Llc | 0 | -100.00 | 0 | -100.00 | ||||
| 2025-07-08 | 13F | Melone Private Wealth, LLC | 176,680 | 42.73 | 1,988 | 39.44 | ||||
| 2025-08-14 | 13F | LM Advisors LLC | 308,249 | 0.00 | 3 | 0.00 | ||||
| 2025-07-29 | 13F | TFC Financial Management | 1,020 | 0.00 | 12 | 0.00 | ||||
| 2025-07-25 | 13F | Concord Wealth Partners | 468 | 0.00 | 5 | 0.00 | ||||
| 2025-07-14 | 13F | Occidental Asset Management, LLC | 14,491 | -0.41 | 164 | -2.40 | ||||
| 2025-07-17 | 13F | Janney Montgomery Scott LLC | 301,261 | -2.72 | 3 | 0.00 | ||||
| 2025-07-11 | 13F | Fruth Investment Management | 15,493 | 48.53 | 0 | |||||
| 2025-08-14 | 13F | Van Eck Associates Corp | 1,141,999 | -1.04 | 13 | -7.69 | ||||
| 2025-07-14 | 13F | Sowell Financial Services LLC | 23,255 | -18.79 | 263 | -20.36 | ||||
| 2025-07-23 | 13F | Nbt Bank N A /ny | 2,857 | 0.00 | 32 | 0.00 | ||||
| 2025-08-14 | 13F | Wealth Advisors of Tampa Bay, LLC | 115,672 | 0.00 | 1,306 | -2.03 | ||||
| 2025-08-06 | 13F | Savant Capital, LLC | 181,743 | -0.06 | 2,052 | -2.05 | ||||
| 2025-07-09 | 13F | VisionPoint Advisory Group, LLC | 11,278 | 9.58 | 127 | 7.63 | ||||
| 2025-05-14 | 13F | Caitlin John, LLC | 0 | -100.00 | 0 | |||||
| 2025-08-12 | 13F | Pathstone Holdings, LLC | 0 | -100.00 | 0 | |||||
| 2025-05-30 | NP | RNDLX - RiverNorth/DoubleLine Strategic Income Fund Class R | 1,047,485 | 0.00 | 12,067 | -1.20 | ||||
| 2025-08-12 | 13F | AlphaCore Capital LLC | 13,775 | 2.00 | 157 | 0.00 | ||||
| 2025-08-13 | 13F | StoneX Group Inc. | 243,646 | 13.97 | 2,752 | 11.78 | ||||
| 2025-08-08 | 13F | Fiera Capital Corp | 433,973 | -1.48 | 4,900 | -3.45 | ||||
| 2025-08-05 | 13F | American Institute for Advanced Investment Management, LLP | 10,767 | 0.00 | 122 | -2.42 | ||||
| 2025-08-13 | 13F | Scotia Capital Inc. | 21,500 | 0.00 | 243 | -2.02 | ||||
| 2025-08-18 | 13F/A | Nomura Holdings Inc | 10,000 | 113 | ||||||
| 2025-07-09 | 13F | Breakwater Capital Group | 74,731 | 26.25 | 844 | 23.79 | ||||
| 2025-07-25 | 13F | GFS Advisors, LLC | 419,920 | 18.74 | 4,741 | 16.37 | ||||
| 2025-07-08 | 13F | Nbc Securities, Inc. | 6,772 | 0.00 | 0 | |||||
| 2025-07-15 | 13F | Absolute Investment Advisers Llc | 65,500 | 0.00 | 739 | -1.99 | ||||
| 2025-08-12 | 13F | Coldstream Capital Management Inc | 0 | -100.00 | 0 | |||||
| 2025-08-13 | 13F | Brown Advisory Inc | 27,074 | -3.90 | 306 | -5.86 | ||||
| 2025-08-15 | 13F | Kestra Advisory Services, LLC | 177,654 | -1.04 | 2,006 | -3.00 | ||||
| 2025-08-29 | NP | BHILX - BHILL Fund Managed Account Completion Shares | 158,299 | 1,787 | ||||||
| 2025-08-14 | 13F | Wiley Bros.-aintree Capital, Llc | 13,215 | 149 | ||||||
| 2025-08-01 | 13F | Envestnet Asset Management Inc | 38,148 | -92.50 | 431 | -92.66 | ||||
| 2025-08-13 | 13F | Jones Financial Companies Lllp | 0 | -100.00 | 0 | |||||
| 2025-08-15 | 13F | CI Private Wealth, LLC | 80,378 | 36.39 | 907 | 33.78 | ||||
| 2025-08-05 | 13F | Tiaa Trust, National Association | 27,585 | -6.57 | 311 | -8.53 | ||||
| 2025-08-07 | 13F | Montag A & Associates Inc | 1,143 | 0.00 | 13 | -7.69 | ||||
| 2025-08-12 | 13F | Steward Partners Investment Advisory, Llc | 193,533 | 221.32 | 2,185 | 215.15 | ||||
| 2025-04-14 | 13F | Old National Bancorp /in/ | 0 | -100.00 | 0 | |||||
| 2025-05-12 | 13F | Sandy Spring Bank | 3,998 | 31.73 | 46 | 31.43 | ||||
| 2025-08-12 | 13F | LPL Financial LLC | 812,323 | -15.50 | 9,171 | -17.18 | ||||
| 2025-07-28 | 13F | Mutual Advisors, LLC | 151,787 | -2.50 | 1,685 | -3.33 | ||||
| 2025-08-04 | 13F | Wealth Management Associates, Inc. | 25,026 | 0.00 | 283 | -2.08 | ||||
| 2025-08-14 | 13F | Integrated Wealth Concepts LLC | 25,400 | -0.27 | 287 | -2.39 | ||||
| 2025-08-15 | 13F | Tower Research Capital LLC (TRC) | 26 | 0 | ||||||
| 2025-07-31 | 13F | Cambridge Investment Research Advisors, Inc. | 239,956 | -0.84 | 3 | 0.00 | ||||
| 2025-08-18 | 13F | Second Line Capital, LLC | 11,648 | 0.00 | 132 | -2.22 | ||||
| 2025-07-22 | 13F | Chung Wu Investment Group, LLC | 6,000 | 68 | ||||||
| 2025-08-13 | 13F | Invesco Ltd. | 194,758 | 6.93 | 2,199 | 4.77 | ||||
| 2025-07-22 | 13F | Kercheville Advisors, LLC | 93,567 | 0.07 | 1,056 | -1.95 | ||||
| 2025-08-14 | 13F | Royal Bank Of Canada | 757,477 | 10.59 | 8,552 | 8.38 | ||||
| 2025-05-14 | 13F | Landscape Capital Management, L.l.c. | 0 | -100.00 | 0 | |||||
| 2025-08-14 | 13F | Mml Investors Services, Llc | 0 | -100.00 | 0 | |||||
| 2025-08-08 | 13F | Hartland & Co., LLC | 20,000 | 0.00 | 226 | -2.17 | ||||
| 2025-07-17 | 13F | Archford Capital Strategies, LLC | 16,604 | 0.00 | 187 | -2.09 | ||||
| 2025-08-13 | 13F | Orleans Capital Management Corp/la | 46,850 | 0.00 | 529 | -2.04 | ||||
| 2025-08-15 | 13F | Captrust Financial Advisors | 44,026 | 64.13 | 497 | 60.84 | ||||
| 2025-07-17 | 13F | Melfa Wealth Management, Llc | 38,365 | 0.55 | 433 | -1.37 | ||||
| 2025-07-08 | 13F | Parallel Advisors, LLC | 1,072 | -66.68 | 12 | -67.57 | ||||
| 2025-08-28 | NP | RiverNorth Flexible Municipal Income Fund II, Inc. | 1,740,376 | -7.13 | 19,649 | -8.99 | ||||
| 2025-08-14 | 13F | Robinson Capital Management, Llc | 575,811 | -39.10 | 6,501 | -40.32 | ||||
| 2025-07-16 | 13F | ORG Wealth Partners, LLC | 1,470 | 0.00 | 17 | -5.88 | ||||
| 2025-05-29 | NP | HCIMX - The Intermediate Term Municipal Bond Portfolio HC Strategic Shares | 40,806 | -85.23 | 470 | -85.40 | ||||
| 2025-08-06 | 13F | Smh Capital Advisors Inc | 12,115 | 2.29 | 137 | 0.00 | ||||
| 2025-08-14 | 13F | Jane Street Group, Llc | 91,956 | 286.32 | 1,038 | 278.83 | ||||
| 2025-07-15 | 13F | Fortitude Family Office, LLC | 1,000 | 11 | ||||||
| 2025-08-12 | 13F | TCTC Holdings, LLC | 6,833 | 0.00 | 77 | -1.28 | ||||
| 2025-08-14 | 13F | Ancora Advisors, LLC | 6,979 | -2.92 | 79 | -4.88 | ||||
| 2025-05-02 | 13F | Bogart Wealth, LLC | 0 | -100.00 | 0 | |||||
| 2025-08-14 | 13F | Wells Fargo & Company/mn | 2,430,018 | 28.22 | 27,435 | 25.66 | ||||
| 2025-08-05 | 13F | Bank Of Montreal /can/ | 32,697 | 2.58 | 369 | 0.54 | ||||
| 2025-08-06 | 13F | Aspect Partners, LLC | 941 | 11 | ||||||
| 2025-07-29 | 13F | Tradewinds Capital Management, LLC | 5,018 | 0.00 | 57 | -1.75 | ||||
| 2025-07-29 | 13F | Chicago Partners Investment Group LLC | 26,847 | 0.99 | 297 | -1.99 | ||||
| 2025-07-30 | 13F | Whittier Trust Co Of Nevada Inc | 2,625 | 0.00 | 30 | -3.33 | ||||
| 2025-07-25 | 13F | Apollon Wealth Management, LLC | 12,050 | 0.00 | 136 | -1.45 | ||||
| 2025-08-01 | 13F | Ferguson Shapiro LLC | 16,918 | 2.00 | 191 | 0.00 | ||||
| 2025-08-06 | 13F | Commonwealth Equity Services, Llc | 535,325 | 11.78 | 6 | 20.00 | ||||
| 2025-08-13 | 13F | First Trust Advisors Lp | 13,722 | -2.49 | 155 | -4.94 | ||||
| 2025-08-14 | 13F | Snowden Capital Advisors LLC | 32,915 | -9.24 | 374 | -10.95 | ||||
| 2025-08-13 | 13F | Cresset Asset Management, LLC | 21,256 | 27.14 | 242 | 24.87 | ||||
| 2025-08-07 | 13F | Kestra Private Wealth Services, Llc | 10,139 | 0.63 | 114 | -1.72 | ||||
| 2025-08-12 | 13F | Deutsche Bank Ag\ | 836,000 | -49.52 | 9,438 | -50.53 | ||||
| 2025-08-11 | 13F | NewEdge Wealth, LLC | 17,000 | 192 | ||||||
| 2025-08-12 | 13F | Strategic Advisors LLC | 10,589 | 0.00 | 120 | -1.65 | ||||
| 2025-08-14 | 13F | Widmann Financial Services, Inc. | 19,305 | -8.99 | 218 | -11.07 | ||||
| 2025-08-21 | 13F | Pathway Financial Advisers, LLC | 20,863 | 0.13 | 236 | -2.08 | ||||
| 2025-08-11 | 13F | Delta Asset Management Llc/tn | 11,000 | 0.00 | 124 | -1.59 | ||||
| 2025-08-14 | 13F | Summit Trail Advisors, Llc | 10,976 | 4.17 | 125 | 0.81 | ||||
| 2025-04-25 | 13F | WASHINGTON TRUST Co | 0 | -100.00 | 0 | |||||
| 2025-08-05 | 13F | Bank of New York Mellon Corp | 27,147 | -57.86 | 306 | -58.76 | ||||
| 2025-05-13 | 13F | Adviser Investments LLC | 0 | -100.00 | 0 | |||||
| 2025-07-14 | 13F | U.S. Capital Wealth Advisors, LLC | 89,160 | 9.26 | 1,007 | 7.02 | ||||
| 2025-07-21 | 13F | Ameritas Advisory Services, LLC | 1,968 | 22 | ||||||
| 2025-04-17 | 13F | Bayshore Asset Management, Llc | 0 | -100.00 | 0 | |||||
| 2025-08-29 | NP | PIMCO Flexible Municipal Income Fund | 300,646 | 0.00 | 3,394 | -1.99 | ||||
| 2025-07-10 | 13F | Wealth Enhancement Advisory Services, Llc | 27,993 | -1.01 | 319 | -1.85 | ||||
| 2025-08-07 | 13F | Ibex Wealth Advisors | 138,423 | -2.00 | 1,563 | -4.00 | ||||
| 2025-08-14 | 13F | Benjamin Edwards Inc | 40,222 | 14.52 | 454 | 12.38 | ||||
| 2025-08-12 | 13F | Proequities, Inc. | 0 | 0 | ||||||
| 2025-05-15 | 13F | PenderFund Capital Management Ltd. | 0 | -100.00 | 0 | |||||
| 2025-08-19 | 13F | National Asset Management, Inc. | 0 | -100.00 | 0 | |||||
| 2025-07-18 | 13F | SOA Wealth Advisors, LLC. | 393 | 0.00 | 4 | 0.00 | ||||
| 2025-08-14 | 13F | Mariner, LLC | 69,348 | 19.70 | 783 | 17.24 | ||||
| 2025-08-13 | 13F | Cary Street Partners Financial Llc | 13,829 | 156 | ||||||
| 2025-05-12 | 13F | Independent Advisor Alliance | 0 | -100.00 | 0 | |||||
| 2025-08-14 | 13F | TT Capital Management LLC | 66,328 | 744 | ||||||
| 2025-04-15 | 13F | Noble Wealth Management PBC | 5,970 | -10.06 | 69 | -11.69 | ||||
| 2025-07-28 | 13F | Duncker Streett & Co Inc | 25,635 | 289 | ||||||
| 2025-08-13 | 13F | Thomas J. Herzfeld Advisors, Inc. | 0 | -100.00 | 0 | |||||
| 2025-07-15 | 13F | North Star Investment Management Corp. | 7,140 | 0.00 | 81 | -2.44 | ||||
| 2025-08-28 | NP | RiverNorth Flexible Municipal Income Fund, Inc. | 262,262 | -16.43 | 2,961 | -18.12 | ||||
| 2025-07-18 | 13F | Founders Capital Management | 5,000 | 0.00 | 56 | -1.75 | ||||
| 2025-08-12 | 13F | Minot DeBlois Advisors LLC | 3,000 | 0.00 | 34 | -2.94 | ||||
| 2025-08-13 | 13F | Rsm Us Wealth Management Llc | 58,978 | -35.25 | 670 | -36.55 | ||||
| 2025-07-23 | 13F | Tyche Wealth Partners LLC | 242,184 | -2.37 | 2,734 | -4.31 | ||||
| 2025-08-07 | 13F | Addison Advisors LLC | 79 | 0.00 | 1 | |||||
| 2025-07-09 | 13F | Keystone Wealth Services, LLC | 12,654 | 0.00 | 143 | -2.07 | ||||
| 2025-07-31 | 13F | Oppenheimer & Co Inc | 97,310 | 1.46 | 1,099 | -0.54 | ||||
| 2025-08-14 | 13F | Hurley Capital, LLC | 2,402 | 0.00 | 27 | 0.00 | ||||
| 2025-07-30 | 13F | D.a. Davidson & Co. | 30,091 | 0.00 | 340 | -2.02 | ||||
| 2025-08-08 | 13F | Avantax Advisory Services, Inc. | 10,912 | 1.24 | 123 | -0.81 | ||||
| 2025-07-24 | 13F | Mackay Shields Llc | 2,227,951 | -0.09 | 25,154 | -2.08 | ||||
| 2025-08-13 | 13F | GeoWealth Management, LLC | 50,113 | -15.81 | 566 | -17.52 | ||||
| 2025-08-14 | 13F | UBS Group AG | 3,834,897 | 6.11 | 43,296 | 3.99 | ||||
| 2025-08-27 | NP | RYDEX VARIABLE TRUST - Multi-Hedge Strategies Fund Variable Annuity | 277 | -16.06 | 3 | 0.00 | ||||
| 2025-08-28 | NP | RiverNorth Managed Duration Municipal Income Fund, Inc. | 1,204,428 | -11.74 | 13,598 | -13.51 | ||||
| 2025-08-27 | NP | ROBAX - Robinson Tax Advantaged Income Fund Class A Shares | 575,811 | -39.10 | 6,501 | -40.32 | ||||
| 2025-08-11 | 13F | CBIZ Investment Advisory Services, LLC | 0 | -100.00 | 0 | -100.00 | ||||
| 2025-08-14 | 13F | Citadel Advisors Llc | 0 | -100.00 | 0 | |||||
| 2025-07-23 | 13F | Sachetta, LLC | 0 | -100.00 | 0 | |||||
| 2025-07-07 | 13F | Wealth Alliance Advisory Group, LLC | 32,550 | -3.84 | 367 | -5.66 | ||||
| 2025-08-07 | 13F | Runnymede Capital Advisors, Inc. | 0 | -100.00 | 0 | |||||
| 2025-08-14 | 13F | Bank Of America Corp /de/ | 2,659,934 | 8.71 | 30,031 | 6.54 | ||||
| 2025-08-08 | 13F | Larson Financial Group LLC | 3,229 | 36 | ||||||
| 2025-07-22 | 13F | Compass Financial Group, INC/SD | 22,062 | 0.55 | 249 | -1.19 | ||||
| 2025-08-18 | 13F | Hollencrest Capital Management | 19,519 | 0.00 | 220 | -1.79 | ||||
| 2025-07-15 | 13F | Peddock Capital Advisors, Llc | 29,217 | 0.00 | 330 | -2.08 | ||||
| 2025-07-11 | 13F | Adirondack Trust Co | 669 | 0.00 | 8 | 0.00 | ||||
| 2025-04-15 | 13F | Transform Wealth, LLC | 0 | -100.00 | 0 | |||||
| 2025-08-08 | 13F | Creative Planning | 15,635 | -5.48 | 177 | -7.37 | ||||
| 2025-07-28 | 13F | Harbour Investments, Inc. | 1,517 | 1.27 | 17 | 0.00 | ||||
| 2025-07-31 | 13F | Hartford Financial Management Inc. | 1,175 | 0.00 | 13 | 0.00 | ||||
| 2025-05-13 | 13F | EverSource Wealth Advisors, LLC | 0 | -100.00 | 0 | |||||
| 2025-07-25 | 13F | Allspring Global Investments Holdings, LLC | 811,437 | -31.86 | 9,161 | -33.22 | ||||
| 2025-07-31 | 13F | Pacitti Group Inc. | 10,476 | 0.00 | 118 | -1.67 | ||||
| 2025-07-21 | 13F | Portfolio Strategies, Inc. | 23,527 | -0.60 | 266 | -2.57 | ||||
| 2025-08-13 | 13F | Baird Financial Group, Inc. | 207,333 | -13.80 | 2,341 | -15.52 | ||||
| 2025-08-04 | 13F | Wolverine Asset Management Llc | 0 | -100.00 | 0 | |||||
| 2025-07-08 | 13F | Webster Bank, N. A. | 1,689 | 0.00 | 19 | 0.00 | ||||
| 2025-07-29 | 13F | Private Trust Co Na | 5,036 | -30.86 | 57 | -32.53 | ||||
| 2025-08-18 | 13F | N.E.W. Advisory Services LLC | 2,388 | 2.01 | 27 | 0.00 | ||||
| 2025-08-11 | 13F | Elequin Capital Lp | 18,385 | -34.53 | 208 | -35.91 | ||||
| 2025-08-14 | 13F | Cura Wealth Advisors, Llc | 110,000 | 0.00 | 1,242 | -2.05 | ||||
| 2025-04-08 | 13F | Sterneck Capital Management, LLC | 0 | -100.00 | 0 | |||||
| 2025-08-01 | 13F | Bessemer Group Inc | 0 | -100.00 | 0 | |||||
| 2025-08-11 | 13F | Rothschild Investment Llc | 5,632 | -97.04 | 64 | -97.13 | ||||
| 2025-07-17 | 13F | Nelson, Van Denburg & Campbell Wealth Management Group, LLC | 87,755 | -0.76 | 991 | -2.75 | ||||
| 2025-07-08 | 13F/A | Salem Investment Counselors Inc | 8,900 | 2,752.56 | 101 | 3,266.67 | ||||
| 2025-08-12 | 13F | CIBC Private Wealth Group, LLC | 795 | 0.00 | 9 | 0.00 | ||||
| 2025-08-14 | 13F | Sunbelt Securities, Inc. | 14,726 | 172 | ||||||
| 2025-08-11 | 13F | Annis Gardner Whiting Capital Advisors, LLC | 1,095 | 0.00 | 12 | 0.00 | ||||
| 2025-04-21 | 13F | Riverbridge Partners Llc | 0 | -100.00 | 0 | |||||
| 2025-05-08 | 13F | We Are One Seven, LLC | 0 | -100.00 | 0 | |||||
| 2025-08-12 | 13F | Northstar Financial Companies, Inc. | 0 | -100.00 | 0 | |||||
| 2025-08-14 | 13F | Icon Wealth Advisors, LLC | 12,246 | 0.00 | 138 | -2.13 | ||||
| 2025-07-22 | 13F | Fortitude Advisory Group L.L.C. | 33,970 | 3.77 | 384 | 5.80 | ||||
| 2025-08-08 | 13F | City Of London Investment Management Co Ltd | 0 | -100.00 | 0 | |||||
| 2025-08-14 | 13F | Karpus Management, Inc. | 85,300 | -97.32 | 963 | -97.38 | ||||
| 2025-07-29 | 13F | Sage Private Wealth Group, Llc | 16,787 | 0.00 | 190 | -2.07 | ||||
| 2025-05-09 | 13F | Atria Wealth Solutions, Inc. | 0 | -100.00 | 0 | |||||
| 2025-08-12 | 13F | MAI Capital Management | 58,659 | 2.98 | 662 | 0.91 | ||||
| 2025-07-23 | 13F | Element Wealth, LLC | 16,908 | 0.00 | 191 | -2.06 | ||||
| 2025-08-07 | 13F | Atala Financial Inc | 35,000 | 0.00 | 395 | -1.99 | ||||
| 2025-07-31 | 13F | Carlton Hofferkamp & Jenks Wealth Management, LLC | 15,000 | 0.00 | 166 | 0.00 | ||||
| 2025-07-10 | 13F | Uptown Financial Advisors LLC | 30,340 | 41.78 | 343 | 39.02 | ||||
| 2025-07-29 | 13F | Stratos Wealth Partners, LTD. | 84,596 | -3.26 | 955 | -5.16 | ||||
| 2025-08-11 | 13F | Advisor Resource Council | 0 | -100.00 | 0 | |||||
| 2025-08-14 | 13F | Susquehanna International Group, Llp | 0 | -100.00 | 0 | |||||
| 2025-04-29 | 13F | Lee Danner & Bass Inc | 0 | -100.00 | 0 | |||||
| 2025-08-01 | 13F | Centerpoint Advisors, LLC | 0 | -100.00 | 0 | |||||
| 2025-08-13 | 13F | Summit Financial, LLC | 79,907 | 44.31 | 908 | 42.54 | ||||
| 2025-05-30 | NP | RNCOX - RiverNorth Core Opportunity Fund Class R | 41,929 | -2.05 | 483 | -3.21 | ||||
| 2025-08-14 | 13F | CoreCap Advisors, LLC | 18,475 | 1.99 | 209 | 0.00 | ||||
| 2025-07-30 | 13F | Cornerstone Advisory, LLC | 798,672 | 16.49 | 9,017 | 15.57 | ||||
| 2025-08-28 | NP | RiverNorth Managed Duration Municipal Income Fund II, Inc. | 525,013 | -4.13 | 5,927 | -6.05 | ||||
| 2025-05-08 | 13F | Mesirow Financial Investment Management, Inc. | 0 | -100.00 | 0 | |||||
| 2025-08-27 | NP | RYMSX - Guggenheim Multi-Hedge Strategies Fund Class P | 165 | -34.78 | 2 | -50.00 | ||||
| 2025-07-16 | 13F | Kennicott Capital Management Llc | 15,000 | 0.00 | 169 | -1.74 | ||||
| 2025-07-15 | 13F | Financial Management Professionals, Inc. | 1,039 | 2.06 | 12 | 0.00 | ||||
| 2025-07-16 | 13F | Dakota Wealth Management | 59,828 | -78.43 | 675 | -78.87 | ||||
| 2025-07-18 | 13F | Truist Financial Corp | 31,940 | -0.61 | 361 | -2.70 | ||||
| 2025-07-24 | 13F | Us Bancorp \de\ | 26,993 | 84.78 | 305 | 80.95 | ||||
| 2025-08-06 | 13F | Atlantic Union Bankshares Corp | 3,035 | 34 | ||||||
| 2025-08-07 | 13F | Hennion & Walsh Asset Management, Inc. | 873,528 | -8.41 | 9,862 | -10.23 | ||||
| 2025-08-11 | 13F | Blue Bell Private Wealth Management, Llc | 0 | -100.00 | 0 | |||||
| 2025-07-14 | 13F | Park Avenue Securities Llc | 25,141 | -92.66 | 0 | -100.00 | ||||
| 2025-08-06 | 13F | Prospera Financial Services Inc | 128,126 | 1.86 | 1,447 | -0.21 | ||||
| 2025-07-29 | 13F | Koshinski Asset Management, Inc. | 14,382 | 0.00 | 162 | -1.82 | ||||
| 2025-08-05 | 13F | Texas Bank & Trust Co | 10,841 | 0.00 | 122 | -1.61 | ||||
| 2025-08-04 | 13F | Creative Financial Designs Inc /adv | 1,611 | 0.00 | 18 | 0.00 | ||||
| 2025-07-25 | 13F | Cwm, Llc | 6,000 | 2.51 | 0 | |||||
| 2025-08-04 | 13F | Keybank National Association/oh | 16,921 | 0.00 | 191 | -1.55 | ||||
| 2025-08-15 | 13F | Morgan Stanley | 7,265,987 | 5.68 | 82,033 | 3.57 | ||||
| 2025-08-25 | 13F | Silverlake Wealth Management Llc | 73,264 | 6.55 | 827 | 4.42 | ||||
| 2025-05-15 | 13F | Concorde Asset Management, LLC | 15,466 | 173 | ||||||
| 2025-07-21 | 13F | Ameriflex Group, Inc. | 0 | -100.00 | 0 | |||||
| 2025-08-14 | 13F | Cohen & Steers, Inc. | 404,123 | -2.18 | 5 | 0.00 | ||||
| 2025-07-30 | 13F | Cullen/frost Bankers, Inc. | 0 | -100.00 | 0 | |||||
| 2025-07-17 | 13F | Barry Investment Advisors, LLC | 22,207 | -43.85 | 254 | -44.76 | ||||
| 2025-07-16 | 13F | Tru Independence Asset Management 2, Llc | 15,967 | 0.00 | 181 | -2.16 | ||||
| 2025-08-12 | 13F | Vestor Capital, Llc | 1,000 | -89.27 | 0 | |||||
| 2025-08-08 | 13F | Tortoise Investment Management, LLC | 0 | -100.00 | 0 | |||||
| 2025-08-07 | 13F | King Luther Capital Management Corp | 233 | -2.10 | ||||||
| 2025-08-08 | 13F | Cetera Investment Advisers | 528,118 | 4.01 | 5,962 | 1.93 | ||||
| 2025-07-25 | 13F | Integrated Capital Management, Inc. | 0 | -100.00 | 0 | |||||
| 2025-08-06 | 13F | AE Wealth Management LLC | 18,162 | 205 | ||||||
| 2025-08-06 | 13F | Moors & Cabot, Inc. | 20,646 | 32.04 | 233 | 29.44 | ||||
| 2025-08-14 | 13F | Ameriprise Financial Inc | 416,945 | 15.62 | 4,707 | 13.31 | ||||
| 2025-08-14 | 13F | IHT Wealth Management, LLC | 14,542 | 0.00 | 164 | -1.80 | ||||
| 2025-07-09 | 13F | Summit Financial Consulting LLC | 31,605 | 0.00 | 357 | -2.20 | ||||
| 2025-07-18 | 13F | PFG Investments, LLC | 44,144 | -0.42 | 498 | -2.35 | ||||
| 2025-05-09 | 13F | TD Waterhouse Canada Inc. | 0 | -100.00 | 0 | |||||
| 2025-08-11 | 13F | FSA Wealth Management LLC | 3,000 | 0.00 | 34 | -2.94 | ||||
| 2025-08-05 | 13F | Fourth Dimension Wealth, LLC | 8 | 0.00 | 0 | |||||
| 2025-07-24 | NP | SMLAX - DWS Managed Municipal Bond Fund Class A | 1,244,000 | 0.00 | 13,983 | -6.02 | ||||
| 2025-08-11 | 13F | Private Advisor Group, LLC | 76,209 | -3.21 | 860 | -5.18 | ||||
| 2025-08-14 | 13F | Wetherby Asset Management Inc | 0 | -100.00 | 0 | |||||
| 2025-08-04 | 13F | Simon Quick Advisors, Llc | 16,916 | 1.82 | 191 | -0.52 | ||||
| 2025-08-14 | 13F | Sit Investment Associates Inc | 992,323 | -47.15 | 11 | -47.62 | ||||
| 2025-05-15 | 13F | EP Wealth Advisors, Inc. | 0 | -100.00 | 0 | |||||
| 2025-07-22 | 13F | Diligent Investors, LLC | 19,062 | 0.41 | 215 | -1.38 | ||||
| 2025-08-04 | 13F | Bay Colony Advisory Group, Inc d/b/a Bay Colony Advisors | 14,946 | -15.74 | 169 | -16.83 | ||||
| 2025-07-15 | 13F | Fifth Third Bancorp | 5,136 | 0.00 | 58 | -3.39 | ||||
| 2025-07-08 | 13F | Lowe Wealth Advisors, LLC | 2,174 | 0.00 | 25 | -4.00 | ||||
| 2025-08-05 | 13F | Wakefield Asset Management LLLP | 153,670 | -1.52 | 1,736 | -3.50 | ||||
| 2025-08-15 | 13F | Provenance Wealth Advisors, LLC | 0 | -100.00 | 0 | -100.00 | ||||
| 2025-08-11 | 13F | Anderson Financial Strategies, LLC | 0 | -100.00 | 0 | |||||
| 2025-08-13 | 13F | Northwestern Mutual Wealth Management Co | 76,788 | 17.18 | 867 | 14.85 | ||||
| 2025-08-25 | NP | QWVQX - Clearwater Tax-Exempt Bond Fund | 209,657 | 0.00 | 2,367 | -1.99 | ||||
| 2025-08-11 | 13F | Wealthspire Advisors, LLC | 48,537 | -2.05 | 548 | -4.04 | ||||
| 2025-08-12 | 13F | Insigneo Advisory Services, Llc | 10,530 | 119 | ||||||
| 2025-08-12 | 13F | Global Retirement Partners, LLC | 2,010 | -22.33 | 23 | -26.67 | ||||
| 2025-08-11 | 13F | HighTower Advisors, LLC | 477,843 | 3.38 | 5,395 | 1.31 | ||||
| 2025-08-14 | 13F | Vivaldi Capital Management, LLC | 12,930 | 0.00 | 146 | -2.03 | ||||
| 2025-04-18 | 13F | CENTRAL TRUST Co | 0 | -100.00 | 0 | |||||
| 2025-07-16 | 13F | Maridea Wealth Management LLC | 11,783 | -1.30 | 133 | -2.92 | ||||
| 2025-08-14 | 13F | Novus Advisors, Llc | 0 | -100.00 | 0 | |||||
| 2025-08-07 | 13F | Allworth Financial LP | 15,865 | 523.13 | 179 | 539.29 | ||||
| 2025-08-14 | 13F | Raymond James Financial Inc | 1,986,377 | 4.13 | 22,426 | 2.05 | ||||
| 2025-08-08 | 13F | Pnc Financial Services Group, Inc. | 84,490 | -1.51 | 954 | -3.54 | ||||
| 2025-08-13 | 13F | M Holdings Securities, Inc. | 35,038 | 0 | ||||||
| 2025-08-14 | 13F | Archetype Wealth Partners | 43,976 | -27.31 | 0 | |||||
| 2025-04-29 | 13F | CoreFirst Bank & Trust | 0 | -100.00 | 0 | |||||
| 2025-07-24 | 13F | Eastern Bank | 2,556 | 0.00 | 29 | -3.45 | ||||
| 2025-08-12 | 13F | Sfmg, Llc | 12,709 | 0.00 | 143 | -2.05 | ||||
| 2025-07-23 | 13F | Cfm Wealth Partners Llc | 50,961 | 0.00 | 575 | -2.04 | ||||
| 2025-08-29 | NP | BRMSX - Bramshill Income Performance Fund Institutional Class | 703,660 | -12.05 | 7,944 | -13.80 | ||||
| 2025-07-11 | 13F | Congress Park Capital LLC | 540,000 | 14.29 | 6,097 | 12.00 | ||||
| 2025-07-11 | 13F/A | Umb Bank N A/mo | 6,452 | 73 | ||||||
| 2025-07-17 | 13F | Eagle Bluffs Wealth Management LLC | 639,085 | 2.45 | 7,264 | 0.41 | ||||
| 2025-08-13 | 13F | Townsquare Capital Llc | 0 | -100.00 | 0 | |||||
| 2025-07-09 | 13F | Sunpointe, LLC | 20,745 | 0.00 | 236 | -2.08 | ||||
| 2025-04-11 | 13F | Godsey & Gibb Associates | 0 | -100.00 | 0 | |||||
| 2025-07-23 | 13F | Indiana Trust & Investment Management CO | 170,299 | 0.00 | 1,923 | -1.99 | ||||
| 2025-07-28 | 13F | Allianz Asset Management GmbH | 300,646 | 0.00 | 3,394 | -1.99 | ||||
| 2025-08-14 | 13F | Financial Engines Advisors L.L.C. | 11,428 | 129 | ||||||
| 2025-05-15 | 13F | Williams Jones Wealth Management, LLC. | 0 | -100.00 | 0 | |||||
| 2025-07-21 | 13F | Mechanics Financial Corp | 8,500 | 0.00 | 96 | -2.06 | ||||
| 2025-06-24 | NP | MainStay MacKay Municipal Income Opportunities Fund | 52,133 | 0.00 | 589 | -3.92 | ||||
| 2025-08-28 | NP | RDFI - RAREVIEW DYNAMIC FIXED INCOME ETF | 101,642 | -28.35 | 1,148 | -29.80 | ||||
| 2025-08-11 | 13F | VSM Wealth Advisory, LLC | 10,130 | -22.35 | 114 | -24.00 | ||||
| 2025-05-15 | 13F | Buckingham Strategic Partners | 0 | -100.00 | 0 | |||||
| 2025-08-13 | 13F | VestGen Advisors, LLC | 0 | -100.00 | 0 | |||||
| 2025-09-04 | 13F/A | Advisor Group Holdings, Inc. | 347,308 | 39.16 | 3,922 | 36.38 | ||||
| 2025-08-13 | 13F | Kuhn & Co Investment Counsel | 57,212 | 13.69 | 646 | 11.40 | ||||
| 2025-08-14 | 13F | Harwood Advisory Group, LLC | 308 | 0.00 | 3 | 0.00 | ||||
| 2025-07-17 | 13F | XML Financial, LLC | 144,523 | 3.19 | 1,632 | 1.12 | ||||
| 2025-05-07 | 13F | Sheaff Brock Investment Advisors, LLC | 13,178 | 0.00 | 152 | -1.31 | ||||
| 2025-07-22 | 13F | Coastal Investment Advisors, Inc. | 48,897 | 102.67 | 552 | 99.28 | ||||
| 2025-08-13 | 13F | Crescent Grove Advisors, LLC | 63,596 | -0.39 | 723 | -2.43 | ||||
| 2025-08-05 | 13F | Palogic Value Management, L.P. | 263,795 | 12.50 | 2,978 | 10.26 | ||||
| 2025-08-04 | 13F | Spire Wealth Management | 31,547 | 39.92 | 356 | 37.45 | ||||
| 2025-07-28 | 13F | RFG Advisory, LLC | 57,802 | 3.57 | 653 | 1.56 | ||||
| 2025-06-24 | NP | MMHVX - MainStay MacKay High Yield Municipal Bond Fund Investor Class | 439,229 | 0.00 | 4,959 | -3.91 | ||||
| 2025-07-29 | 13F | Stratos Wealth Advisors, LLC | 72,001 | 0.00 | 813 | -2.05 | ||||
| 2025-08-18 | 13F | Geneos Wealth Management Inc. | 26,906 | -2.16 | 304 | -4.11 | ||||
| 2025-05-08 | 13F | XTX Topco Ltd | 0 | -100.00 | 0 | |||||
| 2025-08-14 | 13F | RMB Capital Management, LLC | 15,000 | 0.00 | 170 | -1.73 | ||||
| 2025-08-14 | 13F/A | Rockefeller Capital Management L.P. | 205,816 | 10.78 | 2,324 | 8.55 | ||||
| 2025-05-15 | 13F | Human Investing LLC | 0 | -100.00 | 0 | |||||
| 2025-08-14 | 13F | Kovitz Investment Group Partners, LLC | 0 | -100.00 | 0 | -100.00 | ||||
| 2025-08-11 | 13F | WPG Advisers, LLC | 2,245 | -35.10 | 25 | -35.90 | ||||
| 2025-08-28 | NP | RiverNorth Opportunistic Municipal Income Fund, Inc. | 439,339 | -10.94 | 4,960 | -12.71 | ||||
| 2025-05-29 | NP | FFSAX - Touchstone Flexible Income Fund Class A | 726 | -99.93 | 8 | -99.94 | ||||
| 2025-07-17 | 13F | Catalytic Wealth RIA, LLC | 50,113 | -15.81 | 566 | -17.52 | ||||
| 2025-08-14 | 13F | Beacon Investment Advisors Llc | 13,419 | 0.24 | 151 | -2.60 | ||||
| 2025-07-11 | 13F | Quad-Cities Investment Group, LLC | 10,955 | 1.11 | 124 | -0.81 | ||||
| 2025-08-13 | 13F | Plan Group Financial, LLC | 13,410 | 151 | ||||||
| 2025-08-28 | NP | Cohen & Steers Closed-end Opportunity Fund, Inc. | 255,123 | -3.41 | 2,880 | -5.33 | ||||
| 2025-08-14 | 13F | Mercer Global Advisors Inc /adv | 32,721 | 369 | ||||||
| 2025-08-14 | 13F | Comerica Bank | 41,781 | 0.68 | 472 | -1.46 | ||||
| 2025-08-19 | 13F | Advisory Services Network, LLC | 63,151 | -8.24 | 704 | -11.11 | ||||
| 2025-08-12 | 13F | Journey Strategic Wealth Llc | 28,650 | -17.58 | 323 | -19.25 | ||||
| 2025-07-22 | 13F | Wealthcare Advisory Partners LLC | 22,135 | -22.30 | 250 | -24.09 | ||||
| 2025-08-13 | 13F | Avestar Capital, LLC | 14,500 | 165 | ||||||
| 2025-08-13 | 13F | Guggenheim Capital Llc | 1,399,034 | 11.46 | 15,795 | 9.23 | ||||
| 2025-08-14 | 13F | Stifel Financial Corp | 558,672 | -10.65 | 6,307 | -12.44 | ||||
| 2025-08-12 | 13F | Jpmorgan Chase & Co | 856 | 10 | ||||||
| 2025-07-01 | 13F | Harbor Investment Advisory, Llc | 2,183 | 0.00 | 25 | -4.00 | ||||
| 2025-07-23 | 13F | Charter Trust Co | 13,025 | 0.00 | 147 | -2.00 | ||||
| 2025-07-25 | 13F | Concurrent Investment Advisors, LLC | 52,372 | -13.33 | 591 | -15.09 | ||||
| 2025-07-24 | 13F | Jfs Wealth Advisors, Llc | 118,391 | 0.07 | 1,337 | -1.91 | ||||
| 2025-08-13 | 13F | McGowan Group Asset Management, Inc. | 1,243,365 | 10.49 | 14,038 | 8.29 | ||||
| 2025-07-22 | 13F | Mascoma Wealth Management LLC | 419 | 0.00 | 5 | 0.00 | ||||
| 2025-04-22 | 13F | Comprehensive Money Management Services LLC | 0 | -100.00 | 0 | |||||
| 2025-08-13 | 13F | Northern Trust Corp | 0 | -100.00 | 0 | |||||
| 2025-07-30 | 13F | FNY Investment Advisers, LLC | 1,800 | 0.00 | 0 | |||||
| 2025-08-27 | NP | RMMBX - Aspiriant Risk-Managed Municipal Bond Fund | 15,085 | 0.00 | 170 | -1.73 | ||||
| 2025-08-14 | 13F | Two Sigma Securities, Llc | 10,643 | 120 | ||||||
| 2025-08-11 | 13F | Traub Capital Management LLC | 6,300 | 71 | ||||||
| 2025-08-13 | 13F | Smith, Moore & Co. | 102,231 | 9.24 | 1,154 | 7.05 | ||||
| 2025-08-05 | 13F | Rareview Capital LLC | 270,646 | -25.69 | 3,056 | -27.18 | ||||
| 2025-08-13 | 13F | West Chester Capital Advisors, Inc | 15,504 | 0.00 | 175 | -1.69 | ||||
| 2025-07-25 | NP | MFLX - First Trust Municipal CEF Income Opportunity ETF This fund is a listed as child fund of First Trust Advisors Lp and if that institution has disclosed ownership in this security, then these positions will not be double counted when calculating total shares and total value | 6,468 | 0.00 | 73 | -6.49 | ||||
| 2025-07-17 | 13F | Camelot Portfolios, LLC | 17,172 | 3.78 | 194 | 1.58 | ||||
| 2025-07-25 | 13F | Hemington Wealth Management | 1,095 | 0.00 | 0 | |||||
| 2025-07-17 | 13F | Lee Johnson Capital Management, Llc | 14,279 | 2.00 | 161 | 0.00 | ||||
| 2025-08-14 | 13F | Colony Group, LLC | 30,874 | 49.16 | 349 | 46.22 | ||||
| 2025-08-14 | 13F | TCG Advisory Services, LLC | 17,150 | -2.28 | 194 | -4.46 | ||||
| 2025-07-24 | NP | NOTAX - DWS Strategic High Yield Tax-Free Fund Class A | 412,000 | 0.00 | 4,631 | -6.03 | ||||
| 2025-08-01 | 13F | Clark Asset Management, LLC | 15,500 | 0.00 | 175 | -2.25 | ||||
| 2025-07-22 | 13F | Belpointe Asset Management LLC | 26,581 | 0.13 | 300 | -1.64 | ||||
| 2025-07-11 | 13F | Farther Finance Advisors, LLC | 3,328 | 0.64 | 38 | -2.63 | ||||
| 2025-08-11 | 13F | Principal Securities, Inc. | 700 | -92.44 | 8 | -93.46 | ||||
| 2025-07-24 | 13F | MSH Capital Advisors LLC | 60,847 | 13.45 | 687 | 11.18 | ||||
| 2025-08-12 | 13F | Horizon Kinetics Asset Management Llc | 190,361 | 37.83 | 2,149 | 35.07 | ||||
| 2025-08-14 | 13F | Rivernorth Capital Management, Llc | 4,171,418 | -35.21 | 47,095 | -36.51 | ||||
| 2025-07-21 | 13F | Cliftonlarsonallen Wealth Advisors, Llc | 134,750 | 43.16 | 1,521 | 40.31 | ||||
| 2025-07-25 | 13F | Summa Corp. | 30,464 | 337 | ||||||
| 2025-07-18 | 13F | Institute for Wealth Management, LLC. | 13,804 | 0.00 | 156 | -2.52 | ||||
| 2025-08-05 | 13F | Carson Advisory Inc. | 11,620 | -11.47 | 131 | -13.25 | ||||
| 2025-08-07 | 13F | Resources Investment Advisors, LLC. | 238,495 | 333.81 | 2,693 | 325.28 | ||||
| 2025-07-22 | 13F | Merit Financial Group, LLC | 24,497 | 23.33 | 277 | 21.05 | ||||
| 2025-08-11 | 13F | Aptus Capital Advisors, LLC | 11,648 | -15.02 | 132 | -16.56 |