Mga Batayang Estadistika
| Saham Institusional (Jangka Panjang) | 79,229,003 - 47.43% (ex 13D/G) - change of 11.70MM shares 17.33% MRQ |
| Nilai Institusional (Jangka Panjang) | $ 2,598,658 USD ($1000) |
Kepemilikan Institusional dan Pemegang Saham
Millicom International Cellular S.A. (US:TIGO) memiliki 262 pemilik institusional dan pemegang saham yang telah mengajukan formulir 13D/G atau 13F kepada Komisi Bursa Efek (Securities Exchange Commission/SEC). Lembaga-lembaga ini memegang total 79,229,003 saham. Pemegang saham terbesar meliputi Dodge & Cox, DODFX - Dodge & Cox International Stock Fund, Brandes Investment Partners, Lp, Price T Rowe Associates Inc /md/, BlackRock, Inc., Boston Partners, Barclays Plc, Swedbank AB, Arrowstreet Capital, Limited Partnership, and State Street Corp .
Struktur kepemilikan institusional Millicom International Cellular S.A. (NasdaqGS:TIGO) menunjukkan posisi terkini di perusahaan oleh institusi dan dana, serta perubahan terbaru dalam ukuran posisi. Pemegang saham utama dapat mencakup investor individu, reksa dana, dana lindung nilai, atau institusi. Jadwal 13D menunjukkan bahwa investor memegang (atau pernah memegang) lebih dari 5% saham perusahaan dan bermaksud (atau pernah bermaksud) untuk secara aktif mengejar perubahan strategi bisnis. Jadwal 13G menunjukkan investasi pasif lebih dari 5%.
The share price as of September 5, 2025 is 47.15 / share. Previously, on September 9, 2024, the share price was 26.54 / share. This represents an increase of 77.66% over that period.

Skor Sentimen Dana
Skor Sentimen Dana (sebelumnya dikenal sebagai Skor Akumulasi Kepemilikan) menemukan saham-saham yang paling banyak dibeli oleh dana. Ini adalah hasil dari model kuantitatif multi-faktor yang canggih yang mengidentifikasi perusahaan dengan tingkat akumulasi institusional tertinggi. Model penilaian menggunakan kombinasi dari total peningkatan pemilik yang diungkapkan, perubahan dalam alokasi portofolio pada pemilik tersebut, dan metrik lainnya. Angka berkisar dari 0 hingga 100, dengan angka yang lebih tinggi menunjukkan tingkat akumulasi yang lebih tinggi dibandingkan dengan perusahaan sejenisnya, dan 50 adalah rata-ratanya.
Frekuensi Pembaruan: Setiap Hari
Lihat Ownership Explorer, yang menyediakan daftar perusahaan dengan peringkat tertinggi.
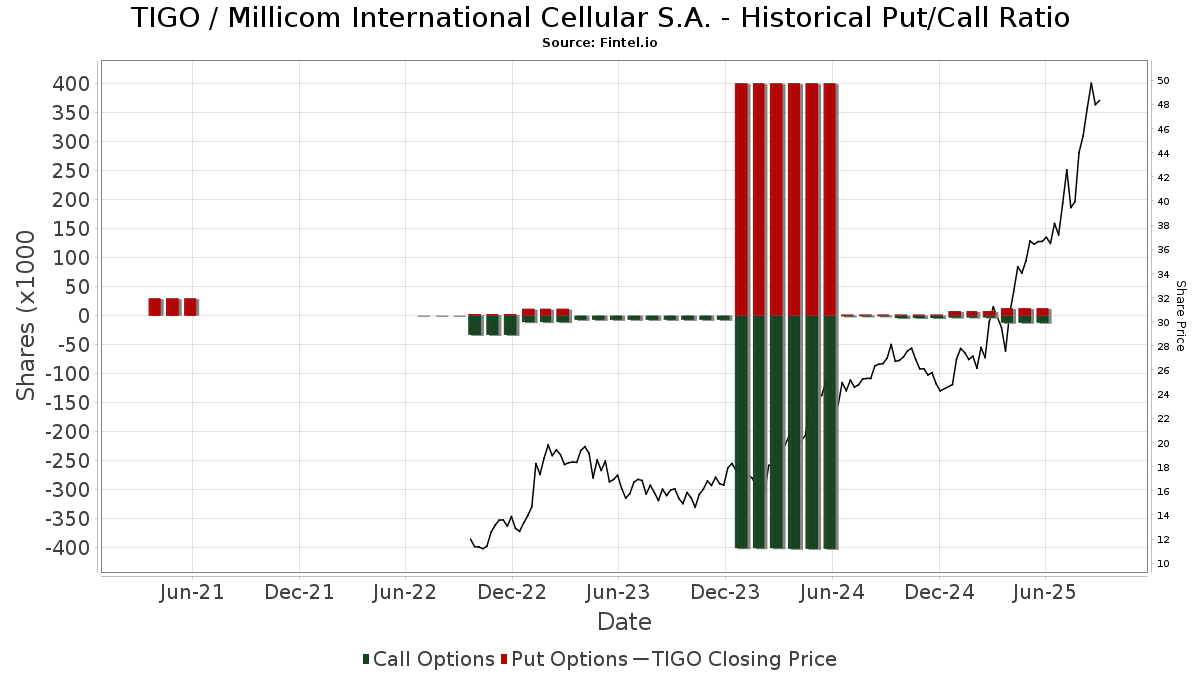
Rasio Put/Call Institusional
Selain melaporkan isu ekuitas dan utang standar, institusi dengan aset di bawah manajemen lebih dari 100 juta dolar AS juga harus mengungkapkan kepemilikan opsi put dan call mereka. Karena opsi put umumnya menunjukkan sentimen negatif, dan opsi call menunjukkan sentimen positif, kita dapat mengetahui sentimen institusional secara keseluruhan dengan memplot rasio put terhadap call. Grafik di sebelah kanan memplot rasio put/call historis untuk instrumen ini.
Menggunakan Rasio Put/Call sebagai indikator sentimen investor mengatasi salah satu kekurangan utama dari penggunaan total kepemilikan institusional, yaitu sejumlah besar aset yang dikelola diinvestasikan secara pasif untuk melacak indeks. Dana yang dikelola secara pasif biasanya tidak membeli opsi, sehingga indikator rasio put/call lebih akurat dalam melacak sentimen dana yang dikelola secara aktif.
Pengajuan 13D/G
Kami menyajikan pengajuan 13D/G secara terpisah dari pengajuan 13F karena perlakuan yang berbeda oleh SEC. Pengajuan 13D/G dapat diajukan oleh kelompok investor (dengan satu pemimpin), sedangkan pengajuan 13F tidak bisa. Hal ini mengakibatkan situasi di mana seorang investor dapat mengajukan 13D/G yang melaporkan satu nilai untuk total saham (mewakili semua saham yang dimiliki oleh kelompok investor), tetapi kemudian mengajukan 13F yang melaporkan nilai yang berbeda untuk total saham (mewakili kepemilikan mereka sendiri). Ini berarti bahwa kepemilikan saham dari pengajuan 13D/G dan pengajuan 13F seringkali tidak dapat dibandingkan secara langsung, sehingga kami menyajikannya secara terpisah.
Catatan: Mulai 16 Mei 2021, kami tidak lagi menampilkan pemilik yang belum mengajukan 13D/G dalam setahun terakhir. Sebelumnya, kami menampilkan riwayat lengkap pengajuan 13D/G. Secara umum, entitas yang diwajibkan untuk mengajukan pengajuan 13D/G harus mengajukan setidaknya setiap tahun sebelum mengirimkan pengajuan penutupan. Namun, terkadang dana keluar dari posisi tanpa mengirimkan pengajuan penutupan (misalnya, mereka menghentikan operasi), sehingga menampilkan riwayat lengkap terkadang menyebabkan kebingungan tentang kepemilikan saat ini. Untuk mencegah kebingungan, kami sekarang hanya menampilkan pemilik 'saat ini' - yaitu - pemilik yang telah mengajukan dalam setahun terakhir.
Upgrade to unlock premium data.
| Tanggal File | Formulir | Investor | Sebelumnya Saham |
Terbaru Saham |
Δ Saham (Persen) |
Kepemilikan (Persen) |
Δ Pagmamay-ari (Persen) |
|
|---|---|---|---|---|---|---|---|---|
| 2025-09-04 | Atlas Investissement | 70,470,018 | 70,470,018 | 0.00 | 42.20 | 0.00 |
Pengajuan 13F dan NPORT
Detail pada pengajuan 13F tersedia gratis. Detail pada pengajuan NP memerlukan keanggotaan premium. Baris berwarna hijau menunjukkan posisi baru. Baris berwarna merah menunjukkan posisi yang sudah ditutup. Klik tautan ini ikon untuk melihat riwayat transaksi selengkapnya.
Tingkatkan
untuk membuka data premium dan mengekspor ke Excel ![]() .
.
| Tanggal File | Sumber | Investor | Ketik | Presyo ng Avg (Silangan) |
Saham | Δ Saham (%) |
Dilaporkan Nilai ($1000) |
Nilai Δ (%) |
Alokasi Port (%) |
|
|---|---|---|---|---|---|---|---|---|---|---|
| 2025-08-19 | 13F | Delos Wealth Advisors, LLC | 27 | 1 | ||||||
| 2025-08-19 | 13F | Delos Wealth Advisors, LLC | Call | 11 | ||||||
| 2025-08-14 | 13F | Stifel Financial Corp | 5,884 | 220 | ||||||
| 2025-08-05 | 13F | Simplex Trading, Llc | 15,772 | 1,612.49 | 1 | |||||
| 2025-08-14 | 13F | Western Standard LLC | 313,943 | 39.27 | 11,763 | 72.40 | ||||
| 2025-08-13 | 13F | Pictet Asset Management Holding SA | 16,832 | 630 | ||||||
| 2025-08-13 | 13F | Employees Retirement System of Texas | 45,517 | 0.00 | 2 | 0.00 | ||||
| 2025-08-07 | 13F | Zurcher Kantonalbank (Zurich Cantonalbank) | 33,728 | 436.73 | 1,264 | 564.74 | ||||
| 2025-08-01 | 13F | Bessemer Group Inc | 244 | 0 | ||||||
| 2025-08-12 | 13F | Proequities, Inc. | 0 | 0 | ||||||
| 2025-08-11 | 13F | Vanguard Group Inc | 179,033 | 99.31 | 6,708 | 146.71 | ||||
| 2025-07-28 | 13F | BRYN MAWR TRUST Co | 538 | 0.00 | 20 | 25.00 | ||||
| 2025-08-14 | 13F | Snowden Capital Advisors LLC | 13,253 | -24.80 | 497 | -6.94 | ||||
| 2025-08-14 | 13F | Jane Street Group, Llc | 16,769 | -45.30 | 628 | -32.33 | ||||
| 2025-07-29 | NP | JEVNX - Emerging Markets Fund Class NAV | 60,605 | 2,273 | ||||||
| 2025-08-11 | 13F | Wbi Investments, Inc. | 26,038 | 976 | ||||||
| 2025-08-12 | 13F/A | Boston Partners | 2,956,476 | 22.11 | 110,779 | 51.16 | ||||
| 2025-08-14 | 13F | UBS Group AG | 129,920 | -26.25 | 4,868 | -8.70 | ||||
| 2025-08-27 | 13F/A | Brinker Capital Investments, LLC | 5,356 | 201 | ||||||
| 2025-07-24 | 13F | Us Bancorp \de\ | 350 | 0.00 | 13 | 30.00 | ||||
| 2025-08-13 | 13F | Invesco Ltd. | 168,791 | 1,443.44 | 6,325 | 1,810.57 | ||||
| 2025-08-12 | 13F | Trexquant Investment LP | 0 | -100.00 | 0 | |||||
| 2025-08-11 | 13F | Renaissance Group Llc | 292,080 | -6.78 | 10,944 | 15.39 | ||||
| 2025-08-12 | 13F | Sierra Summit Advisors Llc | 22,475 | 842 | ||||||
| 2025-08-13 | 13F | First Trust Advisors Lp | 621,692 | 22.59 | 23,295 | 51.74 | ||||
| 2025-08-13 | 13F | Marshall Wace, Llp | 84,885 | 720.70 | 3,181 | 915.97 | ||||
| 2025-08-14 | 13F | Investor Ab | 20,781 | -69.34 | 779 | -62.07 | ||||
| 2025-08-08 | 13F/A | Sterling Capital Management LLC | 6,838 | 256 | ||||||
| 2025-08-14 | 13F | Lazard Asset Management Llc | 4,726 | -91.16 | 0 | -100.00 | ||||
| 2025-07-23 | 13F | Equitable Trust Co | 7,447 | -25.11 | 279 | -7.31 | ||||
| 2025-03-18 | 13F/A | Bank Of America Corp /de/ | Call | 0 | -100.00 | 0 | -100.00 | |||
| 2025-08-12 | 13F | Legal & General Group Plc | 155,412 | -2.29 | 5,823 | 20.96 | ||||
| 2025-08-11 | 13F | Raiffeisen Bank International AG | 42,000 | 0.00 | 1,532 | 20.82 | ||||
| 2025-08-12 | 13F | Magnetar Financial LLC | 12,146 | 57.90 | 455 | 96.12 | ||||
| 2025-08-26 | 13F/A | Thrivent Financial For Lutherans | 5,427 | 0 | ||||||
| 2025-08-29 | NP | JAJJX - International Value Trust NAV | 76,767 | 4.64 | 2,876 | 29.55 | ||||
| 2025-08-12 | 13F | Segall Bryant & Hamill, Llc | 97,577 | 0.31 | 3,656 | 24.18 | ||||
| 2025-08-04 | 13F | Spinnaker Trust | 7,000 | 0.00 | 262 | 24.17 | ||||
| 2025-08-01 | 13F | Logan Capital Management Inc | 0 | -100.00 | 0 | |||||
| 2025-08-13 | 13F | EverSource Wealth Advisors, LLC | 1,413 | 55.10 | 53 | 92.59 | ||||
| 2025-05-13 | 13F | Semanteon Capital Management, LP | 0 | -100.00 | 0 | -100.00 | ||||
| 2025-08-13 | 13F | Northern Trust Corp | 556,928 | 73.09 | 20,868 | 114.27 | ||||
| 2025-08-14 | 13F | Vident Advisory, LLC | 13,115 | -4.15 | 491 | 18.60 | ||||
| 2025-07-18 | 13F | USA Financial Portformulas Corp | 803 | 30 | ||||||
| 2025-05-29 | NP | MMIUX - MassMutual Select T. Rowe Price International Equity Fund Class I | 22,135 | 670 | ||||||
| 2025-08-07 | 13F | Future Fund LLC | 44,491 | 195.27 | 1,667 | 265.57 | ||||
| 2025-08-13 | 13F | Walleye Capital LLC | 55,035 | 2,062 | ||||||
| 2025-08-26 | NP | CIEQX - Segall Bryant & Hamill International Equity Fund - Institutional Class | 400 | 300.00 | 15 | 366.67 | ||||
| 2025-07-11 | 13F | Bond & Devick Financial Network, Inc. | 6,000 | 225 | ||||||
| 2025-08-14 | 13F | Cubist Systematic Strategies, LLC | 0 | -100.00 | 0 | |||||
| 2025-07-25 | 13F | Meritage Portfolio Management | 142,018 | 5,321 | ||||||
| 2025-08-14 | 13F | Wexford Capital Lp | 40,000 | 0.00 | 1,499 | 23.80 | ||||
| 2025-08-14 | 13F | Engineers Gate Manager LP | 32,870 | -46.77 | 1,232 | -34.14 | ||||
| 2025-05-15 | 13F | D. E. Shaw & Co., Inc. | 0 | -100.00 | 0 | |||||
| 2025-07-25 | 13F | CBOE Vest Financial, LLC | 19,120 | 45.17 | 716 | 79.90 | ||||
| 2025-08-08 | 13F | Quinn Opportunity Partners LLC | 0 | -100.00 | 0 | |||||
| 2025-08-14 | 13F | BTG Pactual Asset Management US LLC | 63,416 | 0.97 | 2,376 | 24.99 | ||||
| 2025-08-12 | 13F | Moon Capital Management Lp | 215,923 | 0.00 | 8,091 | 23.79 | ||||
| 2025-08-26 | NP | TLSTX - Stock Index Fund | 1,285 | 48 | ||||||
| 2025-08-14 | 13F | Ubs Asset Management Americas Inc | 453,265 | 61.34 | 16,984 | 99.71 | ||||
| 2025-08-14 | 13F | Voya Investment Management Llc | 25,409 | 952 | ||||||
| 2025-08-06 | 13F | Fox Run Management, L.l.c. | 9,569 | 359 | ||||||
| 2025-08-12 | 13F | Handelsbanken Fonder AB | 23,300 | 1 | ||||||
| 2025-08-28 | NP | New Age Alpha Funds Trust - NAA Opportunity Fund Class C | 3,840 | 144 | ||||||
| 2025-06-26 | NP | JDIBX - John Hancock Disciplined Value International Fund Class A | 1,350,594 | 46,650 | ||||||
| 2025-08-08 | 13F | Police & Firemen's Retirement System of New Jersey | 61,368 | 170.57 | 2,299 | 235.13 | ||||
| 2025-08-14 | 13F/A | Skopos Labs, Inc. | 31 | 1 | ||||||
| 2025-08-13 | 13F | Schroder Investment Management Group | 0 | -100.00 | 0 | |||||
| 2025-08-14 | 13F | Mangrove Partners | 1,079,249 | 0.00 | 40,439 | 23.79 | ||||
| 2025-07-28 | NP | NSI - National Security Emerging Markets Index ETF | 1,614 | 38.66 | 61 | 100.00 | ||||
| 2025-08-06 | 13F | BNP Paribas Asset Management Holding S.A. | 288,302 | 11 | ||||||
| 2025-07-24 | 13F | Triodos Investment Management BV | 808,000 | -8.86 | 30,243 | 12.97 | ||||
| 2025-08-14 | 13F | Utah Retirement Systems | 5,430 | 203 | ||||||
| 2025-08-07 | 13F | Addison Advisors LLC | 2 | 0.00 | 0 | |||||
| 2025-08-12 | 13F | CIBC Private Wealth Group, LLC | 381 | 0.00 | 14 | 40.00 | ||||
| 2025-08-12 | 13F | Jpmorgan Chase & Co | 1,439,114 | 21.91 | 53,924 | 50.91 | ||||
| 2025-08-28 | NP | MISAX - Victory Trivalent International Small-Cap Fund Class A | 487,198 | -3.11 | 18,255 | 19.94 | ||||
| 2025-08-14 | 13F | Citadel Advisors Llc | Put | 7,300 | -13.10 | 274 | 7.48 | |||
| 2025-08-28 | NP | SLGFX - SIMT Large Cap Index Fund Class F | 2,100 | 79 | ||||||
| 2025-08-06 | 13F | First Horizon Advisors, Inc. | 435 | -14.03 | 16 | 6.67 | ||||
| 2025-08-11 | 13F | HighTower Advisors, LLC | 7,218 | 0.00 | 270 | 23.85 | ||||
| 2025-08-13 | 13F | Victory Capital Management Inc | 741,671 | -2.38 | 27,790 | 20.84 | ||||
| 2025-05-15 | 13F | Squarepoint Ops LLC | 0 | -100.00 | 0 | |||||
| 2025-08-14 | 13F | Citadel Advisors Llc | 128,385 | -62.15 | 4,811 | -53.15 | ||||
| 2025-08-14 | 13F | Susquehanna International Group, Llp | 143,814 | 1,144.28 | 5,389 | 1,443.84 | ||||
| 2025-08-15 | 13F | Tower Research Capital LLC (TRC) | 348 | -23.52 | 13 | 0.00 | ||||
| 2025-07-28 | 13F | Allianz Asset Management GmbH | 49,367 | 1,850 | ||||||
| 2025-08-14 | 13F | Goldman Sachs Group Inc | 307,044 | -81.66 | 11,505 | -77.29 | ||||
| 2025-08-12 | 13F | BlackRock, Inc. | 4,955,339 | 101.70 | 185,677 | 149.68 | ||||
| 2025-08-13 | 13F | Mirabella Financial Services Llp | 0 | -100.00 | 0 | |||||
| 2025-08-13 | 13F | Mackenzie Financial Corp | 524,229 | 19,643 | ||||||
| 2025-08-19 | 13F | State of Wyoming | 4,655 | 123.37 | 174 | 176.19 | ||||
| 2025-08-14 | 13F | Smartleaf Asset Management LLC | 202 | 0.00 | 7 | 16.67 | ||||
| 2025-08-26 | NP | BEMCX - BRANDES EMERGING MARKETS VALUE FUND Class C | 447,962 | 0.00 | 16,785 | 23.79 | ||||
| 2025-08-12 | 13F | Rhumbline Advisers | 79,062 | 2,962 | ||||||
| 2025-05-15 | 13F | Point72 Asia (Singapore) Pte. Ltd. | 0 | -100.00 | 0 | -100.00 | ||||
| 2025-08-14 | 13F | Bank Of America Corp /de/ | 105,660 | 46.31 | 3,959 | 81.11 | ||||
| 2025-08-13 | 13F | National Bank Of Canada /fi/ | 0 | -100.00 | 0 | |||||
| 2025-07-18 | 13F | Ewa, Llc | 6,757 | 1.78 | 253 | 26.50 | ||||
| 2025-08-14 | 13F | Two Sigma Advisers, Lp | 109,100 | -79.42 | 4,088 | -74.53 | ||||
| 2025-08-15 | 13F | Morgan Stanley | 1,241,263 | 195.09 | 46,510 | 265.30 | ||||
| 2025-07-24 | 13F | IFP Advisors, Inc | 1,000 | 0.00 | 37 | 23.33 | ||||
| 2025-08-11 | 13F | Principal Securities, Inc. | 7,086 | 0.80 | 266 | 51.43 | ||||
| 2025-08-13 | 13F | Northwestern Mutual Wealth Management Co | 3,198 | -42.50 | 120 | -29.17 | ||||
| 2025-08-12 | 13F | American Century Companies Inc | 33,552 | 1,257 | ||||||
| 2025-08-12 | 13F | Atlas Capital Advisors Llc | 9,973 | 16.52 | 374 | 44.02 | ||||
| 2025-08-14 | 13F | Voloridge Investment Management, Llc | 0 | -100.00 | 0 | |||||
| 2025-08-14 | 13F | Treasurer of the State of North Carolina | 47,990 | 2 | ||||||
| 2025-08-07 | NP | CLFFX - Clifford Capital Partners Fund Investor Class | 82,000 | -26.92 | 3,073 | -9.54 | ||||
| 2025-08-14 | 13F | Millennium Management Llc | 382,956 | -51.85 | 14,349 | -40.40 | ||||
| 2025-08-14 | 13F | Ameriprise Financial Inc | 13,188 | 494 | ||||||
| 2025-08-14 | 13F | Schonfeld Strategic Advisors LLC | 18,690 | -38.30 | 700 | -23.58 | ||||
| 2025-08-13 | 13F | Arrowstreet Capital, Limited Partnership | 2,169,951 | -3.49 | 81,308 | 19.47 | ||||
| 2025-08-28 | NP | CPAI - Counterpoint Quantitative Equity ETF | 52,363 | 1,962 | ||||||
| 2025-07-29 | 13F | William Blair Investment Management, Llc | 111,655 | 4,184 | ||||||
| 2025-08-14 | 13F | Southeastern Asset Management Inc/tn/ | 1,037,634 | -48.58 | 38,880 | -36.35 | ||||
| 2025-08-29 | NP | JAKWX - John Hancock Disciplined Value Global Long/Short Fund Class NAV | 85,782 | 3,214 | ||||||
| 2025-07-11 | 13F | Perpetual Ltd | 50,750 | -18.73 | 1,902 | 0.58 | ||||
| 2025-08-08 | 13F | Larson Financial Group LLC | 20 | -90.15 | 1 | -100.00 | ||||
| 2025-08-26 | NP | SBHSX - Segall Bryant & Hamill International Small Cap Fund Retail Class | 14,222 | 0.00 | 533 | 23.72 | ||||
| 2025-08-13 | 13F | MetLife Investment Management, LLC | 1,711 | 64 | ||||||
| 2025-08-07 | 13F | Fourth Sail Capital LP | 0 | -100.00 | 0 | |||||
| 2025-05-05 | 13F | Morningstar Investment Services LLC | 0 | -100.00 | 0 | |||||
| 2025-08-14 | 13F | MIRAE ASSET GLOBAL ETFS HOLDINGS Ltd. | 0 | -100.00 | 0 | |||||
| 2025-07-23 | 13F | Kingswood Wealth Advisors, Llc | 10,067 | 377 | ||||||
| 2025-08-13 | 13F | Hsbc Holdings Plc | 20,876 | 789 | ||||||
| 2025-08-14 | 13F | Scientech Research LLC | 15,001 | 111.25 | 562 | 162.62 | ||||
| 2025-08-08 | 13F | Calamos Advisors LLC | 119,770 | 464.82 | 4,488 | 600.00 | ||||
| 2025-07-28 | NP | TIEUX - International Equity Fund | 13,409 | -5.40 | 503 | 34.95 | ||||
| 2025-08-11 | 13F | Citigroup Inc | 4,870 | 80.24 | 182 | 124.69 | ||||
| 2025-08-18 | 13F | Geneos Wealth Management Inc. | 120 | 4 | ||||||
| 2025-08-07 | 13F | Los Angeles Capital Management Llc | 0 | -100.00 | 0 | |||||
| 2025-05-02 | 13F | Bogart Wealth, LLC | 0 | -100.00 | 0 | -100.00 | ||||
| 2025-08-14 | 13F | Macquarie Group Ltd | 0 | -100.00 | 0 | -100.00 | ||||
| 2025-08-18 | 13F | Wolverine Trading, Llc | Call | 12,500 | 454 | |||||
| 2025-08-27 | NP | ALLIANZ VARIABLE INSURANCE PRODUCTS TRUST - AZL Russell 1000 Value Index Fund Class 2 | 2,294 | 86 | ||||||
| 2025-08-18 | 13F | Wolverine Trading, Llc | Put | 6,500 | 236 | |||||
| 2025-08-14 | 13F | Royal Bank Of Canada | 37,263 | -19.31 | 1,397 | -0.07 | ||||
| 2025-08-14 | 13F | Bnp Paribas Arbitrage, Sa | 94,417 | 376.06 | 3,538 | 489.50 | ||||
| 2025-08-27 | NP | LLGLX - Longleaf Partners Global Fund | 238,202 | -45.35 | 8,925 | -32.35 | ||||
| 2025-08-28 | NP | DODEX - Dodge & Cox Emerging Markets Stock Fund | 217,479 | 145.80 | 8,149 | 204.26 | ||||
| 2025-07-24 | 13F | Ronald Blue Trust, Inc. | 58 | -86.51 | 2 | -84.62 | ||||
| 2025-08-04 | 13F | Assetmark, Inc | 66,329 | 78.97 | 2,485 | 121.68 | ||||
| 2025-08-07 | 13F | Acadian Asset Management Llc | 13,405 | -50.55 | 1 | |||||
| 2025-07-15 | 13F | Public Employees Retirement System Of Ohio | 117,035 | 27.01 | 4,385 | 57.22 | ||||
| 2025-08-14 | 13F | Wellington Management Group Llp | 62,900 | 2,357 | ||||||
| 2025-07-11 | 13F | Farther Finance Advisors, LLC | 237 | 0.00 | 9 | 14.29 | ||||
| 2025-08-01 | 13F | Y-Intercept (Hong Kong) Ltd | 0 | -100.00 | 0 | |||||
| 2025-08-07 | 13F | Connor, Clark & Lunn Investment Management Ltd. | 34,868 | 21.12 | 1,307 | 49.94 | ||||
| 2025-08-14 | 13F | Petrus Trust Company, LTA | 10,128 | -72.26 | 379 | -65.70 | ||||
| 2025-08-11 | 13F | Absolute Gestao de Investimentos Ltda. | 20,862 | 782 | ||||||
| 2025-08-26 | NP | TSWMX - TSW Emerging Markets Fund Advisor Shares | 1,550 | -55.07 | 58 | -44.23 | ||||
| 2025-08-08 | 13F | SG Americas Securities, LLC | 33,443 | 436.38 | 1 | |||||
| 2025-07-30 | 13F | Whittier Trust Co Of Nevada Inc | 15 | 0.00 | 1 | |||||
| 2025-07-23 | 13F | Klp Kapitalforvaltning As | 107,867 | 1.70 | 4,042 | 25.89 | ||||
| 2025-08-14 | 13F | Point72 Asset Management, L.P. | 0 | -100.00 | 0 | |||||
| 2025-08-04 | 13F | Strs Ohio | 61,312 | 2,297 | ||||||
| 2025-08-13 | 13F | SageView Advisory Group, LLC | 9,025 | 0.28 | 356 | 30.88 | ||||
| 2025-08-12 | 13F | Pacer Advisors, Inc. | 1 | 0 | ||||||
| 2025-08-14 | 13F | Two Sigma Investments, Lp | 30,469 | -57.35 | 1,142 | -47.22 | ||||
| 2025-07-17 | 13F | CWA Asset Management Group, LLC | 26,173 | 112.67 | 981 | 163.44 | ||||
| 2025-08-04 | 13F | Emerald Advisers, Llc | 22 | 0.00 | 1 | |||||
| 2025-07-29 | 13F | Nordea Investment Management Ab | 223,326 | -33.49 | 8,348 | -16.38 | ||||
| 2025-07-28 | NP | AVDE - Avantis International Equity ETF This fund is a listed as child fund of American Century Companies Inc and if that institution has disclosed ownership in this security, then these positions will not be double counted when calculating total shares and total value | 29,000 | 1,088 | ||||||
| 2025-08-08 | 13F | Pnc Financial Services Group, Inc. | 607 | 23 | ||||||
| 2025-07-29 | 13F | LB Partners LLC | 402,000 | -22.83 | 15,063 | -5.31 | ||||
| 2025-08-07 | 13F | Beese Fulmer Investment Management, Inc. | 11,803 | -0.69 | 442 | 23.12 | ||||
| 2025-08-13 | 13F | Renaissance Technologies Llc | 810,634 | 454.47 | 30,374 | 586.42 | ||||
| 2025-08-14 | 13F | Wells Fargo & Company/mn | 8,122 | -41.15 | 304 | -27.10 | ||||
| 2025-08-14 | 13F | Qube Research & Technologies Ltd | 1,119,991 | 201.69 | 41,966 | 273.46 | ||||
| 2025-07-17 | 13F | Park Place Capital Corp | 513 | 27.30 | 19 | 58.33 | ||||
| 2025-08-14 | 13F | Quantinno Capital Management LP | 7,344 | 2.03 | 275 | 26.73 | ||||
| 2025-08-12 | 13F | Clifford Capital Partners Llc | 357,985 | -23.56 | 13,414 | -5.38 | ||||
| 2025-08-08 | 13F | KBC Group NV | 14,998 | 95.26 | 1 | |||||
| 2025-08-13 | 13F | Gamco Investors, Inc. Et Al | 783,230 | -7.09 | 29,348 | 15.01 | ||||
| 2025-07-15 | 13F | Fifth Third Bancorp | 2,736 | 0.00 | 103 | 24.39 | ||||
| 2025-05-05 | 13F | Lindbrook Capital, Llc | 468 | 32.58 | 14 | 75.00 | ||||
| 2025-06-27 | NP | PXF - Invesco FTSE RAFI Developed Markets ex-U.S. ETF This fund is a listed as child fund of Invesco Ltd. and if that institution has disclosed ownership in this security, then these positions will not be double counted when calculating total shares and total value | 3,874 | 134 | ||||||
| 2025-08-13 | 13F | Amundi | 74,484 | 34.11 | 2,840 | 67.75 | ||||
| 2025-08-14 | 13F | Verition Fund Management LLC | 76,390 | 10.70 | 2,862 | 37.07 | ||||
| 2025-08-13 | 13F | Options Solutions, Llc | 11,535 | 432 | ||||||
| 2025-08-13 | 13F | Gabelli Funds Llc | 464,700 | -4.85 | 17,412 | 17.78 | ||||
| 2025-08-14 | 13F | PDT Partners, LLC | 180,309 | 79.41 | 6,756 | 122.09 | ||||
| 2025-08-26 | NP | IWB - iShares Russell 1000 ETF | 74,199 | 2,780 | ||||||
| 2025-08-13 | 13F | Bridgewater Associates, LP | 218,800 | 728.69 | 8,198 | 926.03 | ||||
| 2025-08-12 | 13F | Charles Schwab Investment Management Inc | 225,441 | 3.30 | 8,447 | 27.89 | ||||
| 2025-08-12 | 13F | Nuveen, LLC | 455,954 | 407.19 | 17,085 | 527.86 | ||||
| 2025-08-11 | 13F | New Age Alpha Advisors, LLC | 3,840 | 144 | ||||||
| 2025-08-26 | NP | IYZ - iShares U.S. Telecommunications ETF | 365,617 | 13,700 | ||||||
| 2025-08-14 | 13F | Sei Investments Co | 87,433 | 14.44 | 3,276 | 41.70 | ||||
| 2025-08-13 | 13F | New York State Common Retirement Fund | 41,311 | 2 | ||||||
| 2025-08-14 | 13F | California State Teachers Retirement System | 113,655 | 11.99 | 4,259 | 38.65 | ||||
| 2025-08-27 | NP | BBVSX - Bridge Builder Small/Mid Cap Value Fund | 2,848 | 107 | ||||||
| 2025-08-26 | NP | NMIEX - Active M International Equity Fund | 9,858 | 4.32 | 369 | 29.02 | ||||
| 2025-08-26 | NP | GIEYX - INTERNATIONAL EQUITY FUND Institutional | 3,332 | 0.00 | 125 | 24.00 | ||||
| 2025-08-26 | NP | IWD - iShares Russell 1000 Value ETF | 228,423 | 8,559 | ||||||
| 2025-07-31 | 13F | Caitong International Asset Management Co., Ltd | 1,781 | -36.16 | 67 | -21.43 | ||||
| 2025-08-29 | NP | JAJBX - Emerging Markets Value Trust Series I | 129,313 | 107.40 | 4,845 | 156.76 | ||||
| 2025-07-28 | NP | AVDEX - Avantis International Equity Fund Institutional Class This fund is a listed as child fund of American Century Companies Inc and if that institution has disclosed ownership in this security, then these positions will not be double counted when calculating total shares and total value | 2,808 | 105 | ||||||
| 2025-08-14 | 13F/A | Barclays Plc | 2,848,021 | -15.43 | 107 | 4.95 | ||||
| 2025-08-13 | 13F | Polen Capital Management Llc | 18,753 | 703 | ||||||
| 2025-08-27 | NP | LLINX - Longleaf Partners International Fund | 596,227 | -51.03 | 22,341 | -39.38 | ||||
| 2025-08-13 | 13F | Jump Financial, LLC | 55,807 | -58.12 | 2,091 | -48.17 | ||||
| 2025-08-01 | 13F | Teacher Retirement System Of Texas | 44,356 | -4.22 | 1,662 | 18.63 | ||||
| 2025-08-14 | 13F | Militia Capital Partners, LP | 32,582 | 8.61 | 1,221 | 34.36 | ||||
| 2025-08-14 | 13F | Group One Trading, L.p. | 5,062 | 190 | ||||||
| 2025-08-14 | 13F | Citadel Advisors Llc | Call | 0 | -100.00 | 0 | ||||
| 2025-08-14 | 13F | LWM Advisory Services, LLC | 10,638 | 0.00 | 399 | 23.60 | ||||
| 2025-05-14 | 13F | Caitlin John, LLC | 0 | -100.00 | 0 | |||||
| 2025-08-12 | 13F | LPL Financial LLC | 11,765 | 441 | ||||||
| 2025-08-14 | 13F | Man Group plc | 91,632 | 3,433 | 996.81 | |||||
| 2025-08-14 | 13F | Promethos Capital, LLC | 0 | -100.00 | 0 | |||||
| 2025-08-07 | 13F | Campbell & CO Investment Adviser LLC | 20,875 | -61.57 | 782 | -52.43 | ||||
| 2025-08-11 | 13F | Lsv Asset Management | 78,180 | -67.28 | 3 | -71.43 | ||||
| 2025-08-14 | 13F | Fmr Llc | 188 | 261.54 | 7 | 600.00 | ||||
| 2025-08-14 | 13F | Price T Rowe Associates Inc /md/ | 5,827,912 | 4.46 | 218 | 29.76 | ||||
| 2025-07-16 | 13F | Signaturefd, Llc | 1,711 | 16.32 | 64 | 45.45 | ||||
| 2025-08-14 | 13F | Susquehanna Portfolio Strategies, LLC | 20,275 | 760 | ||||||
| 2025-08-26 | NP | BISAX - BRANDES INTERNATIONAL SMALL CAP EQUITY FUND Class A | 989,642 | 27.42 | 37,082 | 57.73 | ||||
| 2025-08-18 | 13F/A | Nomura Holdings Inc | 80,134 | -56.69 | 3,003 | -46.39 | ||||
| 2025-08-19 | 13F | Cape Investment Advisory, Inc. | 452 | 20.53 | 17 | 45.45 | ||||
| 2025-08-14 | 13F | Raymond James Financial Inc | 652 | 24 | ||||||
| 2025-08-28 | NP | QCSTRX - Stock Account Class R1 | 244,687 | 172.18 | 9,168 | 236.93 | ||||
| 2025-07-21 | 13F | Hennessy Advisors Inc | 299,900 | 11,237 | ||||||
| 2025-08-13 | 13F | Russell Investments Group, Ltd. | 26,847 | 6.76 | 1,006 | 32.06 | ||||
| 2025-08-05 | 13F | Bank of New York Mellon Corp | 234,259 | 527.65 | 8,778 | 677.41 | ||||
| 2025-08-14 | 13F | Park West Asset Management LLC | 1,377,477 | -8.84 | 51,614 | 12.85 | ||||
| 2025-08-27 | NP | THRIVENT SERIES FUND INC - Thrivent International Allocation Portfolio Class A | 5,427 | 203 | ||||||
| 2025-08-14 | 13F | State Street Corp | 1,820,070 | 129.23 | 68,198 | 183.76 | ||||
| 2025-08-25 | 13F/A | Neuberger Berman Group LLC | 29,232 | 1,095 | ||||||
| 2025-08-08 | 13F | Itau Unibanco Holding S.A. | 703,267 | 52.65 | 13,912 | 106,915.38 | ||||
| 2025-08-13 | 13F | Cerity Partners LLC | 10,743 | -4.15 | 403 | 18.58 | ||||
| 2025-08-08 | 13F | Geode Capital Management, Llc | 767,464 | 228.44 | 28,751 | 306.53 | ||||
| 2025-08-14 | 13F | Mariner, LLC | 35,848 | 21.49 | 1,343 | 50.39 | ||||
| 2025-07-08 | 13F | Parallel Advisors, LLC | 47 | 0.00 | 2 | 0.00 | ||||
| 2025-08-11 | 13F | Bell Investment Advisors, Inc | 324 | 12 | ||||||
| 2025-08-14 | 13F | Susquehanna Fundamental Investments, Llc | 17,650 | 0.00 | 661 | 23.78 | ||||
| 2025-08-12 | 13F | Coldstream Capital Management Inc | 0 | -100.00 | 0 | |||||
| 2025-08-08 | 13F | North of South Capital LLP | 52,881 | 17.82 | 1,981 | 45.88 | ||||
| 2025-08-11 | 13F | ARS Investment Partners, LLC | 7,000 | 262 | ||||||
| 2025-08-07 | 13F | Hosking Partners LLP | 518,521 | -2.39 | 19,429 | 20.83 | ||||
| 2025-08-25 | NP | LDVCX - AXS Thomson Reuters Venture Capital Return Tracker Fund Class C Shares | 63 | 2 | ||||||
| 2025-08-13 | 13F | Quadrant Capital Group Llc | 0 | -100.00 | 0 | |||||
| 2025-07-14 | 13F | Counterpoint Mutual Funds LLC | 52,363 | 1,962 | ||||||
| 2025-07-17 | 13F | Janney Montgomery Scott LLC | 10,805 | 0 | ||||||
| 2025-06-27 | NP | COLO - Global X MSCI Colombia ETF This fund is a listed as child fund of Mirae Asset Global Investments Co., Ltd. and if that institution has disclosed ownership in this security, then these positions will not be double counted when calculating total shares and total value | 75,799 | 2,618 | ||||||
| 2025-08-13 | 13F | Dodge & Cox | 8,836,132 | 1.54 | 331,090 | 25.70 | ||||
| 2025-07-08 | 13F | Nbc Securities, Inc. | 3,661 | 0 | ||||||
| 2025-08-26 | NP | NORTHERN FUNDS - U.S. Quality ESG Fund Class I | 21,414 | 802 | ||||||
| 2025-07-25 | 13F | RHS Financial, LLC | 7,416 | 278 | ||||||
| 2025-08-01 | 13F | Envestnet Asset Management Inc | 127,577 | -4.60 | 4,780 | 18.08 | ||||
| 2025-05-29 | NP | JAKVX - John Hancock Disciplined Value Global Long/Short Fund Class R6 | 32,082 | 971 | ||||||
| 2025-07-22 | 13F | Gsa Capital Partners Llp | 43,382 | -20.31 | 2 | 0.00 | ||||
| 2025-07-23 | 13F | Triasima Portfolio Management inc. | 91,505 | 3,429 | ||||||
| 2025-05-15 | 13F | Occudo Quantitative Strategies Lp | 0 | -100.00 | 0 | |||||
| 2025-08-27 | NP | BBVLX - Bridge Builder Large Cap Value Fund | 4,407 | 165 | ||||||
| 2025-08-28 | NP | TIAA SEPARATE ACCOUNT VA 1 - Stock Index Account Teachers Personal Annuity Individual Deferred Variable Annuity | 2,245 | 84 | ||||||
| 2025-08-11 | 13F | One Capital Management, LLC | 27,876 | 1,045 | ||||||
| 2025-07-25 | 13F | JustInvest LLC | 32,334 | 17.60 | 1,212 | 45.55 | ||||
| 2025-08-13 | 13F | GABELLI & Co INVESTMENT ADVISERS, INC. | 6,000 | 225 | ||||||
| 2025-08-06 | 13F | Commonwealth Equity Services, Llc | 14,005 | 6.22 | 1 | |||||
| 2025-08-12 | 13F | Dynamic Technology Lab Private Ltd | 11,000 | 412 | ||||||
| 2025-08-14 | 13F | Twinbeech Capital Lp | 93,981 | 3,521 | ||||||
| 2025-08-14 | 13F | Mml Investors Services, Llc | 20,067 | 19.70 | 1 | |||||
| 2025-08-13 | 13F | Quantbot Technologies LP | 0 | -100.00 | 0 | |||||
| 2025-07-10 | 13F | Swedbank AB | 2,540,158 | -10.50 | 95,180 | 10.79 | ||||
| 2025-07-14 | 13F | UMA Financial Services, Inc. | 29 | 0.00 | 1 | |||||
| 2025-07-16 | 13F | ORG Partners LLC | 90 | 3 | ||||||
| 2025-08-14 | 13F | Shay Capital LLC | 0 | -100.00 | 0 | -100.00 | ||||
| 2025-08-12 | 13F | Franklin Resources Inc | 34,501 | 1,293 | ||||||
| 2025-08-08 | 13F | Crossmark Global Holdings, Inc. | 139,900 | 5,242 | ||||||
| 2025-08-13 | 13F | Brandes Investment Partners, Lp | 6,624,718 | 2.50 | 248,228 | 26.89 | ||||
| 2025-07-29 | NP | FFND - The Future Fund Active ETF | 16,139 | 18.30 | 605 | 68.99 | ||||
| 2025-08-14 | 13F | Prelude Capital Management, Llc | 0 | -100.00 | 0 | |||||
| 2025-08-14 | 13F | Aqr Capital Management Llc | 12,881 | 34.36 | 483 | 66.21 | ||||
| 2025-08-11 | 13F | Inspire Advisors, LLC | 16,633 | 623 | ||||||
| 2025-08-13 | 13F | Jones Financial Companies Lllp | 1,228 | -80.62 | 45 | -76.96 | ||||
| 2025-08-08 | 13F | SBI Securities Co., Ltd. | 10 | -82.76 | 0 | -100.00 | ||||
| 2025-08-11 | 13F | Empirical Finance, LLC | 8,921 | 334 | ||||||
| 2025-08-08 | 13F | Jupiter Asset Management Ltd | 187,352 | -20.40 | 7,020 | -1.46 | ||||
| 2025-08-12 | 13F | Deutsche Bank Ag\ | 869,184 | 29.06 | 32,568 | 59.76 | ||||
| 2025-09-04 | 13F/A | Advisor Group Holdings, Inc. | 5,973 | 1,981.18 | 216 | 2,600.00 | ||||
| 2025-08-14 | 13F | GWM Advisors LLC | 772 | 0.00 | 29 | 21.74 | ||||
| 2025-08-13 | 13F | Skandinaviska Enskilda Banken AB (publ) | 153,816 | -15.89 | 5,763 | 4.12 | ||||
| 2025-08-04 | 13F | Amalgamated Bank | 5,861 | 0 | ||||||
| 2025-08-12 | 13F | XTX Topco Ltd | 0 | -100.00 | 0 | |||||
| 2025-08-14 | 13F | Winton Capital Group Ltd | 7,023 | 263 | ||||||
| 2025-08-14 | 13F | Alliancebernstein L.p. | 48,161 | 75.76 | 1,805 | 117.61 | ||||
| 2025-07-28 | NP | AVSD - Avantis Responsible International Equity ETF | 1,744 | 65 | ||||||
| 2025-07-10 | 13F | TT International Asset Management LTD | 34,515 | 696.19 | 3,582 | 1,174.38 | ||||
| 2025-08-12 | 13F | Global Retirement Partners, LLC | 325 | 12 | ||||||
| 2025-08-08 | 13F | Vestcor Inc | 102,260 | 4 | ||||||
| 2025-08-14 | 13F | Principal Street Partners, LLC | 11,886 | 445 | ||||||
| 2025-08-15 | 13F | WealthCollab, LLC | 143 | 0.00 | 5 | 25.00 | ||||
| 2025-08-28 | NP | DODFX - Dodge & Cox International Stock Fund | 8,247,010 | 0.00 | 309,015 | 23.79 | ||||
| 2025-08-12 | 13F | Swiss National Bank | 198,422 | -1.39 | 7,435 | 22.07 |
Other Listings
| DE:M4M1 | € 40.60 |