Mga Batayang Estadistika
| Pemilik Institusional | 346 total, 346 long only, 0 short only, 0 long/short - change of -4.16% MRQ |
| Alokasi Portofolio Rata-rata | 0.6745 % - change of -7.05% MRQ |
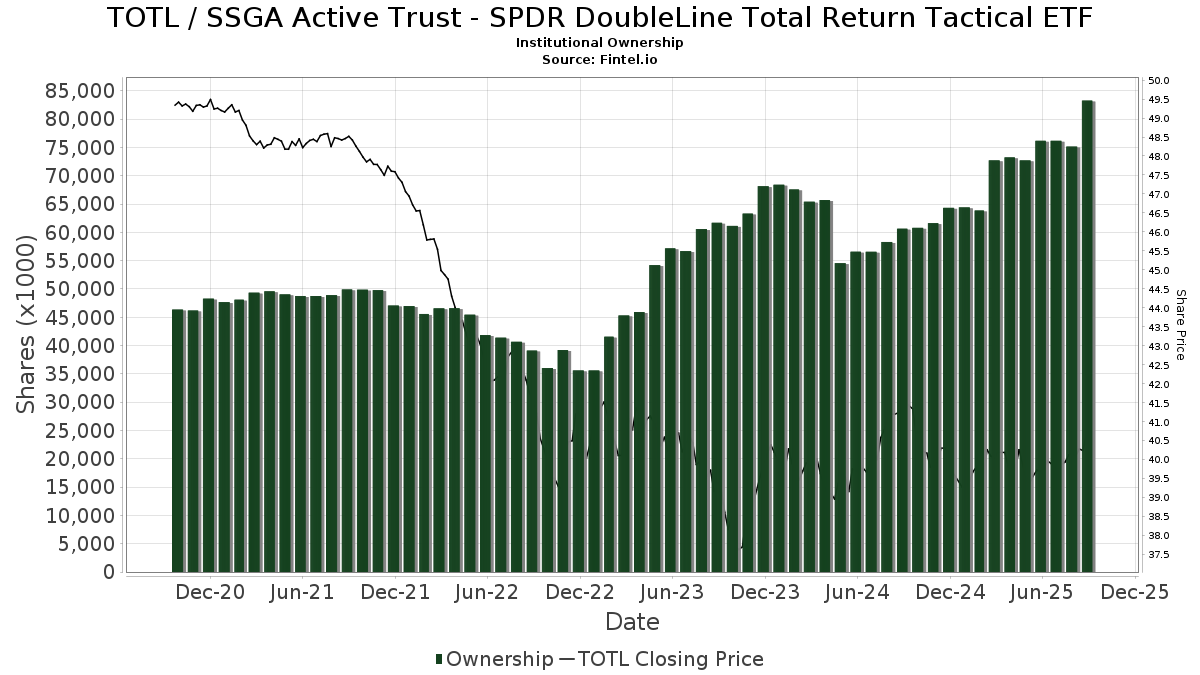
| Saham Institusional (Jangka Panjang) | 83,287,905 (ex 13D/G) - change of 7.11MM shares 9.33% MRQ |
| Nilai Institusional (Jangka Panjang) | $ 3,129,430 USD ($1000) |
Kepemilikan Institusional dan Pemegang Saham
SSGA Active Trust - SPDR DoubleLine Total Return Tactical ETF (US:TOTL) memiliki 346 pemilik institusional dan pemegang saham yang telah mengajukan formulir 13D/G atau 13F kepada Komisi Bursa Efek (Securities Exchange Commission/SEC). Lembaga-lembaga ini memegang total 83,287,905 saham. Pemegang saham terbesar meliputi Fmr Llc, FPCIX - Strategic Advisers Core Income Fund, Morgan Stanley, Signature Estate & Investment Advisors Llc, Envestnet Asset Management Inc, Cwm, Llc, LPL Financial LLC, Wealth Enhancement Advisory Services, Llc, Tectonic Advisors Llc, and Bank Of America Corp /de/ .
Struktur kepemilikan institusional SSGA Active Trust - SPDR DoubleLine Total Return Tactical ETF (ARCA:TOTL) menunjukkan posisi terkini di perusahaan oleh institusi dan dana, serta perubahan terbaru dalam ukuran posisi. Pemegang saham utama dapat mencakup investor individu, reksa dana, dana lindung nilai, atau institusi. Jadwal 13D menunjukkan bahwa investor memegang (atau pernah memegang) lebih dari 5% saham perusahaan dan bermaksud (atau pernah bermaksud) untuk secara aktif mengejar perubahan strategi bisnis. Jadwal 13G menunjukkan investasi pasif lebih dari 5%.
The share price as of September 5, 2025 is 40.53 / share. Previously, on September 9, 2024, the share price was 41.41 / share. This represents a decline of 2.13% over that period.
Skor Sentimen Dana
Skor Sentimen Dana (sebelumnya dikenal sebagai Skor Akumulasi Kepemilikan) menemukan saham-saham yang paling banyak dibeli oleh dana. Ini adalah hasil dari model kuantitatif multi-faktor yang canggih yang mengidentifikasi perusahaan dengan tingkat akumulasi institusional tertinggi. Model penilaian menggunakan kombinasi dari total peningkatan pemilik yang diungkapkan, perubahan dalam alokasi portofolio pada pemilik tersebut, dan metrik lainnya. Angka berkisar dari 0 hingga 100, dengan angka yang lebih tinggi menunjukkan tingkat akumulasi yang lebih tinggi dibandingkan dengan perusahaan sejenisnya, dan 50 adalah rata-ratanya.
Frekuensi Pembaruan: Setiap Hari
Lihat Ownership Explorer, yang menyediakan daftar perusahaan dengan peringkat tertinggi.
Rasio Put/Call Institusional
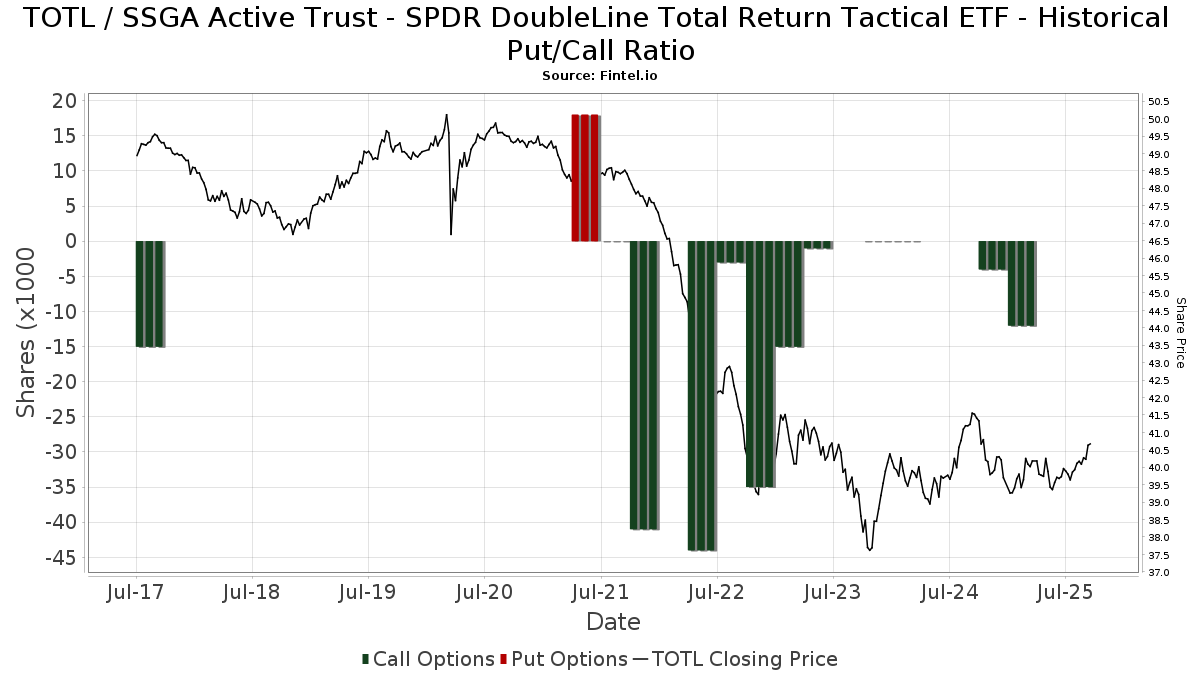
Selain melaporkan isu ekuitas dan utang standar, institusi dengan aset di bawah manajemen lebih dari 100 juta dolar AS juga harus mengungkapkan kepemilikan opsi put dan call mereka. Karena opsi put umumnya menunjukkan sentimen negatif, dan opsi call menunjukkan sentimen positif, kita dapat mengetahui sentimen institusional secara keseluruhan dengan memplot rasio put terhadap call. Grafik di sebelah kanan memplot rasio put/call historis untuk instrumen ini.
Menggunakan Rasio Put/Call sebagai indikator sentimen investor mengatasi salah satu kekurangan utama dari penggunaan total kepemilikan institusional, yaitu sejumlah besar aset yang dikelola diinvestasikan secara pasif untuk melacak indeks. Dana yang dikelola secara pasif biasanya tidak membeli opsi, sehingga indikator rasio put/call lebih akurat dalam melacak sentimen dana yang dikelola secara aktif.
Pengajuan 13D/G
Kami menyajikan pengajuan 13D/G secara terpisah dari pengajuan 13F karena perlakuan yang berbeda oleh SEC. Pengajuan 13D/G dapat diajukan oleh kelompok investor (dengan satu pemimpin), sedangkan pengajuan 13F tidak bisa. Hal ini mengakibatkan situasi di mana seorang investor dapat mengajukan 13D/G yang melaporkan satu nilai untuk total saham (mewakili semua saham yang dimiliki oleh kelompok investor), tetapi kemudian mengajukan 13F yang melaporkan nilai yang berbeda untuk total saham (mewakili kepemilikan mereka sendiri). Ini berarti bahwa kepemilikan saham dari pengajuan 13D/G dan pengajuan 13F seringkali tidak dapat dibandingkan secara langsung, sehingga kami menyajikannya secara terpisah.
Catatan: Mulai 16 Mei 2021, kami tidak lagi menampilkan pemilik yang belum mengajukan 13D/G dalam setahun terakhir. Sebelumnya, kami menampilkan riwayat lengkap pengajuan 13D/G. Secara umum, entitas yang diwajibkan untuk mengajukan pengajuan 13D/G harus mengajukan setidaknya setiap tahun sebelum mengirimkan pengajuan penutupan. Namun, terkadang dana keluar dari posisi tanpa mengirimkan pengajuan penutupan (misalnya, mereka menghentikan operasi), sehingga menampilkan riwayat lengkap terkadang menyebabkan kebingungan tentang kepemilikan saat ini. Untuk mencegah kebingungan, kami sekarang hanya menampilkan pemilik 'saat ini' - yaitu - pemilik yang telah mengajukan dalam setahun terakhir.
Upgrade to unlock premium data.
Pengajuan 13F dan NPORT
Detail pada pengajuan 13F tersedia gratis. Detail pada pengajuan NP memerlukan keanggotaan premium. Baris berwarna hijau menunjukkan posisi baru. Baris berwarna merah menunjukkan posisi yang sudah ditutup. Klik tautan ini ikon untuk melihat riwayat transaksi selengkapnya.
Tingkatkan
untuk membuka data premium dan mengekspor ke Excel ![]() .
.
| Tanggal File | Sumber | Investor | Ketik | Presyo ng Avg (Silangan) |
Saham | Δ Saham (%) |
Dilaporkan Nilai ($1000) |
Nilai Δ (%) |
Alokasi Port (%) |
|
|---|---|---|---|---|---|---|---|---|---|---|
| 2025-07-11 | 13F | Pinnacle Bancorp, Inc. | 1,547 | 0.00 | 62 | 0.00 | ||||
| 2025-07-21 | 13F | Ameriflex Group, Inc. | 668 | -92.38 | 27 | -92.63 | ||||
| 2025-07-30 | 13F | Lionsbridge Wealth Management LLC | 59,818 | 75.53 | 2,399 | 76.92 | ||||
| 2025-08-14 | 13F | Colony Group, LLC | 334,622 | 16.15 | 13,422 | 15.63 | ||||
| 2025-07-17 | 13F | Janney Capital Management LLC | 721,102 | -1.70 | 29 | -3.45 | ||||
| 2025-08-05 | 13F | Lifeworks Advisors, LLC | 37,004 | -5.76 | 1,484 | -6.19 | ||||
| 2025-08-11 | 13F | Rothschild Investment Llc | 85 | 0.00 | 3 | 0.00 | ||||
| 2025-07-07 | 13F | Capital Asset Advisory Services LLC | 66,467 | -3.74 | 2,653 | -4.40 | ||||
| 2025-04-22 | 13F | Synergy Financial Management, LLC | 0 | -100.00 | 0 | |||||
| 2025-07-17 | 13F | PMG Wealth Management, Inc. | 116,656 | 8.78 | 4,659 | 8.30 | ||||
| 2025-07-24 | 13F | Capital Advisors, Ltd. LLC | 16,445 | 139.51 | 1 | |||||
| 2025-08-05 | 13F | Pointe Capital Management LLC | 30,890 | 1.96 | 1,239 | 1.48 | ||||
| 2025-08-06 | 13F | Golden State Wealth Management, LLC | 68 | 0.00 | 3 | 0.00 | ||||
| 2025-08-08 | 13F | Advyzon Investment Management, LLC | 36,126 | -8.01 | 1,449 | -8.41 | ||||
| 2025-07-24 | 13F | Blue Zone Wealth Advisors, LLC | 11,528 | 6.26 | 462 | 5.72 | ||||
| 2025-08-15 | 13F | Kestra Advisory Services, LLC | 470,400 | 2.25 | 18,868 | 1.79 | ||||
| 2025-08-21 | 13F | Aveo Capital Partners, LLC | 0 | -100.00 | 0 | |||||
| 2025-07-07 | 13F | Investors Research Corp | 822 | 0.00 | 33 | -3.03 | ||||
| 2025-08-14 | 13F | Peapack Gladstone Financial Corp | 0 | -100.00 | 0 | |||||
| 2025-07-17 | 13F | HB Wealth Management, LLC | 151,661 | -57.18 | 6,083 | -57.37 | ||||
| 2025-07-18 | 13F | Vicus Capital | 287,942 | 3.52 | 11,549 | 3.05 | ||||
| 2025-07-25 | 13F | Envestnet Portfolio Solutions, Inc. | 334,266 | -8.45 | 13,407 | -8.86 | ||||
| 2025-08-12 | 13F | LPL Financial LLC | 3,196,045 | 4.60 | 128,193 | 4.13 | ||||
| 2025-08-14 | 13F | Qube Research & Technologies Ltd | 4,780 | 192 | ||||||
| 2025-08-14 | 13F | Bank Of America Corp /de/ | 2,142,734 | 1.67 | 85,945 | 1.21 | ||||
| 2025-08-13 | 13F | Continuum Advisory, LLC | 10,758 | 0.96 | 432 | 0.47 | ||||
| 2025-08-08 | 13F | Avantax Advisory Services, Inc. | 45,039 | 8.29 | 1,806 | 7.82 | ||||
| 2025-07-30 | 13F | Red Crane Wealth Management, Llc | 0 | -100.00 | 0 | |||||
| 2025-04-09 | 13F | Hummer Financial Advisory Services Inc | 0 | -100.00 | 0 | |||||
| 2025-08-15 | 13F | CI Private Wealth, LLC | 1,066,818 | 159.52 | 42,790 | 158.36 | ||||
| 2025-08-08 | 13F | Collaborative Wealth Managment Inc. | 12,690 | -3.50 | 509 | -3.78 | ||||
| 2025-08-15 | 13F | First Heartland Consultants, Inc. | 5,274 | 212 | ||||||
| 2025-07-10 | 13F | Global Financial Private Client, LLC | 0 | -100.00 | 0 | |||||
| 2025-08-12 | 13F | Absolute Capital Management, LLC | 0 | -100.00 | 0 | |||||
| 2025-08-29 | NP | AIIFX - Timber Point Alternative Income Fund Institutional Class Shares | 75,000 | -16.67 | 3,008 | -17.04 | ||||
| 2025-07-24 | 13F | IFP Advisors, Inc | 6,000 | 4.77 | 241 | 4.35 | ||||
| 2025-07-25 | 13F | Cwm, Llc | 3,372,540 | 14.78 | 135 | 14.41 | ||||
| 2025-08-27 | 13F | Barnes Wealth Management Group, Inc | 10,550 | 0.28 | 423 | 0.00 | ||||
| 2025-04-23 | 13F | Mascagni Wealth Management, Inc. | 0 | -100.00 | 0 | -100.00 | ||||
| 2025-08-14 | 13F | Prestige Wealth Management Group LLC | 3,740 | 0.00 | 150 | 0.00 | ||||
| 2025-07-24 | NP | AIHAX - Horizon Active Income Fund Advisor Class | 795,632 | 23.41 | 31,610 | 21.46 | ||||
| 2025-08-07 | 13F | CENTRAL TRUST Co | 0 | -100.00 | 0 | |||||
| 2025-08-26 | 13F/A | Thrivent Financial For Lutherans | 49,777 | -92.59 | 2 | -96.15 | ||||
| 2025-07-28 | 13F | BRYN MAWR TRUST Co | 4,514 | -3.32 | 181 | -3.72 | ||||
| 2025-08-11 | 13F | Diversified Portfolios, Inc. | 160,502 | 47.64 | 6,438 | 46.96 | ||||
| 2025-08-14 | 13F | Royal Bank Of Canada | 976,994 | 2.37 | 39,188 | 1.91 | ||||
| 2025-08-14 | 13F | Smartleaf Asset Management LLC | 87,737 | -4.48 | 3,508 | -5.06 | ||||
| 2025-07-17 | 13F | Worth Financial Advisory Group, LLC | 0 | -100.00 | 0 | |||||
| 2025-08-12 | 13F | Steward Partners Investment Advisory, Llc | 281,691 | 16.01 | 11,299 | 15.50 | ||||
| 2025-08-14 | 13F | Transamerica Financial Advisors, Inc. | 114,737 | -2.23 | 4,602 | 114,950.00 | ||||
| 2025-05-12 | 13F | C2P Capital Advisory Group, LLC d.b.a. Prosperity Capital Advisors | 0 | -100.00 | 0 | -100.00 | ||||
| 2025-07-22 | 13F | Valley National Advisers Inc | 4,982 | -23.13 | 0 | |||||
| 2025-08-14 | 13F | Williams Jones Wealth Management, LLC. | 13,375 | 0.00 | 536 | -0.37 | ||||
| 2025-05-12 | 13F | Townsquare Capital Llc | 0 | -100.00 | 0 | |||||
| 2025-07-11 | 13F | Farther Finance Advisors, LLC | 20,806 | -10.37 | 835 | -10.52 | ||||
| 2025-08-13 | 13F | Flow Traders U.s. Llc | 22,846 | 1 | ||||||
| 2025-08-07 | 13F | Summit Asset Management, LLC | 169,644 | 0.40 | 6,804 | -0.06 | ||||
| 2025-08-04 | 13F | Leeward Financial Partners, LLC | 59,517 | 9.37 | 2,387 | 8.90 | ||||
| 2025-05-05 | 13F | Montag A & Associates Inc | 0 | -100.00 | 0 | |||||
| 2025-08-06 | 13F | North Capital, Inc. | 1,603 | 0.00 | 64 | 0.00 | ||||
| 2025-08-13 | 13F | Tranquilli Financial Advisor LLC | 40,875 | 1.81 | 1,639 | 1.36 | ||||
| 2025-07-31 | 13F | Glass Jacobson Investment Advisors llc | 0 | -100.00 | 0 | |||||
| 2025-08-12 | 13F | Forum Private Client Group LLC | 0 | -100.00 | 0 | |||||
| 2025-04-22 | 13F | Castleview Partners, Llc | 0 | -100.00 | 0 | |||||
| 2025-07-16 | 13F | Beaumont Financial Advisors, LLC | 9,284 | -40.67 | 372 | -40.95 | ||||
| 2025-08-11 | 13F | Anfield Capital Management, LLC | 404 | 0.00 | 16 | 0.00 | ||||
| 2025-08-06 | 13F | First Horizon Advisors, Inc. | 250 | 1.21 | 10 | 11.11 | ||||
| 2025-08-14 | 13F | Money Concepts Capital Corp | 7,413 | -3.90 | 297 | -4.19 | ||||
| 2025-05-06 | 13F | Fpc Investment Advisory, Inc. | 0 | -100.00 | 0 | |||||
| 2025-04-24 | 13F | Reston Wealth Management Llc | 0 | -100.00 | 0 | -100.00 | ||||
| 2025-05-01 | 13F | Auour Investments LLC | 0 | -100.00 | 0 | |||||
| 2025-08-14 | 13F | Freedom Financial Partners LLC | 121,684 | 3.73 | 4,881 | 3.26 | ||||
| 2025-08-11 | 13F | Morling Financial Advisors, LLC | 893,262 | -1.95 | 35,829 | -2.39 | ||||
| 2025-04-30 | 13F | Sofos Investments, Inc. | 28 | -99.25 | 1 | -99.33 | ||||
| 2025-08-14 | 13F | Stifel Financial Corp | 78,670 | 18.29 | 3,155 | 17.77 | ||||
| 2025-07-15 | 13F | DKM Wealth Management, Inc. | 6,076 | 0.00 | 244 | -0.41 | ||||
| 2025-08-12 | 13F | AlphaCore Capital LLC | 104,146 | 4,177 | ||||||
| 2025-08-12 | 13F | Jaffetilchin Investment Partners, LLC | 131,414 | 41.02 | 5,271 | 40.41 | ||||
| 2025-08-12 | 13F | Jpmorgan Chase & Co | 12,803 | 9.83 | 514 | 9.38 | ||||
| 2025-05-12 | 13F | Independent Advisor Alliance | 0 | -100.00 | 0 | |||||
| 2025-07-25 | 13F | Gw Henssler & Associates Ltd | 5,811 | 0.00 | 233 | -0.43 | ||||
| 2025-08-06 | 13F | AE Wealth Management LLC | 261 | -9.38 | 10 | -9.09 | ||||
| 2025-08-11 | 13F | Eq Llc | 14,506 | -28.50 | 582 | -28.89 | ||||
| 2025-08-13 | 13F | Gateway Wealth Partners, LLC | 8,114 | -82.03 | 325 | -82.13 | ||||
| 2025-08-14 | 13F | Betterment LLC | 5,497 | -6.39 | 0 | |||||
| 2025-08-11 | 13F | Aptus Capital Advisors, LLC | 467 | 0.00 | 19 | 0.00 | ||||
| 2025-08-14 | 13F | Two Sigma Securities, Llc | 5,847 | 235 | ||||||
| 2025-08-14 | 13F | GWM Advisors LLC | 230,540 | 13.55 | 9,247 | 13.03 | ||||
| 2025-07-24 | 13F | Galvin, Gaustad & Stein, LLC | 0 | -100.00 | 0 | |||||
| 2025-08-13 | 13F | All Terrain Financial Advisors, LLC | 53,234 | 5.11 | 2,135 | 4.66 | ||||
| 2025-07-16 | 13F | John W. Brooker & Co., CPAs | 69,915 | -50.66 | 2,783 | -51.25 | ||||
| 2025-08-05 | 13F | Westside Investment Management, Inc. | 4,800 | 0.00 | 193 | -0.52 | ||||
| 2025-08-14 | 13F | Vista Private Wealth Partners. LLC | 397,767 | 7.65 | 15,954 | 7.17 | ||||
| 2025-07-16 | 13F | Paragon Capital Management Ltd | 13,969 | -47.95 | 560 | -48.20 | ||||
| 2025-07-31 | 13F | Carlton Hofferkamp & Jenks Wealth Management, LLC | 19,465 | -8.27 | 777 | -7.83 | ||||
| 2025-08-12 | 13F | SRS Capital Advisors, Inc. | 179 | 0.00 | 7 | 0.00 | ||||
| 2025-07-17 | 13F | Paradigm Financial Partners, Llc | 151,732 | -0.91 | 6,086 | -1.36 | ||||
| 2025-08-06 | 13F | Entrewealth, Llc | 65,148 | -16.63 | 2,613 | -16.99 | ||||
| 2025-04-29 | 13F | Callan Capital, LLC | 100,626 | 5.14 | 4,054 | 7.56 | ||||
| 2025-08-13 | 13F | VestGen Advisors, LLC | 33,319 | 31.70 | 1,336 | 31.11 | ||||
| 2025-07-18 | 13F | Heritage Financial Services, LLC | 10,521 | -6.49 | 422 | -7.06 | ||||
| 2025-08-13 | 13F | EverSource Wealth Advisors, LLC | 12,891 | 0.02 | 517 | -0.39 | ||||
| 2025-07-30 | 13F | Dudley Capital Management, Llc | 24,010 | 0.00 | 963 | -0.41 | ||||
| 2025-08-14 | 13F | Diversify Advisory Services, LLC | 9,737 | 0.17 | 390 | -0.26 | ||||
| 2025-05-08 | 13F | Essential Planning, LLC. | 0 | -100.00 | 0 | |||||
| 2025-07-14 | 13F | Stapp Wealth Management, Pllc | 203,592 | 2.74 | 8,166 | 2.29 | ||||
| 2025-04-15 | 13F | Kozak & Associates, Inc. | 0 | -100.00 | 0 | -100.00 | ||||
| 2025-08-14 | 13F | Jane Street Group, Llc | 796,280 | 31,939 | ||||||
| 2025-07-31 | 13F | Washington Trust Advisors, Inc. | 795 | 0.00 | 32 | -3.12 | ||||
| 2025-08-08 | 13F | Citizens Financial Group Inc/ri | 10,732 | 24.99 | 430 | 24.64 | ||||
| 2025-08-14 | 13F | Glen Eagle Advisors, LLC | 46,442 | 1.60 | 1,863 | 1.14 | ||||
| 2025-05-15 | 13F | Stonehaven Wealth & Tax Solutions, Llc | 0 | -100.00 | 0 | |||||
| 2025-07-16 | 13F | Colton Groome Financial Advisors, Llc | 7,966 | 10.98 | 320 | 10.76 | ||||
| 2025-07-23 | 13F | BankPlus Trust Department | 28 | 0.00 | 1 | 0.00 | ||||
| 2025-07-14 | 13F | Pacifica Partners Inc. | 1,385 | 0.22 | 55 | 0.00 | ||||
| 2025-08-11 | 13F | Private Advisor Group, LLC | 244,264 | 3.30 | 9,797 | 2.84 | ||||
| 2025-08-14 | 13F | Financial Strategies Group, Inc. | 7,970 | -2.23 | 316 | -2.17 | ||||
| 2025-08-04 | 13F | Northwest Financial Advisors | 14,098 | 8.05 | 565 | 7.62 | ||||
| 2025-08-08 | 13F | Bouchey Financial Group Ltd | 39,888 | -3.18 | 1,600 | -3.62 | ||||
| 2025-08-14 | 13F | Aqr Capital Management Llc | 118,292 | 116.00 | 4,745 | 115.05 | ||||
| 2025-08-12 | 13F | Coldstream Capital Management Inc | 0 | -100.00 | 0 | |||||
| 2025-07-17 | 13F | SeaBridge Investment Advisors LLC | 102,426 | 26.38 | 4,108 | 25.82 | ||||
| 2025-08-11 | 13F | Tidemark, LLC | 921 | -14.17 | 37 | -16.28 | ||||
| 2025-08-04 | 13F | Atria Investments Llc | 8,271 | 53.74 | 332 | 53.24 | ||||
| 2025-08-06 | 13F | Commonwealth Equity Services, Llc | 108,622 | 0.46 | 4 | 0.00 | ||||
| 2025-08-11 | 13F | Perennial Investment Advisors, LLC | 24,526 | -4.33 | 984 | -4.75 | ||||
| 2025-07-28 | 13F | Elmwood Wealth Management, Inc. | 150,129 | 0.37 | 6,022 | -0.08 | ||||
| 2025-07-30 | NP | FPCIX - Strategic Advisers Core Income Fund This fund is a listed as child fund of Fmr Llc and if that institution has disclosed ownership in this security, then these positions will not be double counted when calculating total shares and total value | 10,668,758 | 70.63 | 423,870 | 67.93 | ||||
| 2025-08-13 | 13F | Renaissance Technologies Llc | 19,445 | 3.98 | 780 | 3.45 | ||||
| 2025-08-14 | 13F | First Foundation Advisors | 25,362 | 104.02 | 1,017 | 103.40 | ||||
| 2025-05-01 | 13F | New England Professional Planning Group Inc. | 0 | -100.00 | 0 | |||||
| 2025-07-23 | 13F | Peak Financial Management, Inc. | 36,837 | -4.19 | 1,478 | -4.65 | ||||
| 2025-08-05 | 13F | Bank of New York Mellon Corp | 1,572,014 | 2.08 | 63,053 | 1.63 | ||||
| 2025-08-11 | 13F | M Wealth Management, LLC | 269,259 | -0.73 | 10,800 | -1.18 | ||||
| 2025-08-01 | 13F | Envestnet Asset Management Inc | 3,571,048 | -0.16 | 143,235 | -0.61 | ||||
| 2025-07-28 | 13F | Axxcess Wealth Management, Llc | 82,690 | -4.62 | 3,317 | -5.07 | ||||
| 2025-08-15 | 13F | Equitable Holdings, Inc. | 43,471 | -5.74 | 1,744 | -6.19 | ||||
| 2025-04-14 | 13F | Priebe Wealth Holdings LLC | 0 | -100.00 | 0 | |||||
| 2025-07-09 | 13F | Westmount Partners, LLC | 11,145 | -6.58 | 447 | -6.87 | ||||
| 2025-07-29 | 13F | Private Wealth Management Group, LLC | 0 | -100.00 | 0 | |||||
| 2025-07-31 | 13F | Moloney Securities Asset Management, LLC | 0 | -100.00 | 0 | |||||
| 2025-07-11 | 13F | SILVER OAK SECURITIES, Inc | 37,157 | 24.76 | 1,490 | 24.48 | ||||
| 2025-07-25 | 13F | Endowment Wealth Management, Inc. | 8,780 | 10.51 | 352 | 10.00 | ||||
| 2025-07-15 | 13F | BCS Wealth Management | 21,798 | -38.26 | 1 | -100.00 | ||||
| 2025-08-08 | 13F | Financial Gravity Companies, Inc. | 14 | -50.00 | 1 | -100.00 | ||||
| 2025-08-13 | 13F | Capital Analysts, Inc. | 69,947 | 40.37 | 3 | 0.00 | ||||
| 2025-08-18 | 13F | Geneos Wealth Management Inc. | 66,608 | 5.88 | 2,672 | 5.41 | ||||
| 2025-07-18 | 13F | Trilogy Capital Inc. | 13,924 | -0.32 | 558 | -0.71 | ||||
| 2025-07-30 | 13F | Strategic Blueprint, LLC | 7,334 | -0.72 | 294 | -1.01 | ||||
| 2025-07-22 | 13F | Visionary Horizons, LLC | 90,098 | 44.23 | 3,614 | 43.60 | ||||
| 2025-08-12 | 13F | Calton & Associates, Inc. | 14,878 | -6.55 | 597 | -7.02 | ||||
| 2025-08-11 | 13F | HighTower Advisors, LLC | 662,080 | 0.28 | 26,556 | -0.17 | ||||
| 2025-08-13 | 13F | Van Hulzen Asset Management, LLC | 6,700 | 0.00 | 269 | -0.37 | ||||
| 2025-08-13 | 13F | Strategic Family Wealth Counselors, L.L.C. | 21,036 | 1.14 | 844 | 0.72 | ||||
| 2025-08-14 | 13F | Raymond James Financial Inc | 611,658 | 5.34 | 24,534 | 4.87 | ||||
| 2025-08-13 | 13F | Cerity Partners LLC | 311,427 | -2.78 | 12,491 | -3.21 | ||||
| 2025-08-08 | 13F | Creative Planning | 16,225 | -18.65 | 651 | -19.05 | ||||
| 2025-08-13 | 13F | Cheviot Value Management, LLC | 977,509 | 0.99 | 39,149 | 1.78 | ||||
| 2025-07-10 | 13F | Wealth Enhancement Advisory Services, Llc | 2,438,182 | -3.73 | 96,991 | -4.95 | ||||
| 2025-08-12 | 13F | Cornerstone Wealth Management, LLC | 175,826 | 11.23 | 7,052 | 10.72 | ||||
| 2025-07-29 | 13F | Signature Estate & Investment Advisors Llc | 5,293,089 | -22.08 | 212,306 | -22.43 | ||||
| 2025-08-04 | 13F | Bay Colony Advisory Group, Inc d/b/a Bay Colony Advisors | 14,032 | 3.21 | 563 | 2.93 | ||||
| 2025-08-11 | 13F | Addison Capital Co | 23,791 | 4.65 | 954 | 4.26 | ||||
| 2025-09-04 | 13F/A | Advisor Group Holdings, Inc. | 1,847,501 | 0.99 | 74,109 | 0.55 | ||||
| 2025-08-19 | 13F | Newbridge Financial Services Group, Inc. | 2,864 | 1.27 | 115 | 0.88 | ||||
| 2025-08-08 | 13F | Cetera Investment Advisers | 374,053 | -0.43 | 15,003 | -0.87 | ||||
| 2025-08-12 | 13F | Eldridge Investment Advisors, Inc. | 6,531 | 11.95 | 261 | 11.11 | ||||
| 2025-07-18 | 13F | PFG Investments, LLC | 27,677 | 20.50 | 1,110 | 20.00 | ||||
| 2025-08-13 | 13F | Lido Advisors, LLC | 36,836 | 12.56 | 1,478 | 12.06 | ||||
| 2025-07-22 | 13F | USAdvisors Wealth Management, LLC | 67,671 | 16.35 | 3 | 0.00 | ||||
| 2025-05-14 | 13F | Quadcap Wealth Management, LLC | 0 | -100.00 | 0 | |||||
| 2025-08-12 | 13F | Change Path, LLC | 80,077 | 8.21 | 3,212 | 7.72 | ||||
| 2025-07-31 | 13F | Cambridge Investment Research Advisors, Inc. | 420,775 | 22.96 | 17 | 23.08 | ||||
| 2025-05-09 | 13F | Drucker Wealth 3.0, LLC | 0 | -100.00 | 0 | |||||
| 2025-05-14 | 13F | Delta Investment Management, LLC | 0 | -100.00 | 0 | |||||
| 2025-07-29 | 13F | Koshinski Asset Management, Inc. | 533,103 | 1.15 | 21,383 | 0.70 | ||||
| 2025-07-31 | 13F | Oppenheimer & Co Inc | 15,655 | 3.86 | 628 | 3.29 | ||||
| 2025-04-30 | 13F | Ntv Asset Management Llc | 0 | -100.00 | 0 | |||||
| 2025-07-14 | 13F | Toth Financial Advisory Corp | 186 | 7 | ||||||
| 2025-08-12 | 13F | Virtu Financial LLC | 20,435 | 1 | ||||||
| 2025-07-31 | 13F | LongView Asset Management LLC | 5,039 | 0.68 | 202 | 0.50 | ||||
| 2025-08-14 | 13F | Hilltop Holdings Inc. | 8,369 | 336 | ||||||
| 2025-08-15 | 13F | Strategic Investment Advisors / MI | 11,863 | -5.80 | 476 | -6.31 | ||||
| 2025-07-30 | 13F | BlueChip Wealth Advisors LLC | 20,524 | -1.68 | 823 | -2.14 | ||||
| 2025-08-13 | 13F | Northwestern Mutual Wealth Management Co | 87,473 | -19.12 | 3,509 | -19.49 | ||||
| 2025-07-10 | 13F | SK Wealth Management, LLC | 69,583 | 2.03 | 2,769 | 2.56 | ||||
| 2025-08-06 | 13F | Savant Capital, LLC | 8,121 | -5.06 | 326 | -5.52 | ||||
| 2025-08-08 | 13F | Pnc Financial Services Group, Inc. | 3,924 | 39.20 | 157 | 38.94 | ||||
| 2025-08-15 | 13F | Captrust Financial Advisors | 514,531 | 111.61 | 20,638 | 110.67 | ||||
| 2025-08-05 | 13F | Fourth Dimension Wealth, LLC | 1,390 | -1.63 | 56 | -1.79 | ||||
| 2025-08-04 | 13F | Assetmark, Inc | 245,274 | 56.82 | 9,838 | 56.12 | ||||
| 2025-04-22 | 13F | Weaver Capital Management LLC | 0 | -100.00 | 0 | |||||
| 2025-08-14 | 13F | Stadion Money Management, LLC | 699,607 | -6.52 | 27,944 | -7.33 | ||||
| 2025-08-13 | 13F | Transce3nd, LLC | 153 | 0.00 | 6 | 0.00 | ||||
| 2025-08-07 | 13F | PFG Advisors | 15,767 | 17.85 | 632 | 17.25 | ||||
| 2025-08-11 | 13F | Western Wealth Management, LLC | 15,564 | -13.10 | 624 | -13.45 | ||||
| 2025-08-15 | 13F | Tower Research Capital LLC (TRC) | 39 | 2 | ||||||
| 2025-08-08 | 13F | Austin Wealth Management, LLC | 335,708 | -8.82 | 13,391 | -8.84 | ||||
| 2025-08-04 | 13F | Arkadios Wealth Advisors | 17,663 | 0.18 | 708 | -0.28 | ||||
| 2025-08-07 | 13F | Vise Technologies, Inc. | 10,399 | 417 | ||||||
| 2025-08-05 | 13F | Cherry Tree Wealth Management, LLC | 7,363 | 0.00 | 295 | -0.34 | ||||
| 2025-08-14 | 13F | Financial Engines Advisors L.L.C. | 7,718 | 2.42 | 310 | 1.97 | ||||
| 2025-07-25 | 13F | McNamara Financial Services, Inc. | 490,991 | 1.15 | 19,694 | 0.70 | ||||
| 2025-08-01 | 13F | Cobblestone Capital Advisors Llc /ny/ | 31,325 | -0.55 | 1,256 | -1.02 | ||||
| 2025-08-07 | 13F | Kestra Private Wealth Services, Llc | 30,211 | -13.65 | 1,212 | -14.05 | ||||
| 2025-05-08 | 13F | Us Financial Advisors, Llc | 103,325 | 3.53 | 4,163 | 5.88 | ||||
| 2025-07-25 | 13F | Cerro Pacific Wealth Advisors LLC | 175,938 | 25.80 | 7,057 | 28.10 | ||||
| 2025-08-14 | 13F | Comerica Bank | 37,580 | -4.42 | 1,507 | -4.86 | ||||
| 2025-08-14 | 13F | RMB Capital Management, LLC | 262,438 | -4.85 | 10,526 | -5.27 | ||||
| 2025-05-01 | 13F | McCarthy Grittinger Financial Group, LLC | 0 | -100.00 | 0 | |||||
| 2025-07-23 | 13F | 1 North Wealth Services Llc | 351,017 | 8.22 | 14,079 | 7.74 | ||||
| 2025-07-22 | 13F | Capital Advisors Inc/ok | 1,401,888 | 0.42 | 56,230 | -0.03 | ||||
| 2025-08-08 | 13F | SBI Securities Co., Ltd. | 4,851 | 3.26 | 195 | 2.65 | ||||
| 2025-07-21 | 13F | New Century Financial Group, LLC | 0 | -100.00 | 0 | |||||
| 2025-07-08 | 13F | Atwood & Palmer Inc | 0 | -100.00 | 0 | |||||
| 2025-08-12 | 13F | Proequities, Inc. | 0 | 0 | ||||||
| 2025-08-14 | 13F | Goldman Sachs Group Inc | 5,911 | -20.95 | 237 | -21.26 | ||||
| 2025-07-18 | 13F | Consolidated Portfolio Review Corp | 26,656 | -2.29 | 1,069 | -2.73 | ||||
| 2025-08-05 | 13F | Transatlantique Private Wealth Llc | 6,722 | 270 | ||||||
| 2025-07-29 | 13F | Stratos Wealth Partners, LTD. | 5,113 | -1.81 | 205 | -1.91 | ||||
| 2025-08-05 | 13F | GPS Wealth Strategies Group, LLC | 3,077 | 0.79 | 123 | 0.00 | ||||
| 2025-08-14 | 13F | Helium Advisors LLC | 5,773 | 232 | ||||||
| 2025-08-14 | 13F | Hurley Capital, LLC | 0 | -100.00 | 0 | |||||
| 2025-07-15 | 13F | Mather Group, Llc. | 0 | -100.00 | 0 | |||||
| 2025-07-18 | 13F | Truist Financial Corp | 144,418 | -6.46 | 5,793 | -6.88 | ||||
| 2025-08-06 | 13F | New Millennium Group LLC | 979 | 0.00 | 39 | 0.00 | ||||
| 2025-07-25 | 13F | Northwest Capital Management Inc | 1,963 | 456.09 | 79 | 457.14 | ||||
| 2025-07-28 | 13F | Harbour Investments, Inc. | 112,193 | 20.17 | 4,500 | 19.65 | ||||
| 2025-07-28 | 13F | Dock Street Asset Management Inc | 5,585 | 0.00 | 224 | -0.44 | ||||
| 2025-08-12 | 13F | Financial Advocates Investment Management | 13,428 | -23.68 | 539 | -24.01 | ||||
| 2025-07-31 | 13F | Jackson Hole Capital Partners, LLC | 17,706 | 0.00 | 710 | -0.42 | ||||
| 2025-07-25 | 13F | LRI Investments, LLC | 66 | 0.00 | 3 | 0.00 | ||||
| 2025-08-15 | 13F | Alaethes Wealth LLC | 10,919 | -1.32 | 438 | -1.80 | ||||
| 2025-04-22 | 13F | Center For Asset Management LLC | 0 | -100.00 | 0 | |||||
| 2025-08-08 | 13F | Tortoise Investment Management, LLC | 370 | 0.00 | 15 | 0.00 | ||||
| 2025-07-10 | 13F | Strathmore Capital Advisors, Inc. | 26,320 | 1,048 | ||||||
| 2025-08-14 | 13F | CIBC World Markets Inc. | 17,540 | 8.59 | 704 | 8.15 | ||||
| 2025-08-13 | 13F/A | StoneX Group Inc. | 7,660 | -52.05 | 311 | -52.67 | ||||
| 2025-08-04 | 13F | Flagship Harbor Advisors, Llc | 21,770 | 20.30 | 873 | 19.75 | ||||
| 2025-07-21 | 13F | Ameritas Advisory Services, LLC | 2,044 | 82 | ||||||
| 2025-08-06 | 13F | Paragon Capital Management Inc | 96,295 | -0.53 | 3,862 | -0.97 | ||||
| 2025-08-14 | 13F | Wetherby Asset Management Inc | 12,787 | 0.00 | 513 | 1.79 | ||||
| 2025-08-01 | 13F | SYM FINANCIAL Corp | 7,879 | -15.58 | 316 | -15.96 | ||||
| 2025-05-13 | 13F | NFP Retirement, Inc. | 0 | -100.00 | 0 | |||||
| 2025-07-15 | 13F | Bay Capital Advisors, LLC | 8,731 | -68.89 | 350 | -69.03 | ||||
| 2025-07-15 | 13F | Hofer & Associates. Inc | 0 | -100.00 | 0 | |||||
| 2025-07-15 | 13F | EWG Elevate Inc. | 102,307 | -0.42 | 4,104 | -0.87 | ||||
| 2025-07-31 | 13F | United Community Bank | 33,447 | 0.72 | 1,342 | 0.30 | ||||
| 2025-08-04 | 13F | Keybank National Association/oh | 16,704 | 0.00 | 670 | -0.59 | ||||
| 2025-05-15 | 13F/A | Orion Portfolio Solutions, LLC | 113,826 | -11.36 | 4,586 | -9.33 | ||||
| 2025-08-27 | 13F/A | Brinker Capital Investments, LLC | 112,315 | -1.33 | 4,505 | -1.79 | ||||
| 2025-08-14 | 13F | Citadel Advisors Llc | 91,493 | 3,670 | ||||||
| 2025-07-02 | 13F | Howard Financial Services, Ltd. | 526,422 | 2.27 | 21,115 | 1.81 | ||||
| 2025-08-05 | 13F | American Institute for Advanced Investment Management, LLP | 17,002 | 2.26 | 682 | 1.79 | ||||
| 2025-07-11 | 13F | Caldwell Securities, Inc | 1,171 | 0.00 | 47 | -2.13 | ||||
| 2025-08-14 | 13F | Warren Averett Asset Management, LLC | 125,107 | 7.09 | 5,018 | 6.61 | ||||
| 2025-08-06 | 13F | Paladin Advisory Group, LLC | 1,306 | 52 | ||||||
| 2025-08-07 | 13F | 1620 Investment Advisors, Inc. | 42,894 | 5.42 | 1,721 | 4.94 | ||||
| 2025-08-13 | 13F | Jones Financial Companies Lllp | 77,748 | 49.54 | 3,108 | 48.64 | ||||
| 2025-07-16 | 13F | Essex Financial Services, Inc. | 7,386 | 0.37 | 296 | 0.00 | ||||
| 2025-08-05 | 13F | Tiaa Trust, National Association | 6,547 | 0.00 | 263 | -0.38 | ||||
| 2025-07-30 | 13F | Family Capital Trust Co | 89,744 | 0.00 | 3,600 | -0.44 | ||||
| 2025-08-12 | 13F | Wood Tarver Financial Group, LLC | 256 | -27.48 | 0 | -100.00 | ||||
| 2025-05-14 | 13F | Oarsman Capital, Inc. | 0 | -100.00 | 0 | |||||
| 2025-07-24 | 13F/A | McElhenny Sheffield Capital Management, LLC | 14,881 | -2.79 | 597 | -3.25 | ||||
| 2025-08-07 | 13F | Allworth Financial LP | 4,058 | 0.82 | 163 | 1.25 | ||||
| 2025-07-17 | 13F | Park Place Capital Corp | 0 | -100.00 | 0 | |||||
| 2025-07-28 | 13F | Heritage Wealth Management, Inc. /CA/ | 63,975 | 2.96 | 2,566 | 2.52 | ||||
| 2025-08-14 | 13F | Citadel Advisors Llc | Call | 0 | -100.00 | 0 | ||||
| 2025-08-14 | 13F | Mariner, LLC | 176,812 | 16.46 | 7,092 | 15.92 | ||||
| 2025-07-23 | 13F | Country Club Bank /gfn | 8,280 | 0.00 | 331 | -0.60 | ||||
| 2025-08-08 | 13F | TD Capital Management LLC | 126 | 1.61 | 5 | 25.00 | ||||
| 2025-07-08 | 13F | Parallel Advisors, LLC | 0 | -100.00 | 0 | |||||
| 2025-07-23 | 13F | Fortis Advisors, LLC | 61,559 | 0.01 | 2,469 | -0.40 | ||||
| 2025-07-25 | 13F | Inman Jager Wealth Management, LLC | 175,378 | -1.59 | 7,034 | -2.03 | ||||
| 2025-08-13 | 13F | Baird Financial Group, Inc. | 29,611 | 10.64 | 1,188 | 10.11 | ||||
| 2025-04-22 | 13F/A | NorthRock Partners, LLC | 0 | -100.00 | 0 | |||||
| 2025-08-12 | 13F | Putnam Fl Investment Management Co | 0 | -100.00 | 0 | |||||
| 2025-08-14 | 13F/A | Rockefeller Capital Management L.P. | 35,387 | 44.24 | 1,419 | 43.62 | ||||
| 2025-07-25 | 13F | Atria Wealth Solutions, Inc. | 0 | -100.00 | 0 | |||||
| 2025-07-15 | 13F | MCF Advisors LLC | 4,798 | -5.98 | 192 | -6.34 | ||||
| 2025-07-17 | 13F | KWB Wealth | 348,119 | 33.42 | 14,026 | 36.47 | ||||
| 2025-08-07 | 13F | Verus Capital Partners, Llc | 7,209 | -3.12 | 289 | -3.34 | ||||
| 2025-07-15 | 13F | Signet Financial Management, Llc | 5,603 | -6.49 | 225 | -7.05 | ||||
| 2025-08-05 | 13F | Beckerman Institutional, LLC | 18,232 | -3.63 | 1 | |||||
| 2025-07-17 | 13F | LexAurum Advisors, LLC | 8,725 | 0.00 | 350 | -0.57 | ||||
| 2025-08-08 | 13F | Good Life Advisors, LLC | 24,603 | -2.22 | 987 | -2.67 | ||||
| 2025-07-25 | 13F | Concurrent Investment Advisors, LLC | 399,379 | 10.32 | 16,019 | 9.83 | ||||
| 2025-07-10 | 13F | Marshall Financial Group LLC | 34,061 | -27.54 | 1,351 | -28.63 | ||||
| 2025-08-06 | 13F | Ethos Financial Group, LLC | 111,377 | 4,467 | ||||||
| 2025-08-19 | 13F | Cape Investment Advisory, Inc. | 1,532 | 1.26 | 61 | 1.67 | ||||
| 2025-07-24 | 13F | Eastern Bank | 15,673 | -80.00 | 629 | -80.11 | ||||
| 2025-08-07 | 13F | Curtis Advisory Group, LLC | 10,909 | 22.71 | 438 | 22.07 | ||||
| 2025-07-21 | 13F | Cornell Pochily Investment Advisors, Inc. | 12,022 | 3.03 | 482 | 2.55 | ||||
| 2025-07-10 | 13F | Redhawk Wealth Advisors, Inc. | 114,503 | 66.12 | 4,593 | 65.36 | ||||
| 2025-08-05 | 13F | NewSquare Capital LLC | 177 | 0.00 | 7 | 0.00 | ||||
| 2025-07-11 | 13F | Weatherly Asset Management L. P. | 560,026 | 2.77 | 22,463 | 2.30 | ||||
| 2025-07-23 | 13F | Bellevue Asset Management, Llc | 2,646 | 1.69 | 106 | 1.92 | ||||
| 2025-07-08 | 13F | Ballew Advisors, Inc | 203,638 | -4.22 | 8,101 | -3.47 | ||||
| 2025-07-25 | 13F | M3 Advisory Group, LLC | 6,310 | 2.32 | 253 | 2.02 | ||||
| 2025-07-30 | 13F | Exencial Wealth Advisors, Llc | 5,123 | -33.59 | 206 | -33.87 | ||||
| 2025-07-16 | 13F | True North Advisors, LLC | 6,365 | 0.00 | 255 | -0.39 | ||||
| 2025-07-22 | 13F | Macroview Investment Management Llc | 9,482 | 16.26 | 380 | 15.85 | ||||
| 2025-07-28 | 13F | Smart Portfolios, LLC | 8,941 | -6.55 | 359 | -7.01 | ||||
| 2025-05-01 | 13F | Quest 10 Wealth Builders, Inc. | 118 | -4.84 | 5 | 0.00 | ||||
| 2025-08-01 | 13F | Redwood Park Advisors LLC | 80,173 | -6.86 | 3,216 | -7.30 | ||||
| 2025-08-12 | 13F | Park Square Financial Group, LLC | 265 | 0.00 | 11 | 0.00 | ||||
| 2025-08-13 | 13F | WCG Wealth Advisors LLC | 636,851 | -16.13 | 25,544 | -16.51 | ||||
| 2025-08-13 | 13F | Aufman Associates Inc | 7,311 | -0.33 | 293 | -0.68 | ||||
| 2025-07-25 | 13F | Richardson Financial Services Inc. | 14,912 | 10.30 | 595 | 9.38 | ||||
| 2025-07-22 | 13F | MBL Wealth, LLC | 56,380 | -16.68 | 2,261 | -17.06 | ||||
| 2025-07-30 | 13F | Journey Advisory Group, LLC | 191,509 | 21.00 | 7,681 | 20.47 | ||||
| 2025-07-28 | 13F | Kiker Wealth Management, LLC | 0 | -100.00 | 0 | |||||
| 2025-08-15 | 13F/A | Symphony Financial, Ltd. Co. | 4,843 | -21.96 | 264 | 6.91 | ||||
| 2025-07-30 | 13F | Clifford Swan Investment Counsel Llc | 31,675 | 0.00 | 1,270 | -0.47 | ||||
| 2025-08-05 | 13F | Bank Of Montreal /can/ | 535 | 0.00 | 21 | 0.00 | ||||
| 2025-07-24 | 13F | Leo Wealth, LLC | 5,072 | 203 | ||||||
| 2025-07-18 | 13F | Cooper Financial Group | 46,037 | -10.31 | 1,847 | -10.74 | ||||
| 2025-08-13 | 13F | Keystone Financial Group | 187,083 | -2.42 | 7,492 | -1.45 | ||||
| 2025-08-12 | 13F | Richard W. Paul & Associates, LLC | 1,050 | 0.00 | 42 | 0.00 | ||||
| 2025-08-14 | 13F | Fwl Investment Management, Llc | 4,239 | 13.22 | 170 | 13.33 | ||||
| 2025-07-22 | 13F | Merit Financial Group, LLC | 100,543 | 133.77 | 4,033 | 132.79 | ||||
| 2025-08-27 | NP | LNOAX - LADENBURG INCOME & GROWTH FUND Class A Shares | 147,225 | 0.00 | 5,905 | -0.44 | ||||
| 2025-08-12 | 13F | Waterloo Capital, L.P. | 8,857 | -4.80 | 355 | -5.08 | ||||
| 2025-08-08 | 13F | Hartland & Co., LLC | 11,448 | 1.49 | 459 | 1.10 | ||||
| 2025-08-12 | 13F | Bedel Financial Consulting, Inc. | 215,515 | 0.25 | 8,644 | 1.02 | ||||
| 2025-07-24 | 13F | Us Bancorp \de\ | 2,437 | 49.97 | 98 | 49.23 | ||||
| 2025-08-08 | 13F | Crossmark Global Holdings, Inc. | 12,784 | 29.76 | 513 | 29.29 | ||||
| 2025-07-16 | 13F | RWM Asset Management, LLC | 378,330 | 1.66 | 15,175 | 1.21 | ||||
| 2025-08-14 | 13F | Ausdal Financial Partners, Inc. | 0 | -100.00 | 0 | |||||
| 2025-07-30 | 13F | Brookstone Capital Management | 5,878 | 2.65 | 236 | 2.17 | ||||
| 2025-07-15 | 13F | Unified Investment Management | 7,513 | -1.31 | 301 | -1.63 | ||||
| 2025-07-30 | 13F | Eqis Capital Management, Inc. | 27,397 | -7.16 | 1,099 | -7.65 | ||||
| 2025-08-14 | 13F | Horizon Investments, LLC | 821,760 | 11.98 | 32,690 | 11.51 | ||||
| 2025-07-17 | 13F | Barry Investment Advisors, LLC | 120,390 | -12.38 | 4,829 | -12.79 | ||||
| 2025-05-15 | 13F | Mercer Global Advisors Inc /adv | 0 | -100.00 | 0 | -100.00 | ||||
| 2025-08-14 | 13F | Waterford Advisors, LLC | 0 | -100.00 | 0 | |||||
| 2025-07-08 | 13F | Webster Bank, N. A. | 28,726 | -10.57 | 1,152 | -10.97 | ||||
| 2025-08-14 | 13F/A | Perritt Capital Management Inc | 4,464 | 0.68 | 179 | 0.56 | ||||
| 2025-08-18 | 13F/A | Kestra Investment Management, LLC | 1,471,668 | -40.56 | 59,029 | -40.82 | ||||
| 2025-07-18 | 13F | Deltec Asset Management Llc | 5,400 | 0.00 | 217 | -0.46 | ||||
| 2025-08-14 | 13F | Great Valley Advisor Group, Inc. | 38,368 | -11.09 | 1,539 | -11.51 | ||||
| 2025-08-13 | 13F | Level Four Advisory Services, Llc | 5,375 | -11.96 | 216 | -12.60 | ||||
| 2025-08-05 | 13F | Prosperity Consulting Group, LLC | 0 | -100.00 | 0 | |||||
| 2025-07-14 | 13F | Signature Securities Group Corporation | 19,373 | 8.05 | 777 | 7.62 | ||||
| 2025-07-10 | 13F | Sharkey, Howes & Javer | 312,358 | 29.77 | 12,529 | 29.19 | ||||
| 2025-07-23 | 13F | Tectonic Advisors Llc | 2,424,193 | -1.55 | 97,234 | -1.99 | ||||
| 2025-07-29 | 13F | Chicago Partners Investment Group LLC | 14,851 | 0.06 | 592 | 0.00 | ||||
| 2025-07-23 | 13F | Valmark Advisers, Inc. | 17,727 | 45.63 | 711 | 45.10 | ||||
| 2025-08-14 | 13F | Main Street Financial Solutions, LLC | 460,791 | 3.69 | 18,482 | 3.23 | ||||
| 2025-08-04 | 13F | Pinnacle Associates Ltd | 493,006 | 8.54 | 19,774 | 8.05 | ||||
| 2025-07-08 | 13F | Nbc Securities, Inc. | 40,415 | -1.84 | 2 | 0.00 | ||||
| 2025-08-08 | 13F | Family Firm, Inc. | 122,426 | 1.07 | 4,911 | 0.61 | ||||
| 2025-08-27 | NP | LNCAX - LADENBURG INCOME FUND Class A Shares | 37,866 | -2.92 | 1,519 | -3.37 | ||||
| 2025-08-14 | 13F | CoreCap Advisors, LLC | 1,478 | -0.40 | 59 | 0.00 | ||||
| 2025-08-11 | 13F | Citigroup Inc | 1,710 | -16.75 | 69 | -17.07 | ||||
| 2025-07-23 | 13F | Litman Gregory Asset Management LLC | 174,597 | 10.29 | 7,003 | 9.80 | ||||
| 2025-08-12 | 13F | Jacobi Capital Management LLC | 58,145 | 3.48 | 2,332 | 3.05 | ||||
| 2025-07-17 | 13F | Janney Montgomery Scott LLC | 239,293 | -6.29 | 10 | -10.00 | ||||
| 2025-09-03 | 13F | American Trust | 8,617 | 346 | ||||||
| 2025-07-16 | 13F | Spinnaker Investment Group, LLC | 15,392 | -77.04 | 617 | -77.15 | ||||
| 2025-07-23 | 13F | Laraway Financial Inc | 4,290 | -7.52 | 172 | -7.53 | ||||
| 2025-08-14 | 13F | Financial Advisory Service, Inc. | 364,567 | 3.94 | 14,623 | 3.47 | ||||
| 2025-08-14 | 13F | Mml Investors Services, Llc | 14,395 | -5.50 | 1 | |||||
| 2025-08-14 | 13F | Wells Fargo & Company/mn | 1,610,108 | 8.47 | 64,581 | 7.99 | ||||
| 2025-08-18 | 13F | Hollencrest Capital Management | 49,903 | -0.98 | 2,002 | -1.43 | ||||
| 2025-08-14 | 13F | IHT Wealth Management, LLC | 0 | -100.00 | 0 | |||||
| 2025-07-23 | 13F | Prime Capital Investment Advisors, LLC | 106,381 | -2.91 | 4,267 | -3.35 | ||||
| 2025-07-22 | 13F | DAVENPORT & Co LLC | 9,088 | 0.00 | 365 | -0.55 | ||||
| 2025-08-12 | 13F | Global Retirement Partners, LLC | 12,137 | 55.32 | 487 | 58.31 | ||||
| 2025-08-01 | 13F | Motco | 21,715 | 23.80 | 866 | 22.66 | ||||
| 2025-08-05 | 13F | Strategic Financial Concepts, LLC | 0 | -100.00 | 0 | |||||
| 2025-08-06 | 13F | Csenge Advisory Group | 0 | -100.00 | 0 | |||||
| 2025-08-13 | 13F | M Holdings Securities, Inc. | 11,588 | 0 | ||||||
| 2025-05-15 | 13F | Keel Point, LLC | 0 | -100.00 | 0 | |||||
| 2025-08-20 | 13F/A | Thompson Davis & Co., Inc. | 6,075 | -12.90 | 244 | -13.52 | ||||
| 2025-07-23 | 13F | Sachetta, LLC | 20,303 | 229.70 | 814 | 228.23 | ||||
| 2025-08-14 | 13F | Visionary Wealth Advisors | 101,911 | 4.27 | 4,088 | 3.78 | ||||
| 2025-07-30 | 13F | Greatmark Investment Partners, Inc. | 22,975 | 3.37 | 922 | 2.91 | ||||
| 2025-07-25 | 13F | Verdence Capital Advisors LLC | 11,465 | 1.20 | 460 | 0.66 | ||||
| 2025-07-18 | 13F | SOA Wealth Advisors, LLC. | 201 | 0.00 | 8 | 0.00 | ||||
| 2025-08-14 | 13F | Fmr Llc | 13,817,325 | 120.89 | 554,213 | 119.90 | ||||
| 2025-07-29 | 13F | Crux Wealth Advisors | 14,988 | -41.47 | 601 | -41.71 | ||||
| 2025-08-11 | 13F | Principal Securities, Inc. | 365 | 15 | ||||||
| 2025-08-08 | 13F | Larson Financial Group LLC | 791 | 1.02 | 32 | 0.00 | ||||
| 2025-08-05 | 13F | Wakefield Asset Management LLLP | 83,863 | 8.62 | 3,364 | 8.14 | ||||
| 2025-07-23 | 13F | Kingswood Wealth Advisors, Llc | 11,354 | -40.08 | 455 | -40.21 | ||||
| 2025-07-07 | 13F | Versant Capital Management, Inc | 16 | 0.00 | 1 | |||||
| 2025-07-17 | 13F | Johnson Bixby & Associates, LLC | 117,301 | 54.86 | 4,705 | 54.18 | ||||
| 2025-08-18 | 13F | V2 Financial group LLC | 127,948 | 4.25 | 5,132 | 3.80 | ||||
| 2025-08-14 | 13F | Connecticut Wealth Management, LLC | 59,193 | -7.70 | 2,374 | -8.09 | ||||
| 2025-08-07 | 13F | Pinnacle Wealth Management Advisory Group, LLC | 268,141 | 9.88 | 10,755 | 9.40 | ||||
| 2025-08-12 | 13F | Archer Investment Corp | 1,587 | 0.00 | 64 | 0.00 | ||||
| 2025-07-29 | 13F | Private Trust Co Na | 16,621 | 19.20 | 667 | 18.72 | ||||
| 2025-05-07 | 13F | WMS Partners, LLC | 0 | -100.00 | 0 | |||||
| 2025-08-15 | 13F | Morgan Stanley | 5,498,369 | -4.21 | 220,540 | -4.64 | ||||
| 2025-08-11 | 13F | Pinnacle Financial Group, LLC / IL | 43,107 | 1.55 | 1,729 | 1.11 | ||||
| 2025-08-06 | 13F | Founders Financial Securities Llc | 15,564 | -1.06 | 624 | -1.11 | ||||
| 2025-08-07 | 13F | Alpha Cubed Investments, LLC | 99,134 | -21.33 | 3,976 | -21.69 | ||||
| 2025-08-27 | NP | LOWAX - LADENBURG GROWTH & INCOME FUND Class A Shares | 251,616 | 0.00 | 10,092 | -0.44 | ||||
| 2025-05-02 | 13F | Wealthfront Advisers Llc | 0 | -100.00 | 0 | -100.00 | ||||
| 2025-07-28 | 13F | Lunt Capital Management, Inc. | 112,775 | 16.99 | 4,523 | 16.48 | ||||
| 2025-08-11 | 13F | TD Waterhouse Canada Inc. | 1,600 | 0.00 | 64 | -1.56 | ||||
| 2025-08-04 | 13F | WNY Asset Management, LLC | 13,649 | -1.10 | 547 | -1.62 | ||||
| 2025-08-12 | 13F | MAI Capital Management | 208,812 | 17.48 | 8,375 | 16.95 | ||||
| 2025-08-14 | 13F | UBS Group AG | 1,747,830 | 5.10 | 70,105 | 4.63 | ||||
| 2025-08-14 | 13F | Ariadne Wealth Management, LP | 19,287 | 199.07 | 775 | 202.34 |