Mga Batayang Estadistika
| Pemilik Institusional | 264 total, 264 long only, 0 short only, 0 long/short - change of -2.22% MRQ |
| Alokasi Portofolio Rata-rata | 0.1364 % - change of -22.69% MRQ |
| Saham Institusional (Jangka Panjang) | 11,698,534 (ex 13D/G) - change of 0.37MM shares 3.28% MRQ |
| Nilai Institusional (Jangka Panjang) | $ 523,689 USD ($1000) |
Kepemilikan Institusional dan Pemegang Saham
iShares Trust - iShares Core 40/60 Moderate Allocation ETF (US:AOM) memiliki 264 pemilik institusional dan pemegang saham yang telah mengajukan formulir 13D/G atau 13F kepada Komisi Bursa Efek (Securities Exchange Commission/SEC). Lembaga-lembaga ini memegang total 11,698,534 saham. Pemegang saham terbesar meliputi BlackRock, Inc., LPL Financial LLC, Foundations Investment Advisors, LLC, Morgan Stanley, Ameriprise Financial Inc, TCG Advisory Services, LLC, Weitzel Financial Services, Inc., Royal Bank Of Canada, Kavar Capital Partners Group, Llc, and Wells Fargo & Company/mn .
Struktur kepemilikan institusional iShares Trust - iShares Core 40/60 Moderate Allocation ETF (ARCA:AOM) menunjukkan posisi terkini di perusahaan oleh institusi dan dana, serta perubahan terbaru dalam ukuran posisi. Pemegang saham utama dapat mencakup investor individu, reksa dana, dana lindung nilai, atau institusi. Jadwal 13D menunjukkan bahwa investor memegang (atau pernah memegang) lebih dari 5% saham perusahaan dan bermaksud (atau pernah bermaksud) untuk secara aktif mengejar perubahan strategi bisnis. Jadwal 13G menunjukkan investasi pasif lebih dari 5%.
The share price as of September 5, 2025 is 46.98 / share. Previously, on September 6, 2024, the share price was 43.92 / share. This represents an increase of 6.97% over that period.

Skor Sentimen Dana
Skor Sentimen Dana (sebelumnya dikenal sebagai Skor Akumulasi Kepemilikan) menemukan saham-saham yang paling banyak dibeli oleh dana. Ini adalah hasil dari model kuantitatif multi-faktor yang canggih yang mengidentifikasi perusahaan dengan tingkat akumulasi institusional tertinggi. Model penilaian menggunakan kombinasi dari total peningkatan pemilik yang diungkapkan, perubahan dalam alokasi portofolio pada pemilik tersebut, dan metrik lainnya. Angka berkisar dari 0 hingga 100, dengan angka yang lebih tinggi menunjukkan tingkat akumulasi yang lebih tinggi dibandingkan dengan perusahaan sejenisnya, dan 50 adalah rata-ratanya.
Frekuensi Pembaruan: Setiap Hari
Lihat Ownership Explorer, yang menyediakan daftar perusahaan dengan peringkat tertinggi.
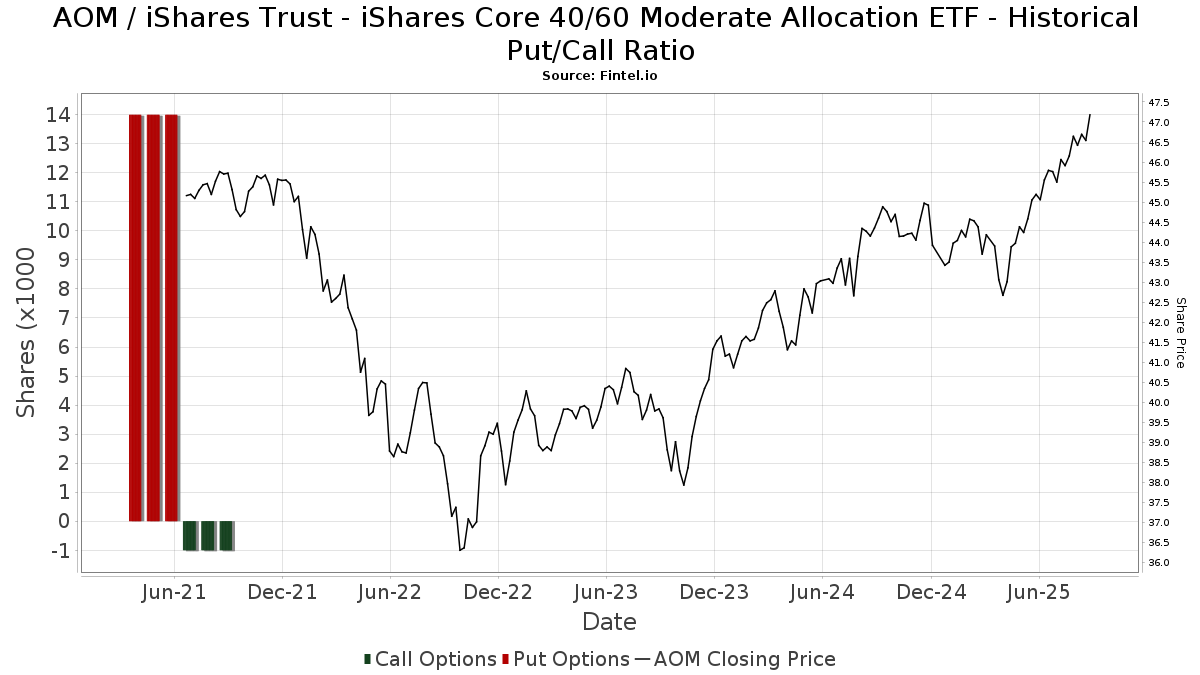
Rasio Put/Call Institusional
Selain melaporkan isu ekuitas dan utang standar, institusi dengan aset di bawah manajemen lebih dari 100 juta dolar AS juga harus mengungkapkan kepemilikan opsi put dan call mereka. Karena opsi put umumnya menunjukkan sentimen negatif, dan opsi call menunjukkan sentimen positif, kita dapat mengetahui sentimen institusional secara keseluruhan dengan memplot rasio put terhadap call. Grafik di sebelah kanan memplot rasio put/call historis untuk instrumen ini.
Menggunakan Rasio Put/Call sebagai indikator sentimen investor mengatasi salah satu kekurangan utama dari penggunaan total kepemilikan institusional, yaitu sejumlah besar aset yang dikelola diinvestasikan secara pasif untuk melacak indeks. Dana yang dikelola secara pasif biasanya tidak membeli opsi, sehingga indikator rasio put/call lebih akurat dalam melacak sentimen dana yang dikelola secara aktif.
Pengajuan 13D/G
Kami menyajikan pengajuan 13D/G secara terpisah dari pengajuan 13F karena perlakuan yang berbeda oleh SEC. Pengajuan 13D/G dapat diajukan oleh kelompok investor (dengan satu pemimpin), sedangkan pengajuan 13F tidak bisa. Hal ini mengakibatkan situasi di mana seorang investor dapat mengajukan 13D/G yang melaporkan satu nilai untuk total saham (mewakili semua saham yang dimiliki oleh kelompok investor), tetapi kemudian mengajukan 13F yang melaporkan nilai yang berbeda untuk total saham (mewakili kepemilikan mereka sendiri). Ini berarti bahwa kepemilikan saham dari pengajuan 13D/G dan pengajuan 13F seringkali tidak dapat dibandingkan secara langsung, sehingga kami menyajikannya secara terpisah.
Catatan: Mulai 16 Mei 2021, kami tidak lagi menampilkan pemilik yang belum mengajukan 13D/G dalam setahun terakhir. Sebelumnya, kami menampilkan riwayat lengkap pengajuan 13D/G. Secara umum, entitas yang diwajibkan untuk mengajukan pengajuan 13D/G harus mengajukan setidaknya setiap tahun sebelum mengirimkan pengajuan penutupan. Namun, terkadang dana keluar dari posisi tanpa mengirimkan pengajuan penutupan (misalnya, mereka menghentikan operasi), sehingga menampilkan riwayat lengkap terkadang menyebabkan kebingungan tentang kepemilikan saat ini. Untuk mencegah kebingungan, kami sekarang hanya menampilkan pemilik 'saat ini' - yaitu - pemilik yang telah mengajukan dalam setahun terakhir.
Upgrade to unlock premium data.
| Tanggal File | Formulir | Investor | Sebelumnya Saham |
Terbaru Saham |
Δ Saham (Persen) |
Kepemilikan (Persen) |
Δ Pagmamay-ari (Persen) |
|
|---|---|---|---|---|---|---|---|---|
| 2025-04-22 | BlackRock, Inc. | 2,729,495 | 0 | -100.00 | 0.00 | -100.00 | ||
| 2025-04-15 | BlackRock Portfolio Management LLC | 2,910,257 | 8.80 |
Pengajuan 13F dan NPORT
Detail pada pengajuan 13F tersedia gratis. Detail pada pengajuan NP memerlukan keanggotaan premium. Baris berwarna hijau menunjukkan posisi baru. Baris berwarna merah menunjukkan posisi yang sudah ditutup. Klik tautan ini ikon untuk melihat riwayat transaksi selengkapnya.
Tingkatkan
untuk membuka data premium dan mengekspor ke Excel ![]() .
.
| Tanggal File | Sumber | Investor | Ketik | Presyo ng Avg (Silangan) |
Saham | Δ Saham (%) |
Dilaporkan Nilai ($1000) |
Nilai Δ (%) |
Alokasi Port (%) |
|
|---|---|---|---|---|---|---|---|---|---|---|
| 2025-07-29 | 13F | MPS Loria Financial Planners, LLC | 9,657 | 20.32 | 445 | 26.14 | ||||
| 2025-08-13 | 13F | Vermillion & White Wealth Management Group, LLC | 30 | 1 | ||||||
| 2025-08-11 | 13F | Summit Wealth Partners, LLC | 16,939 | -3.22 | 780 | 1.43 | ||||
| 2025-08-11 | 13F | Delta Asset Management Llc/tn | 465 | -2.11 | 21 | 5.00 | ||||
| 2025-08-12 | 13F | Weaver Consulting Group | 161,042 | 0.62 | 7,414 | 5.58 | ||||
| 2025-07-07 | 13F | RDA Financial Network | 25,915 | -0.67 | 1,193 | 4.28 | ||||
| 2025-08-14 | 13F | Bnp Paribas Arbitrage, Sa | 25 | 1 | ||||||
| 2025-07-22 | 13F | BridgePort Financial Solutions, LLC | 11,158 | 1.44 | 514 | 6.43 | ||||
| 2025-07-23 | 13F | Elevate Wealth Advisory, Inc | 11 | 1,000.00 | 1 | |||||
| 2025-07-31 | 13F | AlTi Global, Inc. | 17,704 | -41.34 | 815 | -38.44 | ||||
| 2025-08-12 | 13F | Gladstone Institutional Advisory LLC | 8,193 | -15.98 | 377 | -11.71 | ||||
| 2025-07-31 | 13F | Buckingham Strategic Partners | 6,607 | 0.15 | 304 | 5.19 | ||||
| 2025-08-01 | 13F | Gwn Securities Inc. | 15,481 | -8.61 | 713 | -4.17 | ||||
| 2025-07-23 | 13F | Armstrong, Fleming & Moore, Inc | 12,042 | 554 | ||||||
| 2025-05-12 | 13F | Hantz Financial Services, Inc. | 0 | -100.00 | 0 | |||||
| 2025-08-14 | 13F | Colony Group, LLC | 81,764 | 1.11 | 3,764 | 6.09 | ||||
| 2025-08-18 | 13F/A | National Bank Of Canada /fi/ | 19,883 | 4.54 | 914 | 9.47 | ||||
| 2025-08-13 | 13F | RFP Financial Group LLC | 5,544 | -10.39 | 255 | -5.90 | ||||
| 2025-08-12 | 13F | Steward Partners Investment Advisory, Llc | 14,834 | 0.45 | 683 | 5.41 | ||||
| 2025-07-28 | 13F | Ritholtz Wealth Management | 19,699 | -3.58 | 907 | 1.12 | ||||
| 2025-05-14 | 13F | Renaissance Technologies Llc | 0 | -100.00 | 0 | |||||
| 2025-08-14 | 13F | Raymond James Financial Inc | 77,212 | -14.91 | 3,555 | -10.73 | ||||
| 2025-07-28 | 13F | Axxcess Wealth Management, Llc | 18,639 | 149.62 | 858 | 162.39 | ||||
| 2025-07-21 | 13F | Ascent Group, LLC | 8,241 | 0.00 | 379 | 4.99 | ||||
| 2025-04-22 | 13F/A | NorthRock Partners, LLC | 0 | -100.00 | 0 | |||||
| 2025-07-25 | 13F | Investment Advisory Group, LLC | 140,861 | 3.52 | 6,485 | 8.63 | ||||
| 2025-08-14 | 13F | Mariner, LLC | 12,445 | 10.93 | 573 | 16.26 | ||||
| 2025-04-22 | 13F | Crews Bank & Trust | 0 | -100.00 | 0 | |||||
| 2025-08-18 | 13F | Geneos Wealth Management Inc. | 1,237 | 47.26 | 57 | 55.56 | ||||
| 2025-07-10 | 13F | Global Financial Private Client, LLC | 20,101 | 0.00 | 925 | 4.88 | ||||
| 2025-07-22 | 13F | Beacon Financial Advisory LLC | 43,451 | -1.64 | 2,000 | 3.20 | ||||
| 2025-07-30 | 13F | Bogart Wealth, LLC | 595 | 0.00 | 27 | 3.85 | ||||
| 2025-08-05 | 13F | Sigma Planning Corp | 13,836 | -31.25 | 637 | -27.86 | ||||
| 2025-08-13 | 13F | Northwestern Mutual Wealth Management Co | 809 | -2.06 | 37 | 2.78 | ||||
| 2025-08-12 | 13F | Boreal Capital Management LLC | 371 | 17 | ||||||
| 2025-08-14 | 13F | Susquehanna International Group, Llp | 49,712 | 69.05 | 2,289 | 77.36 | ||||
| 2025-07-31 | 13F | Cambridge Investment Research Advisors, Inc. | 132,219 | 0.08 | 6 | 20.00 | ||||
| 2025-07-23 | 13F | WestEnd Advisors, LLC | 631 | 1,007.02 | 29 | 1,350.00 | ||||
| 2025-08-12 | 13F | Weitzel Financial Services, Inc. | 277,568 | -0.90 | 12,843 | 6.04 | ||||
| 2025-07-11 | 13F/A | Umb Bank N A/mo | 1,130 | 52 | ||||||
| 2025-08-13 | 13F | Summit Financial, LLC | 0 | -100.00 | 0 | |||||
| 2025-07-29 | 13F | Empirical Asset Management, LLC | 5,538 | -1.05 | 255 | 3.67 | ||||
| 2025-07-23 | 13F | 1 North Wealth Services Llc | 1,683 | 9.43 | 77 | 14.93 | ||||
| 2025-08-12 | 13F | Waterloo Capital, L.P. | 8,108 | 48.36 | 373 | 56.07 | ||||
| 2025-07-08 | 13F | Zrc Wealth Management, Llc | 284 | 0.71 | 13 | 8.33 | ||||
| 2025-08-14 | 13F | Mml Investors Services, Llc | 21,120 | 8.45 | 1 | |||||
| 2025-07-24 | 13F | Ronald Blue Trust, Inc. | 3,379 | 0.00 | 156 | 4.73 | ||||
| 2025-08-14 | 13F | Sunbelt Securities, Inc. | 2,554 | -1.16 | 111 | -2.65 | ||||
| 2025-07-09 | 13F | Dynamic Advisor Solutions LLC | 5,667 | 1.21 | 261 | 6.12 | ||||
| 2025-07-22 | 13F | Bay Harbor Wealth Management, LLC | 7,889 | -1.45 | 363 | 3.42 | ||||
| 2025-08-12 | 13F | MAI Capital Management | 14,851 | -7.79 | 684 | -3.26 | ||||
| 2025-07-18 | 13F | Philip James Wealth Mangement, LLC | 4,805 | 0.36 | 221 | 5.24 | ||||
| 2025-07-17 | 13F | Worth Financial Advisory Group, LLC | 0 | -100.00 | 0 | |||||
| 2025-08-14 | 13F | Money Concepts Capital Corp | 12,818 | 590 | ||||||
| 2025-05-14 | 13F | Van Hulzen Asset Management, LLC | 0 | -100.00 | 0 | -100.00 | ||||
| 2025-08-14 | 13F | Wells Fargo & Company/mn | 251,200 | -0.90 | 11,565 | 3.98 | ||||
| 2025-07-23 | 13F | Steel Peak Wealth Management LLC | 15,115 | 0.03 | 696 | 4.83 | ||||
| 2025-07-02 | 13F | Dentgroup LLC | 13,310 | 0.00 | 613 | 4.79 | ||||
| 2025-04-22 | 13F | Bright Futures Wealth Management, LLC. | 7,629 | 2.10 | 324 | -1.82 | ||||
| 2025-08-01 | 13F | Envestnet Asset Management Inc | 93,421 | 15.46 | 4,301 | 21.15 | ||||
| 2025-07-24 | 13F | Jfs Wealth Advisors, Llc | 4,847 | -3.43 | 223 | 1.36 | ||||
| 2025-07-15 | 13F | Beacon Investment Advisory Services, Inc. | 18,029 | 3.09 | 830 | 8.21 | ||||
| 2025-08-15 | 13F | Tower Research Capital LLC (TRC) | 0 | -100.00 | 0 | |||||
| 2025-08-19 | 13F | Advisory Services Network, LLC | 7,734 | -18.71 | 354 | -15.11 | ||||
| 2025-07-08 | 13F | Parallel Advisors, LLC | 1,554 | -5.88 | 72 | -1.39 | ||||
| 2025-08-13 | 13F | Transce3nd, LLC | 786 | -40.54 | 36 | -37.93 | ||||
| 2025-08-15 | 13F | Captrust Financial Advisors | 24,917 | 176.30 | 1,147 | 190.38 | ||||
| 2025-07-14 | 13F | Proathlete Wealth Management Llc | 3,627 | 0.19 | 167 | 5.70 | ||||
| 2025-08-04 | 13F | Mesirow Financial Investment Management, Inc. | 14,285 | -0.24 | 658 | 4.62 | ||||
| 2025-08-14 | 13F | Citadel Advisors Llc | 4,851 | -25.12 | 223 | -21.48 | ||||
| 2025-07-17 | 13F | Halbert Hargrove Global Advisors, Llc | 115 | -0.86 | 5 | 0.00 | ||||
| 2025-08-15 | 13F | First Heartland Consultants, Inc. | 7,641 | 0.00 | 262 | -22.09 | ||||
| 2025-08-08 | 13F | Cetera Investment Advisers | 165,931 | 7.26 | 7,639 | 12.54 | ||||
| 2025-08-05 | 13F | Milestone Asset Management, Llc | 34,039 | -0.60 | 1,567 | 4.33 | ||||
| 2025-07-22 | 13F | Ellenbecker Investment Group | 49,991 | 1.21 | 2,302 | 6.18 | ||||
| 2025-07-22 | 13F | HFM Investment Advisors, LLC | 2,617 | 1.32 | 120 | 6.19 | ||||
| 2025-08-14 | 13F | Federation des caisses Desjardins du Quebec | 11,612 | 26.80 | 535 | 33.17 | ||||
| 2025-07-17 | 13F | Patton Albertson Miller Group, Llc | 45,977 | 6.07 | 2,117 | 11.31 | ||||
| 2025-08-29 | 13F | Centaurus Financial, Inc. | 8,797 | 2.68 | 0 | |||||
| 2025-07-10 | 13F | Wealth Enhancement Advisory Services, Llc | 91,624 | -20.48 | 4,200 | -16.93 | ||||
| 2025-08-05 | 13F | American Capital Advisory, LLC | 135 | 0.00 | 6 | 20.00 | ||||
| 2025-08-12 | 13F | LPL Financial LLC | 990,640 | -0.48 | 45,609 | 4.42 | ||||
| 2025-08-08 | 13F | Hartland & Co., LLC | 30 | 0.00 | 1 | 0.00 | ||||
| 2025-08-12 | 13F | Franklin Resources Inc | 1,163 | 54 | ||||||
| 2025-07-10 | 13F | Kmg Fiduciary Partners, Llc | 21,410 | 9.01 | 986 | 14.40 | ||||
| 2025-08-12 | 13F | J.w. Cole Advisors, Inc. | 29,261 | 12.48 | 1,347 | 18.05 | ||||
| 2025-08-12 | 13F | Founders Financial Alliance, LLC | 1,958 | 0.00 | 90 | 5.88 | ||||
| 2025-08-14 | 13F | McIlrath & Eck, LLC | 1,785 | 1.83 | 82 | 7.89 | ||||
| 2025-08-14 | 13F | Wiley Bros.-aintree Capital, Llc | 5,356 | 247 | ||||||
| 2025-08-08 | 13F | Larson Financial Group LLC | 0 | -100.00 | 0 | |||||
| 2025-04-10 | 13F | Retireful, LLC | 0 | -100.00 | 0 | |||||
| 2025-08-11 | 13F | HighTower Advisors, LLC | 19,391 | -0.83 | 893 | 3.96 | ||||
| 2025-07-15 | 13F | Sightline Wealth Advisors, LLC | 5,388 | 248 | ||||||
| 2025-08-06 | 13F | Columbia River Financial Group, LLC | 0 | -100.00 | 0 | |||||
| 2025-07-23 | 13F | High Note Wealth, LLC | 1 | 0.00 | 0 | |||||
| 2025-08-14 | 13F | Comerica Bank | 0 | -100.00 | 0 | |||||
| 2025-07-17 | 13F | Janney Montgomery Scott LLC | 4,494 | -64.89 | 0 | |||||
| 2025-08-05 | 13F | Bank Of Montreal /can/ | 6,137 | -12.04 | 283 | -7.84 | ||||
| 2025-05-02 | 13F | Kingsview Wealth Management, LLC | 0 | -100.00 | 0 | |||||
| 2025-07-15 | 13F | Fort Henry Capital, LLC | 22,006 | 0.07 | 1,013 | 5.08 | ||||
| 2025-08-14 | 13F | First Commonwealth Financial Corp /pa/ | 5,000 | 0.00 | 230 | 5.02 | ||||
| 2025-07-25 | 13F | Lodestar Private Asset Management Llc | 122,171 | 9.81 | 5,625 | 15.22 | ||||
| 2025-08-08 | 13F | IMA Wealth, Inc. | 11,244 | 19.78 | 498 | 26.40 | ||||
| 2025-08-11 | 13F | Estate Counselors, LLC | 5,325 | 0.00 | 245 | 5.15 | ||||
| 2025-08-12 | 13F | Archer Investment Corp | 627 | 0.32 | 29 | 3.70 | ||||
| 2025-04-22 | 13F | Duncker Streett & Co Inc | 0 | -100.00 | 0 | -100.00 | ||||
| 2025-07-29 | 13F | Aspiriant, Llc | 38,787 | 30.91 | 1,786 | 37.31 | ||||
| 2025-07-23 | 13F | West Paces Advisors Inc. | 0 | -100.00 | 0 | |||||
| 2025-08-12 | 13F | Global Retirement Partners, LLC | 2,345 | -10.15 | 108 | -5.31 | ||||
| 2025-07-18 | 13F/A | MJT & Associates Financial Advisory Group, Inc. | 65 | 0.00 | 3 | 0.00 | ||||
| 2025-08-01 | 13F | Rossby Financial, LCC | 1,236 | 0.00 | 57 | 5.66 | ||||
| 2025-07-17 | 13F | Northwest Wealth Management, Llc | 4,814 | 0.08 | 222 | 4.74 | ||||
| 2025-08-11 | 13F | FSA Wealth Management LLC | 30 | 0.00 | 2 | 0.00 | ||||
| 2025-08-14 | 13F | Ancora Advisors, LLC | 96 | 0.00 | 4 | 0.00 | ||||
| 2025-08-14 | 13F | Mercer Global Advisors Inc /adv | 0 | -100.00 | 0 | |||||
| 2025-08-04 | 13F | Spire Wealth Management | 427 | -33.49 | 20 | -32.14 | ||||
| 2025-08-07 | 13F | Wealth Forward, LLC | 8,782 | -0.19 | 404 | 4.66 | ||||
| 2025-07-01 | 13F | Private Client Services, Llc | 5,529 | 7.05 | 255 | 12.39 | ||||
| 2025-07-25 | 13F | Concurrent Investment Advisors, LLC | 12,229 | 563 | ||||||
| 2025-08-14 | 13F | Stifel Financial Corp | 17,131 | 33.03 | 789 | 39.47 | ||||
| 2025-07-24 | 13F | Stonebridge Financial Group, LLC | 4,707 | 0.41 | 217 | 5.37 | ||||
| 2025-07-11 | 13F | Farther Finance Advisors, LLC | 1,937 | 85.18 | 89 | 97.78 | ||||
| 2025-08-12 | 13F | SRS Capital Advisors, Inc. | 7,343 | 1.27 | 338 | 6.29 | ||||
| 2025-07-15 | 13F | FLP Wealth Management, LLC | 0 | -100.00 | 0 | |||||
| 2025-07-17 | 13F | Nelson, Van Denburg & Campbell Wealth Management Group, LLC | 20,317 | 3.59 | 935 | 8.72 | ||||
| 2025-08-14 | 13F/A | Barclays Plc | 5,000 | 0 | ||||||
| 2025-08-13 | 13F | Nicolet Advisory Services, Llc | 7,714 | -4.30 | 353 | 3.53 | ||||
| 2025-07-07 | 13F | Thurston, Springer, Miller, Herd & Titak, Inc. | 31,476 | 2,551.73 | 1,449 | 2,686.54 | ||||
| 2025-08-14 | 13F | Ausdal Financial Partners, Inc. | 12,534 | -14.29 | 577 | -9.98 | ||||
| 2025-07-21 | 13F | Ameritas Advisory Services, LLC | 128,093 | 18.26 | 5,897 | 24.10 | ||||
| 2025-08-19 | 13F | Asset Dedication, LLC | 0 | -100.00 | 0 | |||||
| 2025-07-22 | 13F | Unique Wealth, Llc | 14,286 | -8.34 | 658 | -3.81 | ||||
| 2025-07-25 | 13F | Cwm, Llc | 3,944 | -18.80 | 0 | |||||
| 2025-08-12 | 13F | Insigneo Advisory Services, Llc | 27,882 | 0.09 | 1,284 | 4.99 | ||||
| 2025-08-05 | 13F | Integrity Financial Corp /WA | 12,462 | -6.18 | 574 | -1.55 | ||||
| 2025-07-22 | 13F | Mascoma Wealth Management LLC | 128 | -60.37 | 6 | -64.29 | ||||
| 2025-05-12 | 13F | Aveo Capital Partners, LLC | 0 | -100.00 | 0 | |||||
| 2025-07-28 | 13F | Harbour Investments, Inc. | 22,970 | 28.56 | 1,058 | 34.99 | ||||
| 2025-07-09 | 13F | Westmount Partners, LLC | 4,367 | -8.79 | 201 | -4.29 | ||||
| 2025-09-03 | 13F | American Trust | 98,085 | 4,516 | ||||||
| 2025-07-30 | 13F | Mason & Associates, LLC | 8,271 | -25.89 | 381 | -22.29 | ||||
| 2025-08-11 | 13F | Aptus Capital Advisors, LLC | 111 | -3.48 | 5 | 0.00 | ||||
| 2025-07-14 | 13F | AdvisorNet Financial, Inc | 3,908 | 6.49 | 180 | 11.18 | ||||
| 2025-08-12 | 13F | Seeds Investor Llc | 70,234 | 897.78 | 3,234 | 949.68 | ||||
| 2025-08-14 | 13F | Ameriprise Financial Inc | 281,931 | 6.74 | 12,995 | 11.70 | ||||
| 2025-05-13 | 13F | CacheTech Inc. | 0 | -100.00 | 0 | |||||
| 2025-05-14 | 13F | Orion Portfolio Solutions, LLC | 10,630 | 0.00 | 462 | 0.00 | ||||
| 2025-05-30 | NP | ERNZ - TrueShares Active Yield ETF | 3,154 | 138 | ||||||
| 2025-07-23 | 13F | TPG Financial Advisors, LLC | 4,903 | -3.54 | 226 | 0.90 | ||||
| 2025-08-11 | 13F | Nomura Asset Management Co Ltd | 5,500 | 0.00 | 253 | 4.98 | ||||
| 2025-07-25 | 13F | Atria Wealth Solutions, Inc. | 14,784 | -29.26 | 681 | -25.85 | ||||
| 2025-07-28 | 13F | RFG Advisory, LLC | 11,763 | 0.95 | 542 | 5.87 | ||||
| 2025-07-11 | 13F | Mkd Wealth Coaches, Llc | 6,528 | 7.53 | 301 | 12.78 | ||||
| 2025-07-17 | 13F | Wolff Wiese Magana Llc | 629 | 0.32 | 29 | 3.70 | ||||
| 2025-08-12 | 13F | Proequities, Inc. | 0 | 0 | ||||||
| 2025-05-02 | 13F | Capital A Wealth Management, LLC | 1,011 | -27.27 | 44 | -26.67 | ||||
| 2025-07-15 | 13F | Legacy Financial Group LLC | 16,388 | 3.79 | 755 | 8.96 | ||||
| 2025-08-06 | 13F | Golden State Wealth Management, LLC | 0 | -100.00 | 0 | |||||
| 2025-08-08 | 13F | Investment Partners, Ltd. | 9,552 | 0.58 | 440 | 5.53 | ||||
| 2025-08-18 | 13F | Pacific Center for Financial Services | 1,554 | 0.58 | 72 | 5.97 | ||||
| 2025-07-08 | 13F | Nbc Securities, Inc. | 200 | -78.95 | 0 | |||||
| 2025-07-24 | 13F | McKinley Carter Wealth Services, Inc. | 6,078 | -0.51 | 280 | 4.10 | ||||
| 2025-07-18 | 13F | SOA Wealth Advisors, LLC. | 2,659 | -17.68 | 122 | -13.48 | ||||
| 2025-08-04 | 13F | Pensionmark Financial Group, Llc | 18,254 | 19.79 | 840 | 25.75 | ||||
| 2025-07-24 | 13F | JNBA Financial Advisors | 1,027 | -0.77 | 47 | 4.44 | ||||
| 2025-08-13 | 13F | Lido Advisors, LLC | 8,005 | 0.20 | 369 | 5.14 | ||||
| 2025-08-07 | 13F | Runnymede Capital Advisors, Inc. | 0 | -100.00 | 0 | |||||
| 2025-07-17 | 13F | Kavar Capital Partners Group, Llc | 267,607 | 12,321 | ||||||
| 2025-08-01 | 13F | Brinker Capital Investments, LLC | 0 | -100.00 | 0 | -100.00 | ||||
| 2025-08-08 | 13F | Avantax Advisory Services, Inc. | 21,422 | 6.58 | 986 | 11.79 | ||||
| 2025-08-14 | 13F | Harwood Advisory Group, LLC | 2,526 | -9.85 | 116 | -4.13 | ||||
| 2025-08-08 | 13F | Thrive Capital Management, LLC | 27,346 | 1,259 | ||||||
| 2025-08-04 | 13F | Jim Saulnier & Associates, Llc | 27,651 | -3.00 | 1,273 | 1.84 | ||||
| 2025-08-06 | 13F | AE Wealth Management LLC | 104,045 | 452.08 | 4,790 | 479.90 | ||||
| 2025-08-07 | 13F | CENTRAL TRUST Co | 10,117 | -8.05 | 466 | -3.53 | ||||
| 2025-07-30 | 13F | Onyx Bridge Wealth Group LLC | 76,073 | -0.52 | 3,502 | 4.38 | ||||
| 2025-08-06 | 13F | Richard Bernstein Advisors LLC | 57 | 1,325.00 | 3 | |||||
| 2025-07-18 | 13F | SimpliFi, Inc. | 8,443 | 0.40 | 389 | 5.43 | ||||
| 2025-08-14 | 13F | Mendel Capital Management LLC | 9,280 | 0.00 | 427 | 4.91 | ||||
| 2025-08-01 | 13F | Taylor Financial Group, Inc. | 68,457 | 13.50 | 3,152 | 19.09 | ||||
| 2025-08-08 | 13F | Foundations Investment Advisors, LLC | 502,887 | 17.78 | 23,153 | 23.58 | ||||
| 2025-07-31 | 13F | Ssa Swiss Advisors Ag | 4,433 | -93.75 | 204 | -93.44 | ||||
| 2025-08-13 | 13F | Scotia Capital Inc. | 5,934 | 8.21 | 273 | 13.75 | ||||
| 2025-08-11 | 13F | Cornerstone Planning Group LLC | 4,081 | -7.82 | 188 | -1.58 | ||||
| 2025-08-14 | 13F | Bank Of America Corp /de/ | 200,005 | 0.55 | 9,208 | 5.50 | ||||
| 2025-07-17 | 13F | Sound Income Strategies, LLC | 1,032 | 48 | ||||||
| 2025-08-13 | 13F | StoneX Group Inc. | 9,582 | -7.90 | 441 | -3.29 | ||||
| 2025-07-15 | 13F | RTD Financial Advisors, Inc. | 8,771 | 0.09 | 404 | 4.95 | ||||
| 2025-08-13 | 13F | Plan Group Financial, LLC | 16,103 | -2.84 | 741 | 1.93 | ||||
| 2025-08-14 | 13F | Eight 31 Financial Llc | 21,517 | 1.09 | 991 | 6.00 | ||||
| 2025-07-23 | 13F | Clear Creek Financial Management, LLC | 13,248 | -4.18 | 610 | 0.50 | ||||
| 2025-08-15 | 13F | Equitable Holdings, Inc. | 7,057 | 18.70 | 325 | 24.62 | ||||
| 2025-07-28 | 13F | Sagespring Wealth Partners, Llc | 6,803 | -0.38 | 313 | 4.68 | ||||
| 2025-08-14 | 13F | Gould Capital, LLC | 95 | -94.31 | 4 | -94.52 | ||||
| 2025-07-24 | 13F | IFP Advisors, Inc | 411 | 0.00 | 19 | 0.00 | ||||
| 2025-07-29 | 13F | Signature Estate & Investment Advisors Llc | 4,364 | 201 | ||||||
| 2025-08-13 | 13F | Jones Financial Companies Lllp | 17,606 | 39.14 | 808 | 45.67 | ||||
| 2025-09-04 | 13F/A | Advisor Group Holdings, Inc. | 231,706 | 2.58 | 10,666 | 7.61 | ||||
| 2025-08-14 | 13F | Sentinus, LLC | 20,891 | 35.85 | 962 | 42.58 | ||||
| 2025-07-09 | 13F | LifePlan Financial, LLC | 37,643 | -0.89 | 1,733 | 4.02 | ||||
| 2025-08-14 | 13F | IHT Wealth Management, LLC | 7,938 | -7.02 | 365 | -2.41 | ||||
| 2025-08-14 | 13F | Fmr Llc | 3,867 | 31.13 | 178 | 37.98 | ||||
| 2025-08-14 | 13F | Royal Bank Of Canada | 277,462 | 0.75 | 12,774 | 5.71 | ||||
| 2025-08-08 | 13F | Creative Planning | 6,202 | 25.44 | 286 | 31.94 | ||||
| 2025-08-04 | 13F | Syverson Strege & Co | 7,353 | 1.11 | 339 | 5.96 | ||||
| 2025-04-22 | 13F | Castleview Partners, Llc | 0 | -100.00 | 0 | |||||
| 2025-08-15 | 13F | Kestra Advisory Services, LLC | 43,206 | 8.66 | 1,989 | 14.05 | ||||
| 2025-08-11 | 13F | Private Advisor Group, LLC | 45,927 | 441.91 | 2,114 | 469.81 | ||||
| 2025-08-12 | 13F | Hanover Advisors Inc | 5,890 | 271 | ||||||
| 2025-03-12 | 13F/A | Private Capital Management Llc | 3,298 | -8.77 | 142 | -8.44 | ||||
| 2025-08-08 | 13F | Comprehensive Financial Planning, Inc./PA | 1,177 | 0.68 | 54 | 5.88 | ||||
| 2025-08-14 | 13F | Warren Averett Asset Management, LLC | 77,284 | 2.98 | 3,558 | 8.08 | ||||
| 2025-08-14 | 13F | Visionary Wealth Advisors | 7,921 | 7.07 | 365 | 12.35 | ||||
| 2025-08-11 | 13F | Brown Brothers Harriman & Co | 1,645 | 76 | ||||||
| 2025-08-13 | 13F | Capital Analysts, Inc. | 373 | -1.58 | 0 | |||||
| 2025-08-04 | 13F | Creekmur Asset Management LLC | 209 | 0.00 | 10 | 0.00 | ||||
| 2025-05-13 | 13F | Compass Financial Group, INC/SD | 0 | -100.00 | 0 | |||||
| 2025-07-14 | 13F | Financial Enhancement Group LLC | 6,246 | 0.00 | 285 | 6.37 | ||||
| 2025-08-04 | 13F | Creative Financial Designs Inc /adv | 425 | 507.14 | 20 | 533.33 | ||||
| 2025-05-12 | 13F | Independent Advisor Alliance | 0 | -100.00 | 0 | |||||
| 2025-05-08 | 13F | Great Valley Advisor Group, Inc. | 0 | -100.00 | 0 | -100.00 | ||||
| 2025-07-18 | 13F | Northstar Group, Inc. | 18,100 | -1.66 | 833 | 3.22 | ||||
| 2025-04-01 | 13F | First Financial Bank - Trust Division | 0 | -100.00 | 0 | |||||
| 2025-08-08 | 13F | CFO4Life Group, LLC | 7,935 | 0.00 | 365 | 4.89 | ||||
| 2025-08-14 | 13F | Smartleaf Asset Management LLC | 239 | 11 | ||||||
| 2025-07-23 | 13F | Nbt Bank N A /ny | 75 | 0.00 | 3 | 0.00 | ||||
| 2025-08-14 | 13F | TCG Advisory Services, LLC | 280,175 | 2.32 | 12,899 | 7.36 | ||||
| 2025-08-14 | 13F | Integrated Wealth Concepts LLC | 19,319 | 170.76 | 889 | 184.03 | ||||
| 2025-08-11 | 13F | Pineridge Advisors LLC | 955 | 0.21 | 44 | 4.88 | ||||
| 2025-07-31 | 13F | Heirloom Wealth Management | 9,528 | 11.48 | 439 | 16.80 | ||||
| 2025-07-10 | 13F | Focus Financial Network, Inc. | 97,221 | -23.04 | 4,476 | -19.25 | ||||
| 2025-07-30 | 13F | Brookstone Capital Management | 74,295 | -8.99 | 3,421 | -4.52 | ||||
| 2025-07-31 | 13F | Glass Jacobson Investment Advisors llc | 0 | -100.00 | 0 | |||||
| 2025-08-15 | 13F | High Falls Advisors, Inc | 0 | -100.00 | 0 | |||||
| 2025-07-16 | 13F | Leading Edge Financial Planning LLC | 7,370 | 0.00 | 339 | 4.95 | ||||
| 2025-07-03 | 13F | Fiduciary Financial Group, Llc | 4,914 | 0.53 | 226 | 9.22 | ||||
| 2025-08-15 | 13F | Morgan Stanley | 408,327 | -27.90 | 18,799 | -24.36 | ||||
| 2025-07-31 | 13F | Cardinal Point Capital Management, ULC | 4,384 | 202 | ||||||
| 2025-08-08 | 13F | Gts Securities Llc | 41,627 | 77.73 | 1,917 | 86.56 | ||||
| 2025-08-01 | 13F | Austin Private Wealth, LLC | 6,955 | 0.00 | 320 | 4.92 | ||||
| 2025-07-17 | 13F | Tempus Wealth Planning, LLC | 8,394 | -3.65 | 386 | 1.05 | ||||
| 2025-08-08 | 13F | Capital Investment Advisory Services, LLC | 1,883 | -22.00 | 87 | -18.10 | ||||
| 2025-08-11 | 13F | Bellwether Advisors, LLC | 372 | 5.38 | 17 | 13.33 | ||||
| 2025-08-05 | 13F | Integrity Wealth Solutions LLC | 4,466 | 206 | ||||||
| 2025-08-14 | 13F | Aqr Capital Management Llc | 4,894 | 225 | ||||||
| 2025-07-21 | 13F | Consilium Wealth Advisory, LLC | 92,966 | 10.39 | 4,280 | 15.83 | ||||
| 2025-08-18 | 13F | N.E.W. Advisory Services LLC | 0 | -100.00 | 0 | |||||
| 2025-07-22 | 13F | Wealthcare Advisory Partners LLC | 5,898 | 0.77 | 272 | 5.86 | ||||
| 2025-08-13 | 13F | Royal Fund Management, LLC | 106,655 | 2.41 | 4,910 | 7.23 | ||||
| 2025-07-18 | 13F | Truist Financial Corp | 90,280 | 0.13 | 4,156 | 5.06 | ||||
| 2025-07-01 | 13F | Harbor Investment Advisory, Llc | 1,487 | 1.71 | 68 | 6.25 | ||||
| 2025-07-25 | 13F | Concord Wealth Partners | 186 | 0.54 | 9 | 0.00 | ||||
| 2025-08-12 | 13F | Archvest Wealth Advisors, Inc. | 5,615 | 2.74 | 259 | 7.95 | ||||
| 2025-08-12 | 13F | Jpmorgan Chase & Co | 45,472 | 148.26 | 2,094 | 160.65 | ||||
| 2025-08-12 | 13F | Financial Advocates Investment Management | 89,455 | 3.45 | 4,119 | 8.54 | ||||
| 2025-08-12 | 13F | BlueStem Wealth Partners, LLC | 28,606 | -9.29 | 1,317 | -4.77 | ||||
| 2025-08-15 | 13F | Kestra Investment Management, LLC | 900 | 0.00 | 39 | 0.00 | ||||
| 2025-07-15 | 13F | Garrett Investment Advisors LLC | 5,414 | -7.56 | 249 | -3.11 | ||||
| 2025-08-12 | 13F | Wayfinding Financial, LLC | 0 | -100.00 | 0 | |||||
| 2025-08-13 | 13F | Townsquare Capital Llc | 0 | -100.00 | 0 | |||||
| 2025-08-14 | 13F | Qube Research & Technologies Ltd | 355 | -85.32 | 16 | -84.91 | ||||
| 2025-07-24 | 13F | Brandywine Oak Private Wealth Llc | 0 | -100.00 | 0 | |||||
| 2025-05-13 | 13F | Adams Wealth Management | 0 | -100.00 | 0 | |||||
| 2025-08-04 | 13F | Atria Investments Llc | 4,683 | 216 | ||||||
| 2025-08-04 | 13F | Assetmark, Inc | 868 | 191.28 | 40 | 200.00 | ||||
| 2025-04-15 | 13F | Noble Wealth Management PBC | 13 | 0.00 | 1 | |||||
| 2025-08-11 | 13F | One Capital Management, LLC | 33,141 | -48.34 | 1,526 | -45.83 | ||||
| 2025-08-14 | 13F | CoreCap Advisors, LLC | 3,783 | 9.34 | 174 | 15.23 | ||||
| 2025-04-11 | 13F | Congress Asset Management Co /ma | 0 | -100.00 | 0 | |||||
| 2025-08-07 | 13F | Allworth Financial LP | 3,287 | -2.26 | 151 | 3.42 | ||||
| 2025-08-11 | 13F | United Capital Financial Advisers, Llc | 8,881 | -1.82 | 409 | 3.03 | ||||
| 2025-08-11 | 13F | TRUE Private Wealth Advisors | 58,524 | -2.81 | 2,694 | 1.97 | ||||
| 2025-07-08 | 13F | Gallacher Capital Management LLC | 25,528 | 3.25 | 1,175 | 8.39 | ||||
| 2025-07-17 | 13F | Smith Anglin Financial, LLC | 51,096 | -2.15 | 2,352 | 2.66 | ||||
| 2025-08-07 | 13F | Resources Investment Advisors, LLC. | 6,963 | 321 | ||||||
| 2025-07-25 | 13F | Sovereign Financial Group, Inc. | 20,735 | 2.95 | 955 | 8.04 | ||||
| 2025-07-29 | 13F | Salomon & Ludwin, LLC | 1,780 | 0.00 | 82 | 3.85 | ||||
| 2025-08-06 | 13F | Vestmark Advisory Solutions, Inc. | 0 | -100.00 | 0 | |||||
| 2025-08-05 | 13F | Atlas Private Wealth Advisors | 8,392 | 0.00 | 386 | 4.89 | ||||
| 2025-07-17 | 13F | Archford Capital Strategies, LLC | 7,407 | -5.58 | 341 | -0.87 | ||||
| 2025-08-11 | 13F | Elite Financial, Inc. | 0 | -100.00 | 0 | |||||
| 2025-08-12 | 13F | BlackRock, Inc. | 2,926,402 | 0.55 | 134,732 | 5.50 | ||||
| 2025-07-18 | 13F | Marino, Stram & Associates Llc | 17,494 | -0.31 | 805 | 4.68 | ||||
| 2025-08-14 | 13F | Oxford Financial Group Ltd | 552 | 0.00 | 25 | 4.17 | ||||
| 2025-08-14 | 13F | Fort Point Capital Partners LLC | 9,951 | -4.49 | 458 | 0.22 | ||||
| 2025-08-14 | 13F | GWM Advisors LLC | 19,186 | 0.78 | 883 | 5.75 | ||||
| 2025-05-14 | 13F | Zacks Investment Management | 0 | -100.00 | 0 | |||||
| 2025-07-14 | 13F | UMA Financial Services, Inc. | 2,047 | 94 | ||||||
| 2025-05-02 | 13F | Transcendent Capital Group LLC | 0 | -100.00 | 0 | |||||
| 2025-07-29 | 13F | Stratos Wealth Partners, LTD. | 10,504 | 2.46 | 484 | 7.57 | ||||
| 2025-07-28 | 13F | Mutual Advisors, LLC | 69,302 | 0.29 | 3,197 | 5.93 | ||||
| 2025-08-13 | 13F | GeoWealth Management, LLC | 16,584 | -51.93 | 763 | -49.57 | ||||
| 2025-08-14 | 13F | Godshalk Welsh Capital Management, Inc. | 17,821 | 0.14 | 820 | 5.13 | ||||
| 2025-07-17 | 13F | Moss Adams Wealth Advisors LLC | 9,179 | 0.38 | 423 | 5.24 | ||||
| 2025-04-14 | 13F | NewSquare Capital LLC | 0 | -100.00 | 0 | |||||
| 2025-07-16 | 13F/A | CX Institutional | 234 | 0.00 | 0 | |||||
| 2025-07-23 | 13F | Venturi Wealth Management, LLC | 5,655 | 9.83 | 260 | 15.56 | ||||
| 2025-07-31 | 13F | United Community Bank | 500 | 0.00 | 23 | 9.52 | ||||
| 2025-07-31 | 13F | Oppenheimer Asset Management Inc. | 0 | -100.00 | 0 | |||||
| 2025-08-05 | 13F | Carolinas Wealth Consulting Llc | 0 | -100.00 | 0 | -100.00 | ||||
| 2025-08-12 | 13F | Wood Tarver Financial Group, LLC | 465 | -8.28 | 0 | -100.00 | ||||
| 2025-08-05 | 13F | Claro Advisors LLC | 6,350 | 0.79 | 292 | 5.80 | ||||
| 2025-08-06 | 13F | Commonwealth Equity Services, Llc | 141,683 | 1.84 | 7 | 0.00 | ||||
| 2025-08-14 | 13F | Aprio Wealth Management, LLC | 5,700 | 0.00 | 262 | 4.80 | ||||
| 2025-08-06 | 13F | SOUTH STATE Corp | 1,019 | -56.86 | 47 | -55.34 | ||||
| 2025-04-22 | 13F | Flagship Harbor Advisors, Llc | 0 | -100.00 | 0 | |||||
| 2025-08-05 | 13F | Prosperity Consulting Group, LLC | 28,849 | 16.43 | 1,328 | 22.17 | ||||
| 2025-08-14 | 13F | UBS Group AG | 35,935 | -37.74 | 1,654 | -34.68 |