Mga Batayang Estadistika
| Pemilik Institusional | 334 total, 334 long only, 0 short only, 0 long/short - change of 4.70% MRQ |
| Alokasi Portofolio Rata-rata | 0.4585 % - change of -7.19% MRQ |
| Saham Institusional (Jangka Panjang) | 107,437,905 (ex 13D/G) - change of 9.99MM shares 10.25% MRQ |
| Nilai Institusional (Jangka Panjang) | $ 3,558,886 USD ($1000) |
Kepemilikan Institusional dan Pemegang Saham
Capital Group Core Equity ETF (US:CGUS) memiliki 334 pemilik institusional dan pemegang saham yang telah mengajukan formulir 13D/G atau 13F kepada Komisi Bursa Efek (Securities Exchange Commission/SEC). Lembaga-lembaga ini memegang total 107,437,905 saham. Pemegang saham terbesar meliputi LPL Financial LLC, Envestnet Asset Management Inc, Raymond James Financial Inc, Morgan Stanley, Cetera Investment Advisers, Capital Group Private Client Services, Inc., Northwestern Mutual Wealth Management Co, Jones Financial Companies Lllp, Commonwealth Equity Services, Llc, and Wells Fargo & Company/mn .
Struktur kepemilikan institusional Capital Group Core Equity ETF (ARCA:CGUS) menunjukkan posisi terkini di perusahaan oleh institusi dan dana, serta perubahan terbaru dalam ukuran posisi. Pemegang saham utama dapat mencakup investor individu, reksa dana, dana lindung nilai, atau institusi. Jadwal 13D menunjukkan bahwa investor memegang (atau pernah memegang) lebih dari 5% saham perusahaan dan bermaksud (atau pernah bermaksud) untuk secara aktif mengejar perubahan strategi bisnis. Jadwal 13G menunjukkan investasi pasif lebih dari 5%.
The share price as of September 3, 2025 is 38.43 / share. Previously, on September 4, 2024, the share price was 33.06 / share. This represents an increase of 16.24% over that period.

Skor Sentimen Dana
Skor Sentimen Dana (sebelumnya dikenal sebagai Skor Akumulasi Kepemilikan) menemukan saham-saham yang paling banyak dibeli oleh dana. Ini adalah hasil dari model kuantitatif multi-faktor yang canggih yang mengidentifikasi perusahaan dengan tingkat akumulasi institusional tertinggi. Model penilaian menggunakan kombinasi dari total peningkatan pemilik yang diungkapkan, perubahan dalam alokasi portofolio pada pemilik tersebut, dan metrik lainnya. Angka berkisar dari 0 hingga 100, dengan angka yang lebih tinggi menunjukkan tingkat akumulasi yang lebih tinggi dibandingkan dengan perusahaan sejenisnya, dan 50 adalah rata-ratanya.
Frekuensi Pembaruan: Setiap Hari
Lihat Ownership Explorer, yang menyediakan daftar perusahaan dengan peringkat tertinggi.
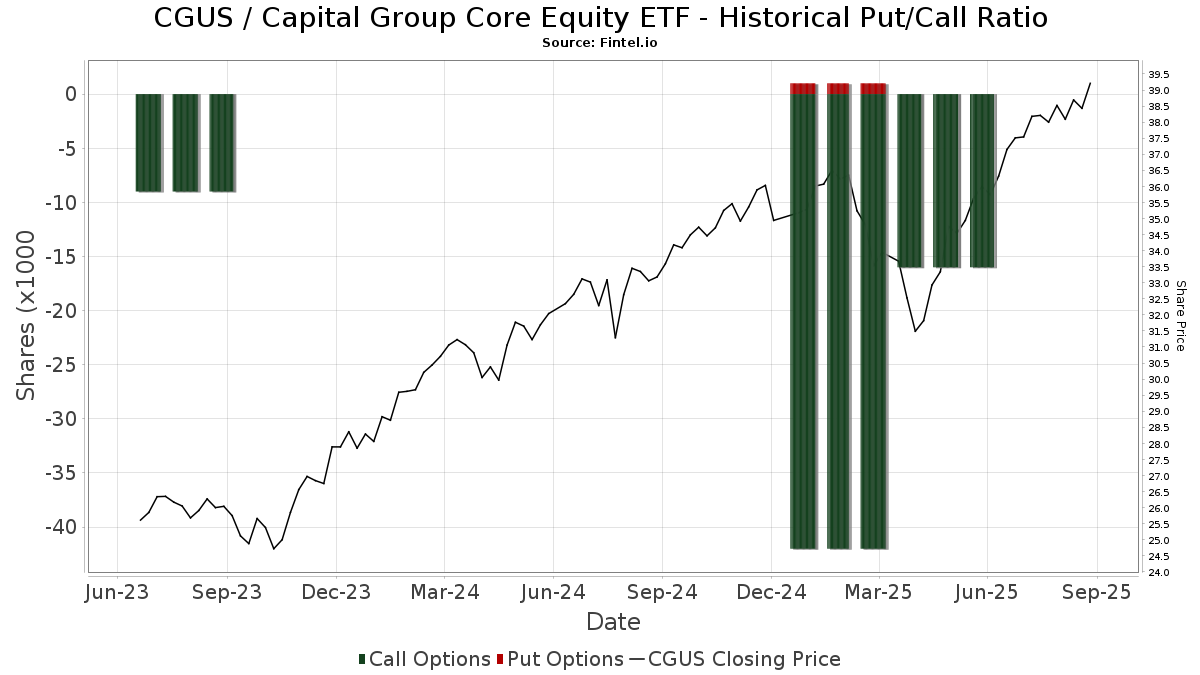
Rasio Put/Call Institusional
Selain melaporkan isu ekuitas dan utang standar, institusi dengan aset di bawah manajemen lebih dari 100 juta dolar AS juga harus mengungkapkan kepemilikan opsi put dan call mereka. Karena opsi put umumnya menunjukkan sentimen negatif, dan opsi call menunjukkan sentimen positif, kita dapat mengetahui sentimen institusional secara keseluruhan dengan memplot rasio put terhadap call. Grafik di sebelah kanan memplot rasio put/call historis untuk instrumen ini.
Menggunakan Rasio Put/Call sebagai indikator sentimen investor mengatasi salah satu kekurangan utama dari penggunaan total kepemilikan institusional, yaitu sejumlah besar aset yang dikelola diinvestasikan secara pasif untuk melacak indeks. Dana yang dikelola secara pasif biasanya tidak membeli opsi, sehingga indikator rasio put/call lebih akurat dalam melacak sentimen dana yang dikelola secara aktif.
Pengajuan 13F dan NPORT
Detail pada pengajuan 13F tersedia gratis. Detail pada pengajuan NP memerlukan keanggotaan premium. Baris berwarna hijau menunjukkan posisi baru. Baris berwarna merah menunjukkan posisi yang sudah ditutup. Klik tautan ini ikon untuk melihat riwayat transaksi selengkapnya.
Tingkatkan
untuk membuka data premium dan mengekspor ke Excel ![]() .
.
| Tanggal File | Sumber | Investor | Ketik | Presyo ng Avg (Silangan) |
Saham | Δ Saham (%) |
Dilaporkan Nilai ($1000) |
Nilai Δ (%) |
Alokasi Port (%) |
|
|---|---|---|---|---|---|---|---|---|---|---|
| 2025-07-22 | 13F | Merit Financial Group, LLC | 122,226 | 16.87 | 4,514 | 29.20 | ||||
| 2025-08-12 | 13F | Steward Partners Investment Advisory, Llc | 42,666 | 55.62 | 1,576 | 72.13 | ||||
| 2025-04-17 | 13F | Cornerstone Wealth Advisors, Inc. | 0 | -100.00 | 0 | |||||
| 2025-07-24 | 13F | Blair William & Co/il | 159,403 | 2.44 | 5,887 | 13.26 | ||||
| 2025-08-12 | 13F | Rather & Kittrell, Inc. | 10,064 | 0.80 | 372 | 11.41 | ||||
| 2025-08-14 | 13F | UBS Group AG | 1,447,626 | 61.67 | 53,461 | 78.75 | ||||
| 2025-08-13 | 13F | Certior Financial Group, Llc | 21,483 | -7.29 | 793 | 2.59 | ||||
| 2025-08-14 | 13F | TCG Advisory Services, LLC | 750,208 | 7.23 | 27,705 | 18.56 | ||||
| 2025-04-16 | 13F | Salem Investment Counselors Inc | 0 | -100.00 | 0 | |||||
| 2025-07-30 | 13F | Bogart Wealth, LLC | 514 | 0.00 | 19 | 5.88 | ||||
| 2025-08-04 | 13F | Atria Investments Llc | 9,633 | 26.68 | 356 | 40.32 | ||||
| 2025-08-08 | 13F | Advyzon Investment Management, LLC | 34,249 | 0.76 | 1,265 | 11.37 | ||||
| 2025-07-22 | 13F | Siligmueller & Norvid Wealth Advisors LLC | 57,722 | -15.62 | 2,167 | -5.17 | ||||
| 2025-07-22 | 13F | Belpointe Asset Management LLC | 24,567 | -0.61 | 907 | 9.94 | ||||
| 2025-07-08 | 13F | Everpar Advisors Llc | 16,856 | -0.18 | 622 | 10.48 | ||||
| 2025-07-23 | 13F | Cannon Wealth Management Services, LLC | 222,851 | 6.36 | 8,230 | 17.81 | ||||
| 2025-08-11 | 13F | Advisor Resource Council | 0 | -100.00 | 0 | |||||
| 2025-07-29 | 13F | Signature Estate & Investment Advisors Llc | 70,874 | 0.92 | 2,617 | 11.60 | ||||
| 2025-07-25 | 13F | Hazlett, Burt & Watson, Inc. | 1,000 | 0.00 | 0 | |||||
| 2025-07-22 | 13F | Woodmont Investment Counsel Llc | 103,409 | 12.72 | 3,819 | 24.61 | ||||
| 2025-07-22 | 13F | Wealthcare Advisory Partners LLC | 264,366 | 12.73 | 9,763 | 24.66 | ||||
| 2025-08-11 | 13F | Private Advisor Group, LLC | 1,199,797 | 4.19 | 44,309 | 15.21 | ||||
| 2025-07-29 | 13F | Koshinski Asset Management, Inc. | 51,326 | 12.55 | 1,895 | 24.43 | ||||
| 2025-08-06 | 13F | Mascagni Wealth Management, Inc. | 18,338 | -29.72 | 677 | -22.27 | ||||
| 2025-07-29 | 13F | Balboa Wealth Partners | 8,795 | 325 | ||||||
| 2025-07-29 | 13F | Burford Brothers, Inc. | 332,972 | -2.13 | 12,296 | 8.21 | ||||
| 2025-08-07 | 13F | Cvfg Llc | 15,170 | 11.14 | 560 | 23.08 | ||||
| 2025-08-14 | 13F | Wells Fargo & Company/mn | 3,137,696 | 6.52 | 115,875 | 17.78 | ||||
| 2025-08-11 | 13F | Principal Securities, Inc. | 267,142 | 21.87 | 9,866 | 28.70 | ||||
| 2025-08-12 | 13F | Lodestone Wealth Management LLC | 60,558 | 0.32 | 2,236 | 10.91 | ||||
| 2025-08-12 | 13F | Indie Asset Partners, LLC | 6,689 | -1.47 | 247 | 9.29 | ||||
| 2025-08-13 | 13F | Beacon Pointe Advisors, LLC | 116,048 | 4,286 | ||||||
| 2025-08-14 | 13F | Florida Financial Advisors, Llc | 0 | -100.00 | 0 | |||||
| 2025-07-28 | 13F | Sagespring Wealth Partners, Llc | 185,471 | 8.14 | 6,849 | 19.57 | ||||
| 2025-08-13 | 13F | Capital Group Private Client Services, Inc. | 4,412,415 | 2.88 | 162,951 | 13.75 | ||||
| 2025-08-08 | 13F | Gts Securities Llc | 0 | -100.00 | 0 | |||||
| 2025-08-12 | 13F | Jpmorgan Chase & Co | 22,025 | -23.08 | 813 | -14.96 | ||||
| 2025-05-14 | 13F | Oarsman Capital, Inc. | 0 | -100.00 | 0 | -100.00 | ||||
| 2025-07-31 | 13F | Hanlon Investment Management, Inc. | 15,678 | 1.79 | 579 | 12.45 | ||||
| 2025-08-18 | 13F | Tyler-Stone Wealth Management | 16,282 | 15.42 | 601 | 27.60 | ||||
| 2025-08-13 | 13F | Advisor Group Holdings, Inc. | 1,045,478 | -30.74 | 36,560 | -27.49 | ||||
| 2025-07-25 | 13F | Cwm, Llc | 580,783 | 3.77 | 21 | 16.67 | ||||
| 2025-07-22 | 13F | DAVENPORT & Co LLC | 21,458 | 3.79 | 792 | 14.78 | ||||
| 2025-08-14 | 13F | Wiley Bros.-aintree Capital, Llc | 456,595 | 21.38 | 16,888 | 34.67 | ||||
| 2025-07-24 | 13F | IFP Advisors, Inc | 380,451 | 10.51 | 14,050 | 22.18 | ||||
| 2025-07-16 | 13F | Kerntke Otto McGlone Wealth Management Group | 19,620 | 21.48 | 725 | 34.32 | ||||
| 2025-07-29 | 13F | International Assets Investment Management, Llc | 15,933 | 67.10 | 588 | 84.91 | ||||
| 2025-07-25 | 13F | Atria Wealth Solutions, Inc. | 288,796 | -19.77 | 10,703 | -11.19 | ||||
| 2025-08-12 | 13F | NWF Advisory Services Inc. | 6,717 | -6.11 | 224 | -10.40 | ||||
| 2025-07-10 | 13F | Kmg Fiduciary Partners, Llc | 48,842 | -3.49 | 1,804 | 6.69 | ||||
| 2025-08-12 | 13F | AlphaCore Capital LLC | 12,343 | 0.64 | 457 | 11.46 | ||||
| 2025-08-12 | 13F/A | Cozad Asset Management Inc | 33,013 | 16.41 | 1,219 | 28.72 | ||||
| 2025-08-04 | 13F | Bay Colony Advisory Group, Inc d/b/a Bay Colony Advisors | 12,337 | 0.24 | 456 | 11.25 | ||||
| 2025-08-12 | 13F | Coldstream Capital Management Inc | 0 | -100.00 | 0 | |||||
| 2025-08-15 | 13F | High Falls Advisors, Inc | 15,876 | 5.65 | 586 | 16.97 | ||||
| 2025-07-25 | 13F | Northwest Capital Management Inc | 3,134 | 0.00 | 116 | 10.58 | ||||
| 2025-08-08 | 13F | Kingsview Wealth Management, LLC | 253,557 | 28.59 | 9,364 | 42.19 | ||||
| 2025-08-07 | 13F | Commerce Bank | 5,419 | -19.35 | 200 | -10.71 | ||||
| 2025-08-11 | 13F | Forge Financial Services LLC | 389,756 | 7.57 | 14,589 | 20.55 | ||||
| 2025-08-14 | 13F | Royal Bank Of Canada | 1,922,030 | -2.67 | 70,980 | 7.62 | ||||
| 2025-08-14 | 13F | Great Valley Advisor Group, Inc. | 194,938 | 24.09 | 7,199 | 37.23 | ||||
| 2025-07-21 | 13F | Investment Planning Advisors, Inc. | 788,011 | 20.79 | 29,101 | 33.56 | ||||
| 2025-08-08 | 13F | CWS Financial Advisors, LLC | 40,581 | 6.66 | 1,499 | 17.95 | ||||
| 2025-08-04 | 13F | Bridgewealth Advisory Group, LLC | 267,169 | 44.00 | 9,867 | 59.23 | ||||
| 2025-08-11 | 13F | Aptus Capital Advisors, LLC | 61,102 | -0.92 | 2,256 | 9.57 | ||||
| 2025-08-11 | 13F | United Advisor Group, LLC | 10,729 | 2.43 | 396 | 13.47 | ||||
| 2025-08-14 | 13F | Benjamin Edwards Inc | 470,078 | 27.42 | 17,360 | 40.89 | ||||
| 2025-07-21 | 13F | Patriot Financial Group Insurance Agency, LLC | 28,329 | 9.33 | 1,046 | 20.92 | ||||
| 2025-08-14 | 13F | Mpwm Advisory Solutions, Llc | 35 | 0.00 | 1 | 0.00 | ||||
| 2025-07-31 | 13F | 180 Wealth Advisors, Llc | 31,269 | 1.29 | 1,155 | 11.93 | ||||
| 2025-08-05 | 13F | Summit Investment Advisory Services, LLC | 0 | -100.00 | 0 | |||||
| 2025-08-06 | NP | LINCOLN VARIABLE INSURANCE PRODUCTS TRUST - LVIP American Funds Vanguard Active Passive Growth Fund Standard Class | 1,790 | 66 | ||||||
| 2025-07-08 | 13F | Advance Capital Management, Inc. | 7,430 | -9.45 | 274 | 0.00 | ||||
| 2025-08-04 | 13F | Arkadios Wealth Advisors | 13,415 | 1.92 | 495 | 12.76 | ||||
| 2025-08-04 | 13F | Integrity Alliance, Llc. | 0 | -100.00 | 0 | |||||
| 2025-07-16 | 13F | Midwest Heritage Bank, FSB | 978,124 | 3.03 | 36,122 | 13.92 | ||||
| 2025-07-28 | 13F | Holistic Planning, LLC | 15,691 | 45.95 | 579 | 61.28 | ||||
| 2025-08-14 | 13F | Sunbelt Securities, Inc. | 240,929 | 3.34 | 8,425 | 8.19 | ||||
| 2025-07-23 | 13F | Clear Creek Financial Management, LLC | 118,786 | 6.79 | 4,387 | 18.06 | ||||
| 2025-07-29 | 13F | Latitude Advisors, LLC | 48,669 | 2.89 | 1,797 | 13.81 | ||||
| 2025-08-05 | 13F | Hunter Associates Investment Management Llc | 16,300 | 0.00 | 1 | |||||
| 2025-08-12 | 13F | Titleist Asset Management, Llc | 7,989 | -1.69 | 295 | 8.86 | ||||
| 2025-08-11 | 13F | Western Wealth Management, LLC | 105,829 | -16.44 | 3,908 | -7.61 | ||||
| 2025-08-13 | 13F | StoneX Group Inc. | 9,092 | -13.95 | 337 | -4.82 | ||||
| 2025-08-19 | 13F | Cim, Llc | 11,182 | 57.54 | 413 | 73.84 | ||||
| 2025-08-14 | 13F | Visionary Wealth Advisors | 15,579 | 3.60 | 575 | 14.54 | ||||
| 2025-07-30 | 13F | Strategic Blueprint, LLC | 647,391 | 8.65 | 23,908 | 20.13 | ||||
| 2025-08-12 | 13F | Proequities, Inc. | 0 | 0 | ||||||
| 2025-08-12 | 13F | Marshall & Sterling Wealth Advisors Inc. | 2,099 | 19.46 | 78 | 32.76 | ||||
| 2025-07-17 | 13F | Investment Advisory Services Inc /tx /adv | 57,850 | 14.38 | 2,136 | 26.47 | ||||
| 2025-07-31 | 13F | Richards, Merrill & Peterson, Inc. | 0 | -100.00 | 0 | |||||
| 2025-08-13 | 13F | Congress Wealth Management LLC / DE / | 37,230 | 7.37 | 1,375 | 17.04 | ||||
| 2025-08-13 | 13F | Summit Wealth Group Llc / Co | 12,396 | 458 | ||||||
| 2025-08-12 | 13F | Putnam Fl Investment Management Co | 14,308 | -63.95 | 528 | -60.15 | ||||
| 2025-07-10 | 13F | Wealth Enhancement Advisory Services, Llc | 673,845 | -1.09 | 25,242 | 10.93 | ||||
| 2025-08-13 | 13F | Baird Financial Group, Inc. | 1,154,988 | 8.29 | 42,654 | 19.74 | ||||
| 2025-07-16 | 13F | St Germain D J Co Inc | 294,083 | 0.36 | 10,860 | 10.96 | ||||
| 2025-07-14 | 13F | AdvisorNet Financial, Inc | 17,216 | 33.51 | 636 | 47.67 | ||||
| 2025-08-13 | 13F | Continuum Advisory, LLC | 112,396 | -6.75 | 4,151 | 3.11 | ||||
| 2025-08-14 | 13F | Mariner, LLC | 52,568 | 23.63 | 1,941 | 36.69 | ||||
| 2025-08-12 | 13F | Wood Tarver Financial Group, LLC | 197 | 0.00 | 0 | -100.00 | ||||
| 2025-08-08 | 13F | Thoroughbred Financial Services, Llc | 121,874 | 11.30 | 4 | 33.33 | ||||
| 2025-08-12 | 13F | J.w. Cole Advisors, Inc. | 48,184 | 21.05 | 1,779 | 33.86 | ||||
| 2025-08-14 | 13F | Challenger Wealth Management | 272,601 | 7.81 | 10,067 | 19.21 | ||||
| 2025-08-08 | 13F | Security Financial Services, INC. | 12,409 | 458 | ||||||
| 2025-07-18 | 13F | Trilogy Capital Inc. | 10,792 | -16.77 | 399 | -8.08 | ||||
| 2025-07-24 | 13F | MSH Capital Advisors LLC | 10,185 | 376 | ||||||
| 2025-07-30 | 13F | Financial Perspectives, Inc | 1,541 | 0.00 | 57 | 9.80 | ||||
| 2025-08-08 | 13F | Cetera Investment Advisers | 4,826,699 | 25.59 | 178,250 | 38.86 | ||||
| 2025-07-30 | 13F | Smith Thornton Advisors LLC | 18,388 | 0.01 | 679 | 10.59 | ||||
| 2025-07-11 | 13F | First PREMIER Bank | 2,234 | 0 | ||||||
| 2025-08-07 | 13F | Allworth Financial LP | 26,870 | 2.19 | 992 | 16.16 | ||||
| 2025-08-11 | 13F | Annis Gardner Whiting Capital Advisors, LLC | 692 | 5.49 | 26 | 19.05 | ||||
| 2025-08-25 | 13F | Silverlake Wealth Management Llc | 14,616 | -0.22 | 540 | 10.22 | ||||
| 2025-07-09 | 13F | Pines Wealth Management, LLC | 64,850 | 7.64 | 2,429 | 34.72 | ||||
| 2025-07-17 | 13F | Janney Montgomery Scott LLC | 548,695 | 23.63 | 20 | 42.86 | ||||
| 2025-08-15 | 13F | Captrust Financial Advisors | 1,828,484 | 6.90 | 67,526 | 18.20 | ||||
| 2025-07-11 | 13F | Lincoln Capital LLC | 26,742 | 7.68 | 988 | 27.03 | ||||
| 2025-05-12 | 13F | Fmr Llc | 0 | -100.00 | 0 | |||||
| 2025-07-25 | 13F | Bill Few Associates, Inc. | 24,482 | 18.67 | 904 | 31.20 | ||||
| 2025-08-14 | 13F | Sei Investments Co | 1,338,685 | 33.84 | 49,438 | 47.98 | ||||
| 2025-07-21 | 13F | Ameritas Advisory Services, LLC | 34,646 | -16.65 | 1,279 | -9.68 | ||||
| 2025-08-08 | 13F | Meridian Wealth Management, LLC | 49,265 | 40.30 | 1,819 | 55.20 | ||||
| 2025-08-01 | 13F | Chilton Capital Management Llc | 2,332 | 149.41 | 86 | 177.42 | ||||
| 2025-08-05 | 13F | Simplex Trading, Llc | 2,886 | 166.73 | 0 | |||||
| 2025-07-23 | 13F | Capital Management Associates, Inc | 59,030 | -50.10 | 2,180 | -44.85 | ||||
| 2025-08-18 | 13F | Wellington Capital Management, Inc. | 7,201 | 1 | ||||||
| 2025-07-22 | 13F | Berger Financial Group, Inc | 115,045 | -6.98 | 4,249 | 2.83 | ||||
| 2025-08-04 | 13F | Creative Financial Designs Inc /adv | 145,220 | -29.89 | 5,363 | -22.49 | ||||
| 2025-08-06 | 13F | Prospera Financial Services Inc | 119,540 | 11.21 | 4,415 | 22.95 | ||||
| 2025-07-11 | 13F | Farther Finance Advisors, LLC | 557 | 21 | ||||||
| 2025-08-12 | 13F | Leigh Baldwin & Co., Llc | 5,503 | 203 | ||||||
| 2025-07-14 | 13F | Abound Wealth Management | 32 | 1 | ||||||
| 2025-07-16 | 13F | Essex Financial Services, Inc. | 266,668 | -0.30 | 9,848 | 10.24 | ||||
| 2025-08-13 | 13F | Capital Analysts, Inc. | 14,073 | 149.12 | 1 | |||||
| 2025-07-16 | 13F | Swisher Financial Concepts, Inc. | 25,081 | -14.05 | 926 | -4.93 | ||||
| 2025-07-31 | 13F | Cambridge Investment Research Advisors, Inc. | 2,493,713 | 10.01 | 92 | 22.67 | ||||
| 2025-08-12 | 13F | CIBC Private Wealth Group, LLC | 2,770 | 0.00 | 102 | 24.39 | ||||
| 2025-05-15 | 13F | MAI Capital Management | 0 | -100.00 | 0 | |||||
| 2025-07-28 | 13F | Axxcess Wealth Management, Llc | 23,011 | -4.37 | 850 | 5.73 | ||||
| 2025-07-23 | 13F | Detalus Advisors, LLC | 8,416 | 0.00 | 311 | 10.32 | ||||
| 2025-05-09 | 13F | Delta Financial Group, Inc. | 17,338 | 5.93 | 1 | |||||
| 2025-08-06 | 13F | Mark Sheptoff Financial Planning, Llc | 2,329 | 0.60 | 86 | 11.69 | ||||
| 2025-05-02 | 13F | Capital A Wealth Management, LLC | 886 | -9.78 | 30 | -14.71 | ||||
| 2025-08-13 | 13F | Aspire Growth Partners LLC | 127,590 | 15.88 | 4,712 | 28.33 | ||||
| 2025-07-22 | 13F | Iron Horse Wealth Management, LLC | 297 | 11 | ||||||
| 2025-08-13 | 13F | Cary Street Partners Financial Llc | 253,233 | -53.93 | 9,352 | -49.06 | ||||
| 2025-08-15 | 13F | Equitable Holdings, Inc. | 138,737 | 162.43 | 5,124 | 190.25 | ||||
| 2025-04-28 | 13F | Strategic Financial Concepts, LLC | 0 | -100.00 | 0 | -100.00 | ||||
| 2025-07-14 | 13F | Ai Financial Services Llc | 108,032 | 17.24 | 3,990 | 29.64 | ||||
| 2025-07-15 | 13F | Fifth Third Bancorp | 1,076 | 40 | ||||||
| 2025-08-12 | 13F | Gladstone Institutional Advisory LLC | 11,156 | -13.48 | 412 | -4.42 | ||||
| 2025-08-14 | 13F | Integrated Wealth Concepts LLC | 142,452 | 28.06 | 5,261 | 41.59 | ||||
| 2025-08-06 | 13F | Vestmark Advisory Solutions, Inc. | 849,562 | 109.73 | 31,374 | 131.90 | ||||
| 2025-08-14 | 13F/A | Rockefeller Capital Management L.P. | 13,898 | 513 | ||||||
| 2025-07-21 | 13F | Barrett & Company, Inc. | 987 | 0.00 | 36 | 12.50 | ||||
| 2025-08-14 | 13F | Gerber Kawasaki Wealth & Investment Management | 180,809 | 5.32 | 6,677 | 16.45 | ||||
| 2025-08-13 | 13F | IAG Wealth Partners, LLC | 2,505 | 14.91 | 93 | 27.78 | ||||
| 2025-08-13 | 13F | Smith, Moore & Co. | 153,458 | -13.98 | 5,667 | -4.88 | ||||
| 2025-07-23 | 13F | Trueblood Wealth Management, LLC | 50,430 | 15.42 | 1,862 | 27.62 | ||||
| 2025-08-01 | 13F | Rossby Financial, LCC | 69 | 0.00 | 3 | 0.00 | ||||
| 2025-08-12 | 13F | LPL Financial LLC | 16,186,883 | 9.10 | 597,782 | 20.63 | ||||
| 2025-08-04 | 13F | Premier Path Wealth Partners, LLC | 32,713 | 0.00 | 1,208 | 10.62 | ||||
| 2025-08-06 | 13F | Founders Financial Securities Llc | 145,839 | 9.85 | 5,386 | 23.88 | ||||
| 2025-07-25 | 13F | Concurrent Investment Advisors, LLC | 92,317 | 130.67 | 3,409 | 155.16 | ||||
| 2025-07-09 | 13F | Procyon Private Wealth Partners, LLC | 16,725 | 0.24 | 618 | 10.77 | ||||
| 2025-08-13 | 13F | Jones Financial Companies Lllp | 3,845,225 | 46.01 | 141,660 | 61.53 | ||||
| 2025-08-14 | 13F | Raymond James Financial Inc | 5,668,346 | 8.63 | 209,332 | 20.11 | ||||
| 2025-08-14 | 13F | Hilltop Holdings Inc. | 6,981 | 258 | ||||||
| 2025-07-17 | 13F | Eclectic Associates Inc /adv | 11,095 | -11.46 | 410 | -2.15 | ||||
| 2025-08-14 | 13F | Jane Street Group, Llc | 160,000 | 11.61 | 5,909 | 23.39 | ||||
| 2025-08-15 | 13F | First Heartland Consultants, Inc. | 18,585 | -53.08 | 686 | -48.11 | ||||
| 2025-07-16 | 13F | ORG Partners LLC | 9,148 | 799.51 | 337 | 891.18 | ||||
| 2025-07-16 | 13F | Signature Resources Capital Management, LLC | 50,455 | 9.14 | 1,863 | 20.66 | ||||
| 2025-05-12 | 13F | Independent Advisor Alliance | 0 | -100.00 | 0 | |||||
| 2025-07-14 | 13F | U.S. Capital Wealth Advisors, LLC | 22,791 | 57.26 | 842 | 73.76 | ||||
| 2025-07-29 | 13F | Stephens Inc /ar/ | 232,010 | 13.50 | 8,568 | 25.50 | ||||
| 2025-08-04 | 13F | IFG Advisory, LLC | 27,806 | 61.95 | 1,027 | 79.06 | ||||
| 2025-07-11 | 13F | AA Financial Advisors, LLC | 381,380 | -0.49 | 14,084 | 10.02 | ||||
| 2025-08-08 | 13F | Sittner & Nelson, Llc | 78,156 | 1.61 | 2,886 | 12.34 | ||||
| 2025-07-15 | 13F | tru Independence LLC | 13,068 | 1.59 | 483 | 12.35 | ||||
| 2025-07-09 | 13F | WealthCare Investment Partners, LLC | 41,906 | 0.50 | 1,570 | 22.67 | ||||
| 2025-08-08 | 13F | Good Life Advisors, LLC | 0 | -100.00 | 0 | |||||
| 2025-08-13 | 13F | Rsm Us Wealth Management Llc | 64,835 | -5.19 | 2,401 | 4.85 | ||||
| 2025-08-12 | 13F | Global Retirement Partners, LLC | 54,362 | 36.33 | 2,008 | 43.97 | ||||
| 2025-08-18 | 13F | Geneos Wealth Management Inc. | 140,501 | 1,807.17 | 5,189 | 2,008.94 | ||||
| 2025-07-23 | 13F | Tcfg Wealth Management, Llc | 27,026 | 97.24 | 998 | 118.38 | ||||
| 2025-08-07 | 13F | Winch Advisory Services, LLC | 1,188 | 0.17 | 44 | 10.26 | ||||
| 2025-08-06 | 13F | Souders Financial Advisors | 932,782 | 5.85 | 34,448 | 17.03 | ||||
| 2025-08-13 | 13F | EverSource Wealth Advisors, LLC | 382,889 | 18.86 | 14,140 | 31.42 | ||||
| 2025-08-12 | 13F | Richmond Investment Services, LLC | 23,406 | 154.16 | 864 | 181.43 | ||||
| 2025-08-14 | 13F | Colony Group, LLC | 25,000 | 163.60 | 923 | 192.09 | ||||
| 2025-07-23 | 13F | Seamount Financial Group Inc | 85,417 | 11.49 | 3,154 | 23.30 | ||||
| 2025-07-24 | 13F | Us Bancorp \de\ | 1,115 | 197.33 | 41 | 241.67 | ||||
| 2025-07-17 | 13F | Venture Visionary Partners LLC | 27,697 | 97.88 | 1,023 | 118.84 | ||||
| 2025-08-14 | 13F | Citadel Advisors Llc | Call | 16,300 | -61.83 | 602 | -57.85 | |||
| 2025-08-14 | 13F | Citadel Advisors Llc | 283,714 | 10,478 | ||||||
| 2025-07-30 | 13F | Eqis Capital Management, Inc. | 18,392 | 58.39 | 679 | 75.45 | ||||
| 2025-08-12 | 13F | O'shaughnessy Asset Management, Llc | 34,302 | 59.51 | 1,267 | 76.32 | ||||
| 2025-07-24 | 13F | Reuter James Wealth Management, Llc | 21,256 | 10.75 | 785 | 22.31 | ||||
| 2025-08-06 | 13F | First Horizon Advisors, Inc. | 3,978 | -38.08 | 147 | -31.78 | ||||
| 2025-08-18 | 13F | N.E.W. Advisory Services LLC | 200 | 0.00 | 7 | 16.67 | ||||
| 2025-07-28 | 13F | Cushing Capital Partners, LLC | 132,159 | -0.96 | 4,893 | 9.51 | ||||
| 2025-08-12 | 13F | Virtu Financial LLC | 108,747 | 4 | ||||||
| 2025-08-13 | 13F | M Holdings Securities, Inc. | 24,292 | 1 | ||||||
| 2025-07-15 | 13F | Norden Group Llc | 53,330 | 0.00 | 1,969 | 10.56 | ||||
| 2025-07-23 | 13F | Prime Capital Investment Advisors, LLC | 12,125 | -16.99 | 448 | -8.21 | ||||
| 2025-07-22 | 13F | Simplicity Wealth,LLC | 26,662 | 124.54 | 985 | 148.48 | ||||
| 2025-07-09 | 13F | Dynamic Advisor Solutions LLC | 184,004 | -12.64 | 6,795 | -3.40 | ||||
| 2025-07-24 | 13F | Stonebridge Financial Group, LLC | 0 | -100.00 | 0 | |||||
| 2025-07-25 | 13F | Apollon Wealth Management, LLC | 54,239 | 2,003 | ||||||
| 2025-08-12 | 13F | SRS Capital Advisors, Inc. | 8,088 | -57.61 | 299 | -53.22 | ||||
| 2025-07-09 | 13F | Massmutual Trust Co Fsb/adv | 2 | 0.00 | 0 | |||||
| 2025-07-31 | 13F | Moloney Securities Asset Management, LLC | 35,996 | 0.98 | 1,329 | 11.68 | ||||
| 2025-08-08 | 13F | Larson Financial Group LLC | 2,465 | 0.00 | 91 | 10.98 | ||||
| 2025-08-14 | 13F | Acas, Llc | 5,212 | 201 | ||||||
| 2025-08-15 | 13F | Kestra Advisory Services, LLC | 1,174,544 | 7.28 | 43,376 | 18.62 | ||||
| 2025-07-17 | 13F | G&S Capital LLC | 99,445 | 0.91 | 3,672 | 11.58 | ||||
| 2025-08-06 | 13F | Golden State Wealth Management, LLC | 0 | -100.00 | 0 | -100.00 | ||||
| 2025-08-13 | 13F | VestGen Advisors, LLC | 264,597 | 4.74 | 9,772 | 15.81 | ||||
| 2025-07-21 | 13F | Ascent Group, LLC | 17,295 | -2.88 | 639 | 7.41 | ||||
| 2025-08-12 | 13F | BlackRock, Inc. | 47,500 | 0.00 | 1,754 | 10.59 | ||||
| 2025-07-15 | 13F | Lynch & Associates/in | 32,360 | 9.89 | 1,195 | 21.57 | ||||
| 2025-08-15 | 13F | Lantern Wealth Advisors, LLC | 9,736 | 360 | ||||||
| 2025-07-02 | 13F | HBW Advisory Services LLC | 39,152 | 35.15 | 1,446 | 49.43 | ||||
| 2025-05-16 | 13F/A | Kestra Investment Management, LLC | 0 | -100.00 | 0 | |||||
| 2025-07-14 | 13F | Armstrong Advisory Group, Inc | 0 | -100.00 | 0 | |||||
| 2025-08-04 | 13F | Clear Investment Research, Llc | 1,805 | 0.28 | 67 | 10.00 | ||||
| 2025-08-14 | 13F | Old Mission Capital Llc | 387,686 | 0.96 | 14,317 | 11.62 | ||||
| 2025-07-21 | 13F | Ashton Thomas Securities, Llc | 56,857 | 9.95 | 2,100 | 21.54 | ||||
| 2025-08-11 | 13F | Synergy Investment Management, LLC | 0 | -100.00 | 0 | |||||
| 2025-07-21 | 13F | Ameriflex Group, Inc. | 435 | -75.28 | 16 | -74.14 | ||||
| 2025-08-14 | 13F | Evergreen Wealth Solutions, LLC | 28,975 | 1,070 | ||||||
| 2025-08-14 | 13F | Susquehanna International Group, Llp | 0 | -100.00 | 0 | |||||
| 2025-08-01 | 13F | Gwn Securities Inc. | 22,540 | -52.82 | 832 | -47.84 | ||||
| 2025-07-25 | 13F | We Are One Seven, LLC | 10,590 | -1.93 | 391 | 8.61 | ||||
| 2025-07-17 | 13F | Tempus Wealth Planning, LLC | 55,855 | 4.59 | 2,063 | 15.65 | ||||
| 2025-08-14 | 13F | Aqr Capital Management Llc | 12,455 | -21.10 | 460 | -12.90 | ||||
| 2025-08-14 | 13F | Hrt Financial Lp | 18,424 | 2.24 | 1 | |||||
| 2025-07-24 | 13F | NavPoint Financial, Inc. | 5,839 | 216 | ||||||
| 2025-07-11 | 13F | LongView Wealth Management | 53,631 | 12.99 | 1,981 | 24.92 | ||||
| 2025-08-12 | 13F | Barnes Pettey Financial Advisors, Llc | 95,366 | -0.92 | 3,522 | 9.55 | ||||
| 2025-08-13 | 13F | Renaissance Technologies Llc | 13,900 | 513 | ||||||
| 2025-08-13 | 13F | Townsquare Capital Llc | 0 | -100.00 | 0 | |||||
| 2025-04-29 | 13F | Lee Danner & Bass Inc | 0 | -100.00 | 0 | |||||
| 2025-08-13 | 13F | Cerity Partners LLC | 31,211 | 0.12 | 1,153 | 10.66 | ||||
| 2025-07-22 | 13F | Beacon Financial Advisory LLC | 20,108 | -4.68 | 743 | 5.40 | ||||
| 2025-08-07 | 13F | Kestra Private Wealth Services, Llc | 31,539 | 15.06 | 1,165 | 27.21 | ||||
| 2025-07-11 | 13F | Lantz Financial LLC | 43,182 | 7.65 | 1,595 | 19.04 | ||||
| 2025-07-28 | 13F | RFG Advisory, LLC | 35,575 | 125.34 | 1,314 | 149.15 | ||||
| 2025-07-14 | 13F | Park Avenue Securities Llc | 109,461 | 11.10 | 4 | 33.33 | ||||
| 2025-07-31 | 13F | West Michigan Advisors, Llc | 5,560 | 205 | ||||||
| 2025-07-23 | 13F | Valmark Advisers, Inc. | 402,564 | 6.79 | 14,867 | 18.08 | ||||
| 2025-07-31 | 13F | Hobart Private Capital, LLC | 14,293 | 4.66 | 528 | 15.57 | ||||
| 2025-08-11 | 13F | HighTower Advisors, LLC | 139,386 | 19.10 | 5,148 | 31.70 | ||||
| 2025-07-28 | 13F | Harbour Investments, Inc. | 412,211 | 0.48 | 15,223 | 11.09 | ||||
| 2025-07-15 | 13F | World Equity Group, Inc. | 7,553 | -13.43 | 279 | -4.47 | ||||
| 2025-04-08 | 13F | Private Client Services, Llc | 0 | -100.00 | 0 | |||||
| 2025-07-09 | 13F | Beacon Financial Group | 8,979 | 0.03 | 332 | 10.70 | ||||
| 2025-07-16 | 13F | Perigon Wealth Management, LLC | 9,374 | 10.59 | 346 | 22.26 | ||||
| 2025-08-07 | 13F | PFG Advisors | 109,197 | 0.51 | 4,033 | 11.14 | ||||
| 2025-07-23 | 13F | Kingswood Wealth Advisors, Llc | 62,571 | -2.10 | 2,311 | 8.25 | ||||
| 2025-08-14 | 13F | Harmony Asset Management Llc | 13,999 | 6.88 | 517 | 18.08 | ||||
| 2025-07-18 | 13F | PFG Investments, LLC | 8,156 | 2.77 | 301 | 13.58 | ||||
| 2025-08-05 | 13F | Westside Investment Management, Inc. | 450 | 17 | ||||||
| 2025-08-13 | 13F | Capital International Investors | 33,275 | 0.01 | 1,229 | 10.53 | ||||
| 2025-08-14 | 13F | Comerica Bank | 12,200 | 3.66 | 451 | 14.50 | ||||
| 2025-08-19 | 13F | Advisory Services Network, LLC | 108,403 | -26.63 | 4,139 | -16.13 | ||||
| 2025-08-29 | 13F | Centaurus Financial, Inc. | 136,665 | 20.14 | 5 | 66.67 | ||||
| 2025-08-11 | 13F | Rothschild Investment Llc | 18,139 | 7.41 | 670 | 18.62 | ||||
| 2025-08-14 | 13F | Bank Of America Corp /de/ | 465,996 | 50.48 | 17,209 | 66.40 | ||||
| 2025-08-14 | 13F | Smartleaf Asset Management LLC | 169,565 | 16.63 | 6,247 | 29.02 | ||||
| 2025-08-15 | 13F | Morgan Stanley | 5,008,826 | 14.95 | 184,976 | 27.09 | ||||
| 2025-07-07 | 13F | Thurston, Springer, Miller, Herd & Titak, Inc. | 6,356 | 24.02 | 235 | 36.84 | ||||
| 2025-08-05 | 13F | GPS Wealth Strategies Group, LLC | 8,520 | -3.80 | 315 | 6.44 | ||||
| 2025-08-14 | 13F/A | Skopos Labs, Inc. | 318 | 12 | ||||||
| 2025-07-25 | 13F | Transcendent Capital Group LLC | 139,941 | 1.08 | 5,168 | 11.79 | ||||
| 2025-07-10 | 13F | Sovran Advisors, LLC | 124,932 | 26.97 | 4,647 | 50.63 | ||||
| 2025-08-01 | 13F | Envestnet Asset Management Inc | 10,327,349 | 13.62 | 381,389 | 25.63 | ||||
| 2025-08-14 | 13F | Ambassador Advisors, LLC | 16,053 | 0.00 | 593 | 10.45 | ||||
| 2025-07-30 | 13F | Cullen/frost Bankers, Inc. | 93,425 | 63.57 | 3,450 | 80.91 | ||||
| 2025-07-31 | 13F | Whipplewood Advisors, LLC | 557 | 4.90 | 21 | 17.65 | ||||
| 2025-07-31 | 13F | Oppenheimer & Co Inc | 21,275 | 89.53 | 786 | 109.89 | ||||
| 2025-08-27 | 13F/A | Brinker Capital Investments, LLC | 411,239 | 1.99 | 15,187 | 12.77 | ||||
| 2025-08-04 | 13F | Kovack Advisors, Inc. | 5,989 | -12.95 | 221 | -3.49 | ||||
| 2025-08-11 | 13F | Nations Financial Group Inc, /ia/ /adv | 44,621 | 16.67 | 1,648 | 28.97 | ||||
| 2025-08-04 | 13F | Pensionmark Financial Group, Llc | 88,604 | 37.07 | 3,272 | 51.55 | ||||
| 2025-08-12 | 13F | Cravens & Co Advisors, LLC | 12,551 | -11.81 | 464 | -2.53 | ||||
| 2025-05-15 | 13F | National Wealth Management Group, LLC | 9,559 | -0.42 | 319 | -4.78 | ||||
| 2025-08-14 | 13F | Mml Investors Services, Llc | 3,032,309 | 11.03 | 112 | 21.98 | ||||
| 2025-07-22 | 13F | Olistico Wealth, LLC | 68,256 | 0.02 | 2,521 | 10.57 | ||||
| 2025-07-16 | 13F | Independent Wealth Network Inc. | 33,719 | 4.57 | 1,245 | 15.71 | ||||
| 2025-08-14 | 13F | Herold Advisors, Inc. | 9,736 | 360 | ||||||
| 2025-07-07 | 13F | Trust Co | 840 | 0.00 | 31 | 10.71 | ||||
| 2025-07-24 | 13F | FinDec Wealth Services, Inc. | 7,739 | -67.82 | 286 | -64.51 | ||||
| 2025-05-15 | 13F/A | Orion Portfolio Solutions, LLC | 403,211 | 12.99 | 13,467 | 7.92 | ||||
| 2025-08-05 | 13F | HFG Advisors, Inc. | 9,925 | 0.00 | 367 | 10.57 | ||||
| 2025-08-14 | 13F | Citadel Advisors Llc | Put | 0 | -100.00 | 0 | ||||
| 2025-08-06 | 13F | Wedbush Securities Inc | 12,745 | -15.44 | 0 | |||||
| 2025-07-16 | 13F | Signaturefd, Llc | 306 | 0.00 | 11 | 10.00 | ||||
| 2025-08-04 | 13F | Assetmark, Inc | 852,157 | 6.14 | 31,470 | 17.36 | ||||
| 2025-08-14 | 13F | GWM Advisors LLC | 826,422 | -17.82 | 30,520 | -9.14 | ||||
| 2025-07-10 | 13F | Affiance Financial, LLC | 262,404 | -46.54 | 9,691 | -40.90 | ||||
| 2025-07-14 | 13F | Sowell Financial Services LLC | 44,258 | 10.81 | 1,634 | 22.49 | ||||
| 2025-08-06 | 13F | Commonwealth Equity Services, Llc | 3,415,953 | 7.31 | 126 | 18.87 | ||||
| 2025-07-03 | 13F | Arvest Investments, Inc. | 409 | 0.00 | 15 | 15.38 | ||||
| 2025-07-08 | 13F | Nbc Securities, Inc. | 175,829 | 8.03 | 6 | 20.00 | ||||
| 2025-07-02 | 13F | Central Pacific Bank - Trust Division | 85 | 0.00 | 3 | 50.00 | ||||
| 2025-07-22 | 13F | Ergawealth Advisors, Inc. | 34,142 | 1,261 | ||||||
| 2025-07-29 | 13F | CapWealth Advisors, LLC | 7,523 | -14.48 | 278 | -5.46 | ||||
| 2025-07-25 | 13F | M.e. Allison & Co., Inc. | 55,598 | 3.02 | 2,053 | 13.93 | ||||
| 2025-08-11 | 13F | Perennial Investment Advisors, LLC | 86,113 | 40.12 | 3,180 | 54.97 | ||||
| 2025-07-29 | 13F | Stratos Wealth Partners, LTD. | 29,374 | 51.30 | 1,085 | 67.28 | ||||
| 2025-07-14 | 13F | Golden State Equity Partners | 0 | -100.00 | 0 | |||||
| 2025-07-23 | 13F | Armstrong, Fleming & Moore, Inc | 42,441 | 1,567 | ||||||
| 2025-07-30 | 13F/A | KPP Advisory Services LLC | 37,341 | 11.06 | 1,379 | 22.91 | ||||
| 2025-08-14 | 13F | Stifel Financial Corp | 847,182 | 14.85 | 31,286 | 26.99 | ||||
| 2025-07-17 | 13F | Worth Financial Advisory Group, LLC | 11,135 | 0.25 | 411 | 11.08 | ||||
| 2025-07-17 | 13F | Nelson, Van Denburg & Campbell Wealth Management Group, LLC | 5,690 | 210 | ||||||
| 2025-07-15 | 13F | Mather Group, Llc. | 0 | -100.00 | 0 | |||||
| 2025-08-12 | 13F | Insigneo Advisory Services, Llc | 6,030 | 223 | ||||||
| 2025-08-13 | 13F | Natixis Advisors, L.p. | 138,283 | 16.96 | 5 | 66.67 | ||||
| 2025-07-28 | 13F | Mutual Advisors, LLC | 193,476 | 32.32 | 7,449 | 55.78 | ||||
| 2025-07-29 | 13F | Private Trust Co Na | 21,081 | 82.96 | 779 | 102.60 | ||||
| 2025-08-04 | 13F | Balentine LLC | 29,107 | 0.00 | 1,075 | 10.49 | ||||
| 2025-08-13 | 13F | Gateway Wealth Partners, LLC | 27,702 | -2.21 | 1,023 | 8.14 | ||||
| 2025-08-12 | 13F | Entruity Wealth, LLC | 314,621 | 7.21 | 11,619 | 18.54 | ||||
| 2025-08-14 | 13F | D. E. Shaw & Co., Inc. | 8,004 | -64.89 | 296 | -61.24 | ||||
| 2025-08-04 | 13F | Mayflower Financial Advisors, LLC | 43,159 | -3.77 | 1,594 | 6.34 | ||||
| 2025-08-07 | 13F | Nwam Llc | 12,975 | 11.35 | 496 | 27.25 | ||||
| 2025-07-16 | 13F | Owen LaRue, LLC | 9,484 | 23.09 | 350 | 36.19 | ||||
| 2025-08-05 | 13F | Carolinas Wealth Consulting Llc | 0 | -100.00 | 0 | -100.00 | ||||
| 2025-08-11 | 13F | Landaas & Co /wi /adv | 19,090 | -9.77 | 705 | -0.28 | ||||
| 2025-08-04 | 13F | Daymark Wealth Partners, Llc | 6,818 | 0.40 | 252 | 11.06 | ||||
| 2025-05-06 | 13F | Venturi Wealth Management, LLC | 0 | -100.00 | 0 | |||||
| 2025-07-22 | 13F | Confluence Wealth Services, Inc. | 38,786 | 12.97 | 1,432 | 31.14 | ||||
| 2025-07-25 | 13F | Envestnet Portfolio Solutions, Inc. | 221,166 | -31.05 | 8,168 | -23.77 | ||||
| 2025-08-13 | 13F | Vermillion & White Wealth Management Group, LLC | 3,965 | 6.53 | 146 | 17.74 | ||||
| 2025-07-18 | 13F | Truist Financial Corp | 186,633 | 8.83 | 6,892 | 20.34 | ||||
| 2025-08-14 | 13F | Advisor OS, LLC | 22,796 | 24.98 | 842 | 38.10 | ||||
| 2025-07-30 | 13F | D.a. Davidson & Co. | 443,816 | 2.12 | 16,390 | 12.91 | ||||
| 2025-07-11 | 13F | Pinnacle Bancorp, Inc. | 192 | 0.00 | 7 | 16.67 | ||||
| 2025-07-18 | 13F | Vicus Capital | 14,937 | 68.17 | 552 | 86.15 | ||||
| 2025-08-27 | 13F | Cypress Capital Advisors, LLC | 12,280 | -27.46 | 454 | -19.82 | ||||
| 2025-08-06 | 13F | TKG Advisors, LLC | 15,936 | 14.24 | 589 | 26.45 | ||||
| 2025-07-30 | 13F | Bleakley Financial Group, LLC | 83,904 | -6.48 | 3,099 | 3.40 | ||||
| 2025-08-13 | 13F | Keystone Financial Group | 52,778 | 16.65 | 1,950 | 29.05 | ||||
| 2025-08-05 | 13F | Plante Moran Financial Advisors, LLC | 0 | -100.00 | 0 | |||||
| 2025-07-24 | 13F | Endeavor Private Wealth, Inc. | 105,721 | 34.58 | 3,915 | 48.82 | ||||
| 2025-07-25 | 13F | Total Clarity Wealth Management, Inc. | 13,493 | -2.41 | 498 | 3.11 | ||||
| 2025-08-12 | 13F | RiverFront Investment Group, LLC | 7,487 | 276 | ||||||
| 2025-08-12 | 13F | Jacobi Capital Management LLC | 19,286 | 712 | ||||||
| 2025-08-14 | 13F | Ameriprise Financial Inc | 11,828 | -80.07 | 437 | -78.00 | ||||
| 2025-08-05 | 13F | Sigma Planning Corp | 23,663 | 26.67 | 874 | 40.13 | ||||
| 2025-08-13 | 13F | Northwestern Mutual Wealth Management Co | 3,865,009 | 8.81 | 142,735 | 20.31 | ||||
| 2025-08-07 | 13F | Resources Investment Advisors, LLC. | 32,528 | -31.16 | 1,201 | -23.89 | ||||
| 2025-08-27 | 13F | Tribridge Partners Financial LLC | 12,065 | 0 | ||||||
| 2025-08-08 | 13F | Capital Investment Advisory Services, LLC | 10,936 | 404 | ||||||
| 2025-07-16 | 13F | Octavia Wealth Advisors, LLC | 11,835 | 2.03 | 438 | 12.89 | ||||
| 2025-08-08 | 13F | Avantax Advisory Services, Inc. | 115,626 | 23.42 | 4,270 | 36.47 | ||||
| 2025-08-14 | 13F | McIlrath & Eck, LLC | 900 | 0.00 | 33 | 10.00 | ||||
| 2025-07-16 | 13F/A | CX Institutional | 330 | 0.00 | 0 | |||||
| 2025-08-14 | 13F | CoreCap Advisors, LLC | 653 | -74.94 | 24 | -72.41 | ||||
| 2025-08-08 | 13F | Creative Planning | 25,191 | 0.43 | 930 | 11.11 | ||||
| 2025-08-12 | 13F | Cornerstone Wealth Management, LLC | 9,461 | 0.00 | 349 | 10.79 | ||||
| 2025-08-14 | 13F | Investmark Advisory Group LLC | 9,782 | -3.42 | 361 | 6.80 |