Mga Batayang Estadistika
| Pemilik Institusional | 235 total, 231 long only, 0 short only, 4 long/short - change of 18.09% MRQ |
| Alokasi Portofolio Rata-rata | 0.2704 % - change of 117.51% MRQ |
| Saham Institusional (Jangka Panjang) | 76,909,085 (ex 13D/G) - change of 41.37MM shares 116.40% MRQ |
| Nilai Institusional (Jangka Panjang) | $ 1,426,824 USD ($1000) |
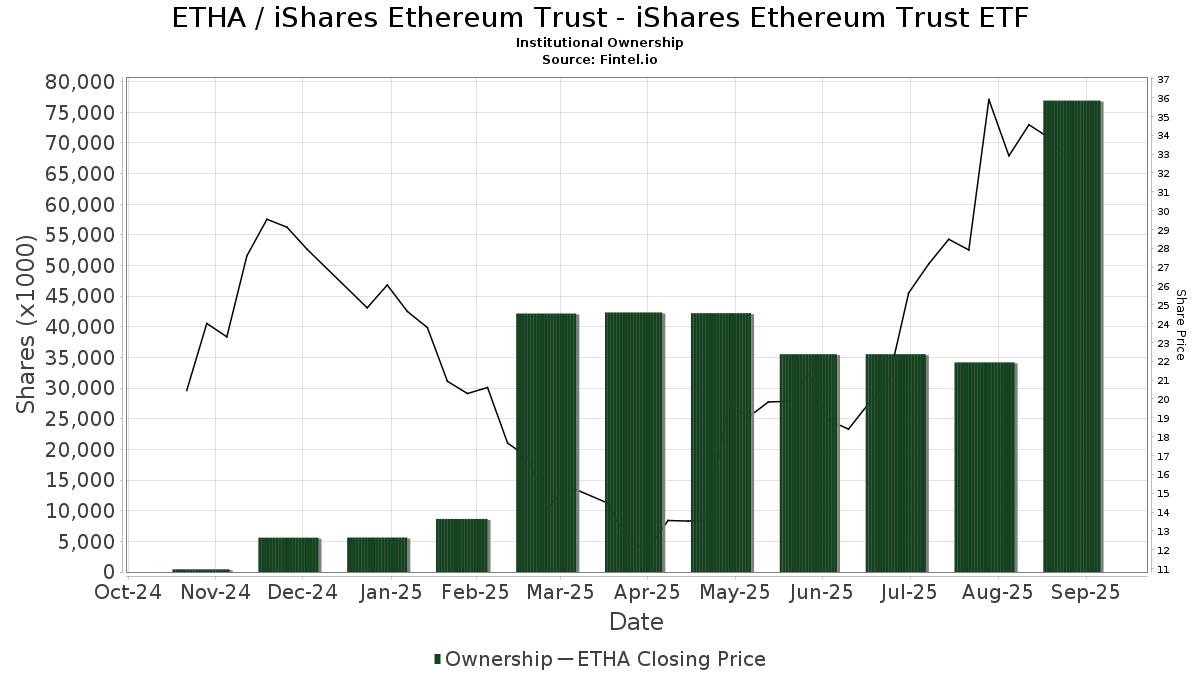
Kepemilikan Institusional dan Pemegang Saham
iShares Ethereum Trust - iShares Ethereum Trust ETF (US:ETHA) memiliki 235 pemilik institusional dan pemegang saham yang telah mengajukan formulir 13D/G atau 13F kepada Komisi Bursa Efek (Securities Exchange Commission/SEC). Lembaga-lembaga ini memegang total 76,909,085 saham. Pemegang saham terbesar meliputi Goldman Sachs Group Inc, Jane Street Group, Llc, Millennium Management Llc, Capula Management Ltd, Schonfeld Strategic Advisors LLC, D. E. Shaw & Co., Inc., Susquehanna International Group, Llp, Citadel Advisors Llc, Jane Street Group, Llc, and BlueCrest Capital Management Ltd .
Struktur kepemilikan institusional iShares Ethereum Trust - iShares Ethereum Trust ETF (NasdaqGM:ETHA) menunjukkan posisi terkini di perusahaan oleh institusi dan dana, serta perubahan terbaru dalam ukuran posisi. Pemegang saham utama dapat mencakup investor individu, reksa dana, dana lindung nilai, atau institusi. Jadwal 13D menunjukkan bahwa investor memegang (atau pernah memegang) lebih dari 5% saham perusahaan dan bermaksud (atau pernah bermaksud) untuk secara aktif mengejar perubahan strategi bisnis. Jadwal 13G menunjukkan investasi pasif lebih dari 5%.
The share price as of September 5, 2025 is 32.77 / share. Previously, on September 6, 2024, the share price was 16.83 / share. This represents an increase of 94.71% over that period.
Skor Sentimen Dana
Skor Sentimen Dana (sebelumnya dikenal sebagai Skor Akumulasi Kepemilikan) menemukan saham-saham yang paling banyak dibeli oleh dana. Ini adalah hasil dari model kuantitatif multi-faktor yang canggih yang mengidentifikasi perusahaan dengan tingkat akumulasi institusional tertinggi. Model penilaian menggunakan kombinasi dari total peningkatan pemilik yang diungkapkan, perubahan dalam alokasi portofolio pada pemilik tersebut, dan metrik lainnya. Angka berkisar dari 0 hingga 100, dengan angka yang lebih tinggi menunjukkan tingkat akumulasi yang lebih tinggi dibandingkan dengan perusahaan sejenisnya, dan 50 adalah rata-ratanya.
Frekuensi Pembaruan: Setiap Hari
Lihat Ownership Explorer, yang menyediakan daftar perusahaan dengan peringkat tertinggi.
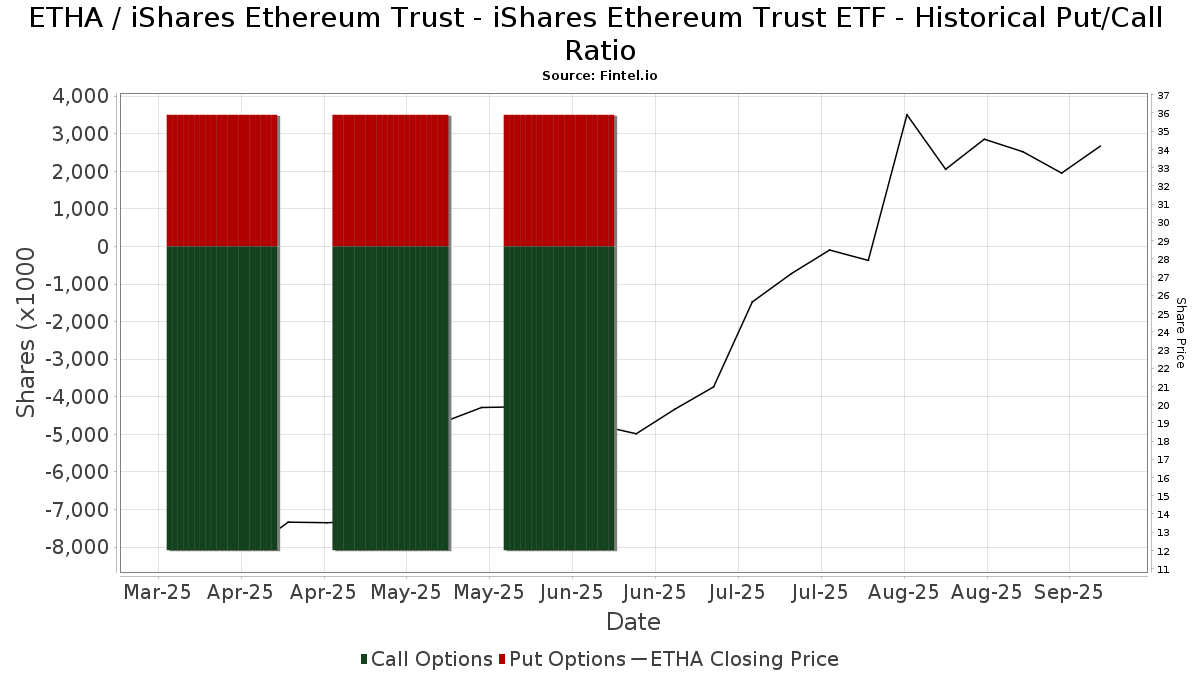
Rasio Put/Call Institusional
Selain melaporkan isu ekuitas dan utang standar, institusi dengan aset di bawah manajemen lebih dari 100 juta dolar AS juga harus mengungkapkan kepemilikan opsi put dan call mereka. Karena opsi put umumnya menunjukkan sentimen negatif, dan opsi call menunjukkan sentimen positif, kita dapat mengetahui sentimen institusional secara keseluruhan dengan memplot rasio put terhadap call. Grafik di sebelah kanan memplot rasio put/call historis untuk instrumen ini.
Menggunakan Rasio Put/Call sebagai indikator sentimen investor mengatasi salah satu kekurangan utama dari penggunaan total kepemilikan institusional, yaitu sejumlah besar aset yang dikelola diinvestasikan secara pasif untuk melacak indeks. Dana yang dikelola secara pasif biasanya tidak membeli opsi, sehingga indikator rasio put/call lebih akurat dalam melacak sentimen dana yang dikelola secara aktif.
Pengajuan 13F dan NPORT
Detail pada pengajuan 13F tersedia gratis. Detail pada pengajuan NP memerlukan keanggotaan premium. Baris berwarna hijau menunjukkan posisi baru. Baris berwarna merah menunjukkan posisi yang sudah ditutup. Klik tautan ini ikon untuk melihat riwayat transaksi selengkapnya.
Tingkatkan
untuk membuka data premium dan mengekspor ke Excel ![]() .
.
| Tanggal File | Sumber | Investor | Ketik | Presyo ng Avg (Silangan) |
Saham | Δ Saham (%) |
Dilaporkan Nilai ($1000) |
Nilai Δ (%) |
Alokasi Port (%) |
|
|---|---|---|---|---|---|---|---|---|---|---|
| 2025-08-06 | 13F | North Capital, Inc. | 25 | 0 | ||||||
| 2025-08-07 | 13F | Fountainhead AM, LLC | 57,690 | 0.73 | 1,100 | 39.06 | ||||
| 2025-05-06 | 13F | VCI Wealth Management LLC | 0 | -100.00 | 0 | |||||
| 2025-07-17 | 13F | Catalytic Wealth RIA, LLC | 0 | -100.00 | 0 | |||||
| 2025-08-07 | 13F | WESCAP Management Group, Inc. | 30,175 | 0.00 | 575 | 37.89 | ||||
| 2025-08-14 | 13F | LaSalle St. Investment Advisors, LLC | 100,000 | 400.00 | 2 | |||||
| 2025-08-18 | 13F | Geneos Wealth Management Inc. | 11,208 | 156.83 | 214 | 255.00 | ||||
| 2025-07-22 | 13F | Valley National Advisers Inc | 118 | 0.00 | 0 | |||||
| 2025-05-15 | 13F | Hrt Financial Lp | 0 | -100.00 | 0 | |||||
| 2025-07-31 | 13F | Glass Jacobson Investment Advisors llc | 300 | 1,100.00 | 6 | |||||
| 2025-08-06 | 13F | New Millennium Group LLC | 2 | 0.00 | 0 | |||||
| 2025-08-08 | 13F | Emerald Investment Partners, Llc | 12,662 | 241 | ||||||
| 2025-08-11 | 13F | Principal Securities, Inc. | 10,314 | 197 | ||||||
| 2025-08-11 | 13F | Annis Gardner Whiting Capital Advisors, LLC | 255 | 5 | ||||||
| 2025-07-24 | 13F | Strong Tower Advisory Services | 19,706 | 0.00 | 376 | 63.76 | ||||
| 2025-07-09 | 13F | Fiduciary Alliance LLC | 211,932 | 46.72 | 4,042 | 102.45 | ||||
| 2025-08-13 | 13F | Northwestern Mutual Wealth Management Co | 217 | 4 | ||||||
| 2025-07-15 | 13F | North Star Investment Management Corp. | 1,550 | 0.00 | 30 | 38.10 | ||||
| 2025-08-13 | 13F | ExodusPoint Capital Management, LP | 0 | -100.00 | 0 | |||||
| 2025-05-15 | 13F | FinDec Wealth Services, Inc. | 0 | -100.00 | 0 | |||||
| 2025-08-08 | 13F | Smithfield Trust Co | 2,132 | 0.00 | 0 | |||||
| 2025-08-14 | 13F | Macquarie Group Ltd | 6,600 | 126 | ||||||
| 2025-08-12 | 13F | MAI Capital Management | 6,643 | 29.97 | 127 | 80.00 | ||||
| 2025-04-17 | 13F | Mission Wealth Management, Lp | 0 | -100.00 | 0 | |||||
| 2025-08-15 | 13F | Captrust Financial Advisors | 19,765 | 22.23 | 377 | 68.61 | ||||
| 2025-07-18 | 13F | Truist Financial Corp | 20,877 | -1.43 | 398 | 36.30 | ||||
| 2025-07-31 | 13F/A | Interchange Capital Partners, LLC | 18,190 | -18.63 | 347 | 12.34 | ||||
| 2025-04-24 | NP | FAAAX - Franklin K2 Alternative Strategies Fund Class A | 7,365 | 0.00 | 124 | -38.50 | ||||
| 2025-07-18 | 13F | SOA Wealth Advisors, LLC. | 0 | -100.00 | 0 | -100.00 | ||||
| 2025-07-28 | 13F | Axxcess Wealth Management, Llc | 20,976 | -2.44 | 400 | 34.68 | ||||
| 2025-08-13 | 13F | Sassicaia Capital Advisers Llc | 37,100 | 707 | ||||||
| 2025-08-14 | 13F | Boston Private Wealth Llc | 0 | -100.00 | 0 | |||||
| 2025-07-15 | 13F | Bfsg, Llc | 605 | 0.00 | 12 | 37.50 | ||||
| 2025-08-14 | 13F | Parkwood LLC | 392,000 | -41.67 | 7 | -22.22 | ||||
| 2025-08-05 | 13F | GPS Wealth Strategies Group, LLC | 250 | 0.00 | 5 | 33.33 | ||||
| 2025-05-02 | 13F | Bogart Wealth, LLC | 0 | -100.00 | 0 | |||||
| 2025-05-15 | 13F | Two Sigma Investments, Lp | 0 | -100.00 | 0 | |||||
| 2025-08-14 | 13F | Schonfeld Strategic Advisors LLC | 4,428,813 | 61.08 | 84,457 | 122.28 | ||||
| 2025-08-13 | 13F | EverSource Wealth Advisors, LLC | 66 | 0.00 | 1 | |||||
| 2025-05-14 | 13F | Himension Fund | 0 | -100.00 | 0 | -100.00 | ||||
| 2025-07-01 | 13F | Harbor Investment Advisory, Llc | 100 | 0.00 | 2 | 0.00 | ||||
| 2025-08-19 | 13F | Asset Dedication, LLC | 0 | -100.00 | 0 | -100.00 | ||||
| 2025-08-14 | 13F | Comerica Bank | 481 | -6.60 | 9 | 28.57 | ||||
| 2025-08-08 | 13F | Fortis Group Advisors, LLC | 8,052 | 228 | ||||||
| 2025-07-31 | 13F | Wealthfront Advisers Llc | 651,867 | -10.40 | 12,431 | 23.64 | ||||
| 2025-08-11 | 13F | Wealthspire Advisors, LLC | 18,679 | -45.87 | 356 | -25.21 | ||||
| 2025-08-14 | 13F | Tikvah Management LLC | 124,000 | 0.00 | 7,590 | 30.77 | ||||
| 2025-08-08 | 13F | Cetera Investment Advisers | 98,145 | 1,872 | ||||||
| 2025-08-13 | 13F | Beacon Pointe Advisors, LLC | 67,505 | -11.57 | 1,287 | 22.11 | ||||
| 2025-07-31 | 13F | Hartford Financial Management Inc. | 65 | 0.00 | 1 | |||||
| 2025-07-24 | 13F | Strengthening Families & Communities, LLC | 70 | 1 | ||||||
| 2025-08-14 | 13F | Royal Bank Of Canada | 1,470 | 5.38 | 27 | 42.11 | ||||
| 2025-08-14 | 13F | Raymond James Financial Inc | 13,388 | 255 | ||||||
| 2025-08-14 | 13F | Betterment LLC | 777,894 | 12.85 | 15 | 55.56 | ||||
| 2025-08-15 | 13F | Asset Allocation Strategies LLC | 16,147 | 0.00 | 308 | 37.67 | ||||
| 2025-04-25 | 13F | K.J. Harrison & Partners Inc | 0 | -100.00 | 0 | -100.00 | ||||
| 2025-05-13 | 13F | Global Endowment Management, LP | 0 | -100.00 | 0 | |||||
| 2025-08-08 | 13F | Larson Financial Group LLC | 604 | 8.05 | 12 | 57.14 | ||||
| 2025-08-14 | 13F | Mariner, LLC | 121,988 | 204.04 | 2,326 | 319.86 | ||||
| 2025-08-11 | 13F | HighTower Advisors, LLC | 64,289 | 99.31 | 1,226 | 175.28 | ||||
| 2025-08-13 | 13F | Quadrature Capital Ltd | 181,730 | 3,464 | ||||||
| 2025-08-29 | 13F | Evolution Wealth Management Inc. | 953 | 18 | ||||||
| 2025-08-13 | 13F | Twin Peaks Wealth Advisors, LLC | 30 | 1 | ||||||
| 2025-08-18 | 13F | Wolverine Trading, Llc | Put | 229,100 | 4,186 | |||||
| 2025-08-18 | 13F | Wolverine Trading, Llc | 68,093 | 1,244 | ||||||
| 2025-08-18 | 13F | Wolverine Trading, Llc | Call | 636,400 | 11,627 | |||||
| 2025-07-15 | 13F | Financial Management Professionals, Inc. | 100 | 0.00 | 2 | 0.00 | ||||
| 2025-08-14 | 13F | D. E. Shaw & Co., Inc. | 3,773,000 | 4.81 | 71,951 | 44.62 | ||||
| 2025-08-12 | 13F | LPL Financial LLC | 473,425 | 19.76 | 9,028 | 65.26 | ||||
| 2025-07-16 | 13F | Moisand Fitzgerald Tamayo, LLC | 14 | 0.00 | 0 | |||||
| 2025-08-14 | 13F | Cantor Fitzgerald, L. P. | 83,526 | -13.49 | 1,593 | 19.34 | ||||
| 2025-08-04 | 13F | Wolverine Asset Management Llc | 900,834 | 24.90 | 17,179 | 72.35 | ||||
| 2025-07-03 | 13F | Garde Capital, Inc. | 16,779 | 0.58 | 320 | 38.70 | ||||
| 2025-08-04 | 13F | Bordeaux Wealth Advisors LLC | 25,100 | 479 | ||||||
| 2025-07-24 | 13F/A | McElhenny Sheffield Capital Management, LLC | 49,511 | 0.00 | 944 | 38.01 | ||||
| 2025-08-07 | 13F | Rossmore Private Capital | 17,794 | 0.00 | 339 | 38.37 | ||||
| 2025-08-13 | 13F | Truvestments Capital Llc | 37,190 | 4,858.67 | 709 | 6,990.00 | ||||
| 2025-07-23 | 13F | Kingswood Wealth Advisors, Llc | 68,777 | 11.22 | 1,312 | 53.51 | ||||
| 2025-05-14 | 13F | Venture Visionary Partners LLC | 0 | -100.00 | 0 | |||||
| 2025-07-10 | 13F | Exchange Traded Concepts, Llc | Call | 1,250,000 | 23,838 | |||||
| 2025-08-14 | 13F | Robertson Opportunity Capital, LLC | 105,300 | 0.00 | 2,008 | 38.01 | ||||
| 2025-08-07 | 13F | Atala Financial Inc | 0 | -100.00 | 0 | |||||
| 2025-08-08 | 13F | Gts Securities Llc | 11,874 | -20.88 | 226 | 9.18 | ||||
| 2025-07-15 | 13F | Kagan Cocozza Asset Management | 11,060 | 0.00 | 211 | 38.16 | ||||
| 2025-08-12 | 13F | Insigneo Advisory Services, Llc | 97,853 | 1.74 | 1,866 | 40.41 | ||||
| 2025-08-12 | 13F | Stevens Capital Management Lp | 13,513 | 0 | ||||||
| 2025-07-23 | 13F | High Note Wealth, LLC | 350 | 7 | ||||||
| 2025-07-25 | 13F | Stonehage Fleming Financial Services Holdings Ltd | 1,234 | 0.00 | 24 | 35.29 | ||||
| 2025-07-23 | 13F | Joel Isaacson & Co., LLC | 20,275 | -1.05 | 387 | 36.40 | ||||
| 2025-08-14 | 13F | Hilltop Holdings Inc. | 0 | -100.00 | 0 | |||||
| 2025-07-23 | 13F | Fluent Financial, LLC | 35,374 | 675 | ||||||
| 2025-08-11 | 13F | Platform Technology Partners | 31,086 | 593 | ||||||
| 2025-04-14 | 13F | Umb Bank N A/mo | 0 | -100.00 | 0 | -100.00 | ||||
| 2025-07-30 | 13F | ARK Investment Management LLC | 6,302 | 0.00 | 120 | 37.93 | ||||
| 2025-08-06 | 13F | Pekin Hardy Strauss, Inc. | 134,845 | 390.08 | 2,571 | 576.58 | ||||
| 2025-08-06 | 13F | Kedalion Capital Management LLP | 481,000 | 9,173 | ||||||
| 2025-05-14 | 13F | Crcm Lp | 0 | -100.00 | 0 | |||||
| 2025-09-04 | 13F/A | Advisor Group Holdings, Inc. | 24,731 | 304.56 | 367 | 336.90 | ||||
| 2025-07-07 | 13F | Thurston, Springer, Miller, Herd & Titak, Inc. | 320 | 6 | ||||||
| 2025-08-08 | 13F | Creative Planning | 53,541 | 18.45 | 1,021 | 63.62 | ||||
| 2025-08-12 | 13F | Richard W. Paul & Associates, LLC | 3,224 | 8.08 | 61 | 48.78 | ||||
| 2025-08-13 | 13F | Diametric Capital, LP | 15,046 | 287 | ||||||
| 2025-08-12 | 13F | Steward Partners Investment Advisory, Llc | 2,300 | 44 | ||||||
| 2025-05-15 | 13F | Sculptor Capital LP | 0 | -100.00 | 0 | |||||
| 2025-08-14 | 13F | Ionic Capital Management LLC | 25,000 | 477 | ||||||
| 2025-07-25 | 13F | Concurrent Investment Advisors, LLC | 126,729 | 2,417 | ||||||
| 2025-08-04 | 13F | Deuterium Capital Management, LLC | 30,000 | 0.00 | 572 | 38.16 | ||||
| 2025-08-14 | 13F | Clark Capital Management Group, Inc. | 128,480 | -33.37 | 2,450 | -8.03 | ||||
| 2025-08-11 | 13F | Persistent Asset Partners Ltd | 85,897 | 1,638 | ||||||
| 2025-07-16 | 13F | Highline Wealth Partners Llc | 750 | 0.00 | 14 | 40.00 | ||||
| 2025-07-21 | 13F | Andina Capital Management, LLC | 38,664 | 37.84 | 737 | 90.44 | ||||
| 2025-08-13 | 13F | WCG Wealth Advisors LLC | 34,081 | 31.94 | 650 | 82.30 | ||||
| 2025-06-26 | NP | DECO - SPDR Galaxy Digital Asset Ecosystem ETF | 0 | -100.00 | 0 | -100.00 | ||||
| 2025-07-15 | 13F | SJS Investment Consulting Inc. | 389 | 0.00 | 7 | 40.00 | ||||
| 2025-08-11 | 13F | Tidemark, LLC | 198 | 4 | ||||||
| 2025-08-12 | 13F | J.w. Cole Advisors, Inc. | 33,501 | 639 | ||||||
| 2025-06-26 | NP | HECO - SPDR Galaxy Hedged Digital Asset Ecosystem ETF | 0 | -100.00 | 0 | -100.00 | ||||
| 2025-08-08 | 13F | Hartland & Co., LLC | 1,240 | 0.00 | 24 | 35.29 | ||||
| 2025-05-12 | 13F | National Bank Of Canada /fi/ | 0 | -100.00 | 0 | -100.00 | ||||
| 2025-08-14 | 13F | Citadel Advisors Llc | Put | 625,500 | 11,928 | |||||
| 2025-08-13 | 13F | Cerity Partners LLC | 783,008 | 119.70 | 14,932 | 203.17 | ||||
| 2025-08-14 | 13F | Brevan Howard Capital Management LP | 43,675 | 806 | ||||||
| 2025-07-17 | 13F | Nelson, Van Denburg & Campbell Wealth Management Group, LLC | 13,770 | -0.39 | 263 | 37.17 | ||||
| 2025-08-01 | 13F | Belvedere Trading LLC | 13,585 | 259 | ||||||
| 2025-08-14 | 13F | Citadel Advisors Llc | 2,319,250 | 71.18 | 44,228 | 136.21 | ||||
| 2025-08-01 | 13F | Belvedere Trading LLC | Call | 1,500 | 29 | |||||
| 2025-08-11 | 13F | Elequin Capital Lp | 712,497 | 9,277.43 | 13,587 | 12,840.00 | ||||
| 2025-08-14 | 13F | Bank Of America Corp /de/ | 3,700 | 0.00 | 71 | 37.25 | ||||
| 2025-07-17 | 13F | Wolff Wiese Magana Llc | 1,277 | -35.89 | 24 | -11.11 | ||||
| 2025-08-14 | 13F | Citadel Advisors Llc | Call | 1,109,600 | 21,160 | |||||
| 2025-08-14 | 13F | Apollo Management Holdings, L.P. | 0 | -100.00 | 0 | |||||
| 2025-07-25 | 13F | Cwm, Llc | 34,814 | 74.31 | 1 | |||||
| 2025-08-12 | 13F | XTX Topco Ltd | 20,647 | 394 | ||||||
| 2025-08-13 | 13F | BCJ Capital Management, LLC | 10,500 | 200 | ||||||
| 2025-08-15 | 13F | CI Private Wealth, LLC | 14,420 | 275 | ||||||
| 2025-05-15 | 13F | London & Capital Asset Management Ltd | 0 | -100.00 | 0 | -100.00 | ||||
| 2025-08-14 | 13F | Van Eck Associates Corp | 0 | -100.00 | 0 | |||||
| 2025-08-14 | 13F | Susquehanna International Group, Llp | Put | 1,109,900 | 21,166 | |||||
| 2025-08-15 | 13F | Kestra Advisory Services, LLC | 13,325 | 11.52 | 254 | 53.94 | ||||
| 2025-08-14 | 13F | Susquehanna International Group, Llp | 939,054 | 99.84 | 17,908 | 175.75 | ||||
| 2025-08-14 | 13F | BlueCrest Capital Management Ltd | 1,500,000 | 28,605 | ||||||
| 2025-08-14 | 13F | Susquehanna International Group, Llp | Call | 3,321,200 | 63,335 | |||||
| 2025-08-12 | 13F | CIBC Private Wealth Group, LLC | 571 | -78.85 | 11 | -65.52 | ||||
| 2025-08-13 | 13F | Flow Traders U.s. Llc | 0 | -100.00 | 0 | |||||
| 2025-07-28 | 13F | RFG Advisory, LLC | 47,304 | 131.38 | 902 | 219.86 | ||||
| 2025-04-10 | 13F | Watershed Private Wealth Llc | 0 | -100.00 | 0 | |||||
| 2025-04-22 | 13F | Synergy Financial Management, LLC | 0 | -100.00 | 0 | |||||
| 2025-07-14 | 13F | Cobblestone Asset Management LLC | 76,020 | 30.57 | 1,450 | 80.22 | ||||
| 2025-07-31 | 13F | Cambridge Investment Research Advisors, Inc. | 108,096 | 16.26 | 2 | 100.00 | ||||
| 2025-08-14 | 13F | Smartleaf Asset Management LLC | 0 | -100.00 | 0 | |||||
| 2025-08-12 | 13F | Global Retirement Partners, LLC | 69,314 | 9.54 | 1,322 | -17.44 | ||||
| 2025-08-12 | 13F | Jpmorgan Chase & Co | 111 | -97.85 | 2 | -97.18 | ||||
| 2025-07-11 | 13F | Farther Finance Advisors, LLC | 16,855 | 250.49 | 321 | 365.22 | ||||
| 2025-08-12 | 13F | Park Square Financial Group, LLC | 59 | 136.00 | 1 | |||||
| 2025-08-13 | 13F | Kilter Group LLC | 750 | 14 | ||||||
| 2025-08-14 | 13F | Vienna Asset Management LLC | 247,027 | 4,711 | ||||||
| 2025-07-17 | 13F | DiNuzzo Private Wealth, Inc. | 200 | 0.00 | 4 | 50.00 | ||||
| 2025-08-13 | 13F | Clear Street Derivatives LLC | 0 | -100.00 | 0 | |||||
| 2025-08-14 | 13F | Dagco, Inc. | 449 | 12.25 | 9 | 60.00 | ||||
| 2025-08-15 | 13F | Provenance Wealth Advisors, LLC | 873 | 0.00 | 17 | 33.33 | ||||
| 2025-08-14 | 13F | Financial Engines Advisors L.L.C. | 94,472 | 0.93 | 1,802 | 39.26 | ||||
| 2025-07-18 | 13F | Precision Wealth Strategies, LLC | 15,951 | 27.30 | 304 | 75.72 | ||||
| 2025-07-21 | 13F | Patriot Financial Group Insurance Agency, LLC | 11,512 | 220 | ||||||
| 2025-08-08 | 13F | Tortoise Investment Management, LLC | 4,000 | 60.00 | 76 | 123.53 | ||||
| 2025-08-11 | 13F | Mill Creek Capital Advisors, LLC | 0 | -100.00 | 0 | |||||
| 2025-07-30 | 13F | FNY Investment Advisers, LLC | 12,303 | 1,130.30 | 0 | |||||
| 2025-08-11 | 13F | Cornerstone Planning Group LLC | 4,726 | 6.78 | 128 | 115.25 | ||||
| 2025-08-14 | 13F | Engineers Gate Manager LP | 218,221 | -14.29 | 4,161 | 18.28 | ||||
| 2025-08-14 | 13F | Quantitative Investment Management, LLC | 34,784 | 1 | ||||||
| 2025-08-13 | 13F | Maplelane Capital, Llc | Call | 300,000 | 5,721 | |||||
| 2025-08-13 | 13F | Maplelane Capital, Llc | 325,000 | 6,198 | ||||||
| 2025-08-06 | 13F | Titan Global Capital Management Usa Llc | 1,317,322 | -4.25 | 25,121 | 32.12 | ||||
| 2025-08-14 | 13F | Toroso Investments, LLC | Call | 219 | 0 | |||||
| 2025-08-05 | 13F | Yong Rong (HK) Asset Management Ltd | 796,000 | 15 | ||||||
| 2025-07-18 | 13F | Requisite Capital Management, LLC | 74,463 | -2.33 | 1,420 | 34.85 | ||||
| 2025-08-14 | 13F | UBS Group AG | 312,498 | 620.91 | 5,959 | 894.82 | ||||
| 2025-07-24 | 13F | Us Bancorp \de\ | 21,750 | 6.15 | 415 | 46.29 | ||||
| 2025-08-14 | 13F | Toroso Investments, LLC | 21,999 | 420 | ||||||
| 2025-07-31 | 13F | AlTi Global, Inc. | 0 | -100.00 | 0 | |||||
| 2025-08-14 | 13F | Jane Street Group, Llc | Call | 717,000 | 13,673 | |||||
| 2025-07-15 | 13F | Cordant, Inc. | 0 | -100.00 | 0 | |||||
| 2025-08-05 | 13F | Freestone Capital Holdings, LLC | 36,787 | 46.52 | 702 | 102.60 | ||||
| 2025-08-14 | 13F | Jane Street Group, Llc | 6,837,299 | 124.02 | 130,387 | 209.13 | ||||
| 2025-05-02 | 13F | Legacy Capital Wealth Partners, LLC | 0 | -100.00 | 0 | |||||
| 2025-08-14 | 13F | Beck Capital Management, Llc | 10,914 | 208 | ||||||
| 2025-08-14 | 13F | Marathon Asset Management Lp | 160,000 | 3,051 | ||||||
| 2025-07-25 | 13F | Almanack Investment Partners, LLC. | 18,001 | 343 | ||||||
| 2025-08-01 | 13F | Envestnet Asset Management Inc | 412,241 | -80.59 | 7,861 | -73.22 | ||||
| 2025-08-07 | 13F | Winthrop Capital Management, LLC | 0 | -100.00 | 0 | |||||
| 2025-07-23 | 13F | Lansing Street Advisors | 25,966 | 0.00 | 495 | 38.27 | ||||
| 2025-07-17 | 13F | Oakworth Capital, Inc. | 12,220 | 0.00 | 233 | 38.69 | ||||
| 2025-08-13 | 13F | Cresset Asset Management, LLC | 210,542 | 174.75 | 4,015 | 279.13 | ||||
| 2025-08-14 | 13F | Jane Street Group, Llc | Put | 1,540,900 | 29,385 | |||||
| 2025-07-22 | 13F | FFG Partners, LLC | 70,600 | 1,346 | ||||||
| 2025-07-08 | 13F | Nbc Securities, Inc. | 370 | 0.00 | 0 | |||||
| 2025-07-28 | 13F | Kiker Wealth Management, LLC | 1,982 | 0.00 | 38 | 37.04 | ||||
| 2025-08-11 | 13F | Tamar Securities, LLC | 34,021 | 25.91 | 649 | 73.73 | ||||
| 2025-05-15 | 13F | Sepio Capital, LP | 0 | -100.00 | 0 | |||||
| 2025-08-14 | 13F | Prelude Capital Management, Llc | 30,887 | 589 | ||||||
| 2025-08-14 | 13F | L2 Asset Management, LLC | 22,883 | 436 | ||||||
| 2025-08-07 | 13F | Hughes Financial Services, LLC | 52 | 0.00 | 1 | |||||
| 2025-07-16 | 13F | Maridea Wealth Management LLC | 22,188 | 423 | ||||||
| 2025-08-08 | 13F | Central Asset Investments & Management Holdings (HK) Ltd | 59,580 | 96.12 | 1,136 | 171.12 | ||||
| 2025-08-14 | 13F | Federation des caisses Desjardins du Quebec | 3,251 | 391.09 | 62 | 577.78 | ||||
| 2025-07-30 | 13F | Brookstone Capital Management | 18,297 | 7.59 | 349 | 48.09 | ||||
| 2025-08-07 | 13F | Parkside Financial Bank & Trust | 700 | 0.00 | 13 | 44.44 | ||||
| 2025-07-28 | 13F | Mutual Advisors, LLC | 39,963 | 1,102 | ||||||
| 2025-04-11 | 13F | Lake Hills Wealth Management, LLC | 0 | -100.00 | 0 | -100.00 | ||||
| 2025-04-24 | 13F | Transcend Wealth Collective, Llc | 0 | -100.00 | 0 | |||||
| 2025-08-13 | 13F | Mount Yale Investment Advisors, LLC | 45,632 | 7.99 | 870 | 49.23 | ||||
| 2025-07-23 | 13F | Vontobel Holding Ltd. | 25,333 | 483 | ||||||
| 2025-08-14 | 13F | Graham Capital Management, L.P. | 525,000 | 26.51 | 10,012 | 74.56 | ||||
| 2025-07-14 | 13F | Park Avenue Securities Llc | 13,673 | -9.27 | 0 | |||||
| 2025-08-14 | 13F | Qube Research & Technologies Ltd | 0 | -100.00 | 0 | |||||
| 2025-08-12 | 13F | BlackRock, Inc. | 51,124 | 975 | ||||||
| 2025-07-28 | 13F | Harbour Investments, Inc. | 4,313 | 16.82 | 82 | 60.78 | ||||
| 2025-08-12 | 13F | Manchester Capital Management LLC | 10,345 | 55.92 | 197 | 116.48 | ||||
| 2025-07-25 | 13F | We Are One Seven, LLC | 24,726 | 16.27 | 472 | 60.75 | ||||
| 2025-05-15 | 13F | Mercer Global Advisors Inc /adv | 0 | -100.00 | 0 | |||||
| 2025-08-11 | 13F | Hexagon Capital Partners LLC | 0 | -100.00 | 0 | |||||
| 2025-08-14 | 13F | Headlands Technologies LLC | 3,077 | -38.81 | 59 | -15.94 | ||||
| 2025-08-11 | 13F | Private Advisor Group, LLC | 22,735 | -89.88 | 434 | -86.05 | ||||
| 2025-07-16 | 13F | Formidable Asset Management, LLC | 20,620 | 0.00 | 285 | 0.00 | ||||
| 2025-08-11 | 13F | Compass Capital Corp /ma/ /adv | 59,894 | 28.37 | 1,955 | 250.18 | ||||
| 2025-07-24 | 13F | Stonebridge Financial Group, LLC | 0 | -100.00 | 0 | |||||
| 2025-08-14 | 13F | Millennium Management Llc | 5,809,663 | 110,790 | ||||||
| 2025-04-30 | 13F | Alpine Woods Capital Investors, Llc | 0 | -100.00 | 0 | |||||
| 2025-05-19 | 13F | Game Plan Financial Advisors, LLC | 0 | -100.00 | 0 | |||||
| 2025-05-14 | 13F | Oarsman Capital, Inc. | 0 | -100.00 | 0 | |||||
| 2025-08-14 | 13F | Almitas Capital LLC | 219,405 | 4,184 | ||||||
| 2025-07-10 | 13F | Peoples Bank/KS | 0 | -100.00 | 0 | |||||
| 2025-07-09 | 13F | Krilogy Financial LLC | 222,165 | 4,237 | ||||||
| 2025-08-14 | 13F | Mml Investors Services, Llc | 60,738 | 19.83 | 1 | |||||
| 2025-07-29 | 13F | Private Trust Co Na | 86 | -16.50 | 2 | 0.00 | ||||
| 2025-08-06 | 13F | Commonwealth Equity Services, Llc | 36,897 | -2.02 | 1 | |||||
| 2025-08-08 | 13F | Pnc Financial Services Group, Inc. | 1,220 | -71.53 | 23 | -61.02 | ||||
| 2025-08-15 | 13F | Morgan Stanley | 23,377 | -11.78 | 446 | 21.58 | ||||
| 2025-08-12 | 13F | Proequities, Inc. | 0 | 0 | ||||||
| 2025-05-07 | 13F | Texas Yale Capital Corp. | 0 | -100.00 | 0 | -100.00 | ||||
| 2025-08-11 | 13F | CBIZ Investment Advisory Services, LLC | 0 | -100.00 | 0 | |||||
| 2025-07-14 | 13F | Ridgewood Investments LLC | 10,976 | 308.79 | 209 | 464.86 | ||||
| 2025-08-14 | 13F | Benjamin Edwards Inc | 118,157 | -3.57 | 2,253 | 33.08 | ||||
| 2025-08-19 | 13F | Marex Group plc | 887,275 | 16,920 | ||||||
| 2025-07-25 | 13F | LRI Investments, LLC | 10,000 | 0.00 | 191 | 37.68 | ||||
| 2025-07-14 | 13F | UMA Financial Services, Inc. | 90 | 0.00 | 2 | 0.00 | ||||
| 2025-07-28 | 13F | Copia Wealth Management | 5,432 | 48.62 | 104 | 106.00 | ||||
| 2025-08-04 | 13F | Impact Partnership Wealth, LLC | 49,316 | 6.59 | 940 | 47.10 | ||||
| 2025-08-14 | 13F | LM Advisors LLC | 14,320 | 0 | ||||||
| 2025-08-13 | 13F | Kaleidoscope Capital Lp | 1,359,589 | 122.68 | 25,927 | 207.30 | ||||
| 2025-08-14 | 13F | Weiss Asset Management LP | 635,354 | 92.54 | 12,116 | 165.70 | ||||
| 2025-07-24 | 13F | IFP Advisors, Inc | 5,721 | 17.79 | 109 | 62.69 | ||||
| 2025-08-14 | 13F | Logan Stone Capital, LLC | 1,379,690 | 26,311 | ||||||
| 2025-08-14 | 13F | Old Mission Capital Llc | 43,317 | -9.58 | 826 | 24.77 | ||||
| 2025-05-14 | 13F | Monolith Management Ltd | 0 | -100.00 | 0 | -100.00 | ||||
| 2025-08-29 | 13F | Total Investment Management Inc | 55,554 | 317.26 | 1,059 | 478.69 | ||||
| 2025-08-13 | 13F | Texas Capital Bank Wealth Management Services Inc | 18,745 | -5.55 | 357 | 30.29 | ||||
| 2025-08-14 | 13F | J. Goldman & Co LP | 82,502 | 1,573 | ||||||
| 2025-08-15 | 13F | Tower Research Capital LLC (TRC) | 747 | 14 | ||||||
| 2025-07-30 | 13F | LGT Financial Advisors LLC | 14 | 0.00 | 0 | |||||
| 2025-07-30 | 13F | Atlantic Edge Private Wealth Management, LLC | 9,500 | 181 | ||||||
| 2025-08-13 | 13F | Capula Management Ltd | 5,354,800 | 195.47 | 102,116 | 307.73 | ||||
| 2025-04-15 | 13F | SG Americas Securities, LLC | 0 | -100.00 | 0 | |||||
| 2025-07-22 | 13F | Capital Advisors Inc/ok | 17,500 | 20 | ||||||
| 2025-07-15 | 13F | Compagnie Lombard Odier SCmA | 2,500 | 0.00 | 48 | 38.24 | ||||
| 2025-08-19 | 13F | Newbridge Financial Services Group, Inc. | 170 | 0.00 | 3 | 50.00 | ||||
| 2025-08-13 | 13F | Clear Street Llc | 1,028,792 | 19,619 | ||||||
| 2025-08-14 | 13F | Farringdon Capital, Ltd. | 105,291 | 46.20 | 2,008 | 101.71 | ||||
| 2025-08-12 | 13F | Virtu Financial LLC | 0 | -100.00 | 0 | |||||
| 2025-08-12 | 13F | SRS Capital Advisors, Inc. | 238 | 0.00 | 5 | 33.33 | ||||
| 2025-08-01 | 13F | Ashton Thomas Private Wealth, LLC | 26,228 | 0.30 | 500 | 38.50 | ||||
| 2025-08-14 | 13F | Wells Fargo & Company/mn | 64 | -68.00 | 1 | -50.00 | ||||
| 2025-07-31 | 13F | DDD Partners, LLC | 26,303 | 117.09 | 502 | 200.00 | ||||
| 2025-08-11 | 13F | Brown Brothers Harriman & Co | 22,565 | 0.00 | 430 | 38.26 | ||||
| 2025-07-10 | 13F | Wealth Enhancement Advisory Services, Llc | 34,910 | 680 | ||||||
| 2025-08-06 | 13F | SOUTH STATE Corp | 0 | -100.00 | 0 | |||||
| 2025-08-06 | 13F | First Horizon Advisors, Inc. | 3,918 | -26.15 | 75 | 1.37 | ||||
| 2025-08-14 | 13F | DRW Securities, LLC | 0 | -100.00 | 0 | |||||
| 2025-07-30 | 13F | Whittier Trust Co | 1,950 | 0.00 | 37 | 42.31 | ||||
| 2025-08-14 | 13F | Integrated Wealth Concepts LLC | 11,629 | 222 | ||||||
| 2025-07-22 | 13F | IMC-Chicago, LLC | 52,685 | -68.17 | 1,005 | -56.10 | ||||
| 2025-08-14 | 13F | Harvey Capital Management Inc | 10,000 | 0.00 | 182 | 31.16 | ||||
| 2025-05-14 | 13F | Napa Wealth Management | 0 | -100.00 | 0 | |||||
| 2025-07-21 | 13F | J. Safra Sarasin Holding AG | 19,050 | 14.33 | 363 | 57.83 | ||||
| 2025-08-05 | 13F | Bank Of Montreal /can/ | 44,074 | -44.15 | 840 | -22.94 | ||||
| 2025-08-13 | 13F | Hbk Investments L P | 199,020 | 3,795 | ||||||
| 2025-07-24 | 13F | VanderPol Investments L.L.C. | 16,554 | 1.88 | 316 | 40.63 | ||||
| 2025-08-04 | 13F | Spire Wealth Management | 1,591 | 6.85 | 30 | 50.00 | ||||
| 2025-08-14 | 13F | GWM Advisors LLC | 16,456 | 30.52 | 314 | 79.89 | ||||
| 2025-08-07 | 13F | Bearing Point Capital, Llc | 0 | -100.00 | 0 | |||||
| 2025-07-09 | 13F | Sapient Capital Llc | 24,688 | -0.13 | 471 | 37.83 | ||||
| 2025-07-14 | 13F | Proathlete Wealth Management Llc | 1,668 | 10.10 | 32 | 55.00 | ||||
| 2025-08-11 | 13F | NewEdge Wealth, LLC | 7,855 | 230 | ||||||
| 2025-07-16 | 13F | Howard Capital Management Group, LLC | 17,350 | 0.00 | 331 | 38.08 | ||||
| 2025-07-31 | 13F | Curio Wealth, Llc | 168 | 16,700.00 | 3 | -25.00 | ||||
| 2025-08-14 | 13F | Hurley Capital, LLC | 285 | 0.00 | 5 | 66.67 | ||||
| 2025-07-14 | 13F | U.S. Capital Wealth Advisors, LLC | 19,331 | 0.56 | 369 | 38.87 | ||||
| 2025-07-16 | 13F | Signaturefd, Llc | 0 | -100.00 | 0 | |||||
| 2025-07-10 | 13F | Clare Market Investments LLC | 15,905 | -42.54 | 303 | -20.68 | ||||
| 2025-08-19 | 13F | Cape Investment Advisory, Inc. | 4,115 | 0.00 | 78 | 39.29 | ||||
| 2025-08-14 | 13F | Goldman Sachs Group Inc | Call | 750,000 | 14,302 | |||||
| 2025-07-08 | 13F | Parallel Advisors, LLC | 14,372 | 58.51 | 274 | 119.20 | ||||
| 2025-08-14 | 13F | Goldman Sachs Group Inc | 24,902,219 | 282.72 | 474,885 | 428.12 | ||||
| 2025-07-14 | 13F | LCM Capital Management Inc | 117,430 | 4.35 | 2,239 | 43.99 | ||||
| 2025-08-07 | 13F | Allworth Financial LP | 2,655 | -11.06 | 51 | 28.21 | ||||
| 2025-07-29 | 13F | Activest Wealth Management | 245 | 0.00 | 5 | 33.33 |
Other Listings
| PE:ETHA |